You are not logged in.
This means you
CAN ONLY VIEW reports that were published prior to Tuesday, March 11, 2025.
You
MUST UPGRADE YOUR MEMBERSHIP if you want to see any current reports.
AFTER MARKET UPDATE - WEDNESDAY, APRIL 6TH, 2022
Previous After Market Report Next After Market Report >>>
|
|
|
|
DOW |
-144.67 |
34,496.51 |
-0.42% |
|
Volume |
1,051,755,281 |
+7% |
|
Volume |
5,237,139,000 |
+14% |
|
NASDAQ |
-315.35 |
13,888.82 |
-2.22% |
|
Advancers |
902 |
28% |
|
Advancers |
1,365 |
31% |
|
S&P 500 |
-43.97 |
4,481.15 |
-0.97% |
|
Decliners |
2,300 |
72% |
|
Decliners |
3,065 |
69% |
|
Russell 2000 |
-29.11 |
2,016.94 |
-1.42% |
|
52 Wk Highs |
71 |
|
|
52 Wk Highs |
57 |
|
|
S&P 600 |
-15.10 |
1,281.32 |
-1.16% |
|
52 Wk Lows |
271 |
|
|
52 Wk Lows |
308 |
|
|
 |
Major Indices Fell Amidst Defensive Posturing
Kenneth J. Gruneisen - Passed the CAN SLIM® Master's Exam
The Dow lost 144 points, while the S&P 500 fell 1%. The Nasdaq Composite retreated 2.2%, extending Tuesday’s sell-off in growth-related shares. Volume totals reported were higher than the prior session on the NYSE and on the Nasdaq exchange, revealing an increase in institutional selling. Breadth was negative as decliners led advancers by about a 5-2 margin on the NYSE and more than 2-1 on the Nasdaq exchange. There were 34 high-ranked companies from the Leaders List that hit new 52-week highs and were listed on the BreakOuts Page, versus 37 on the prior session. New 52-week lows totals expanded and solidly outnumbered new 52-week highs on the NYSE and on the Nasdaq exchange. The recently noted follow-through day confirmed a new uptrend (M criteria). Strict followers of the fact-based investment system only buy stocks fitting all key fundamental and technical investment criteria.
Chart courtesy of www.stockcharts.com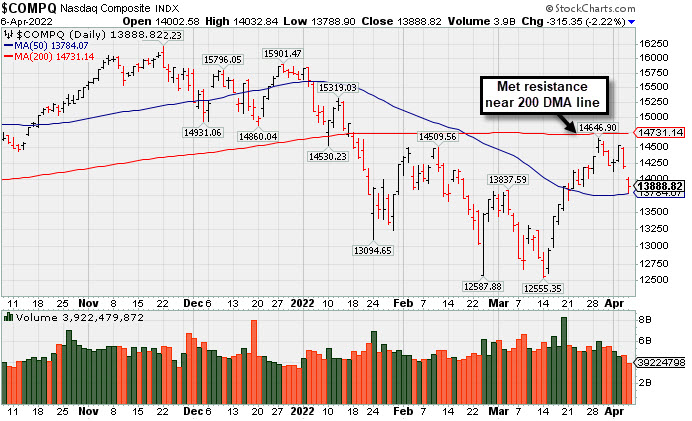 PICTURED: The Nasdaq Composite Index met resistance near its 200-day moving average (DMA) line and has slumped back to its 50 DMA line.
U.S. stocks finished lower on Wednesday as investors grappled with a swift back-up in Treasury yields and digested the Federal Reserve’s (Fed) March meeting minutes. The release revealed that officials “generally agreed” to reduce the size of its nearly $9 trillion balance sheet by $95 billion per month, beginning as soon as their May 4 meeting. The minutes also set the expectation that some of the upcoming interest rate hikes could come in larger 0.50% intervals as policymakers remain committed to clamping down on persistent inflation.
Six of 11 S&P 500 sectors closed in negative territory, with Consumer Discretionary and Technology stocks leading the downturn. The more traditionally defensive Utilities and Health Care groups were among the outperformers amid the perceived risk-off tone.
Meanwhile, a rout in longer-dated Treasuries continued as bond markets priced in the most aggressive pace of monetary tightening since 1994. The yield on the 10-year note climbed five basis points (0.05%) to 2.60%, a three-year high, following its biggest single-session increase since March 2020 on Tuesday (+0.15%). Yesterday, Fed Governor Lael Brainard struck a hawkish tone, stating that easing inflation was “of paramount importance” and that the balance sheet run-off would likely occur at a “rapid pace.”
In commodities, West Texas Intermediate crude dropped 4.7% to $97.22/barrel following reports the International Energy Agency would release 60 million barrels of crude, adding to the massive stockpile release announced by the U.S. last week. Separately, data showed an unexpected weekly buildup in domestic crude inventories.
|
 Kenneth J. Gruneisen started out as a licensed stockbroker in August 1987, a couple of months prior to the historic stock market crash that took the Dow Jones Industrial Average down -22.6% in a single day. He has published daily fact-based fundamental and technical analysis on high-ranked stocks online for two decades. Through FACTBASEDINVESTING.COM, Kenneth provides educational articles, news, market commentary, and other information regarding proven investment systems that work in good times and bad.
Comments contained in the body of this report are technical opinions only and are not necessarily those of Gruneisen Growth Corp. The material herein has been obtained from sources believed to be reliable and accurate, however, its accuracy and completeness cannot be guaranteed. Our firm, employees, and customers may effect transactions, including transactions contrary to any recommendation herein, or have positions in the securities mentioned herein or options with respect thereto. Any recommendation contained in this report may not be suitable for all investors and it is not to be deemed an offer or solicitation on our part with respect to the purchase or sale of any securities. |
|
 |
Retail, Financial, and Tech Indexes Lost Ground
Kenneth J. Gruneisen - Passed the CAN SLIM® Master's Exam
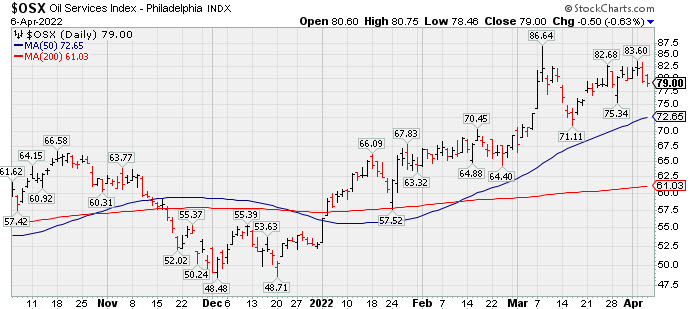
The Retail Index ($RLX -2.26%), Broker/Dealer Index ($XBD -3.14%), and Bank Index ($BKX -1.36%) suffered unanimous losses that waighed on the major averages. The Semiconductor Index ($SOX -2.32%) and Networking Index ($NWX -2.65%) both suffered large losses while the Biotech Index ($BTK +0.25%) eked out a small gain. The Oil Services Index ($OSX -0.63%) edged lower and the Integrated Oil Index ($XOI +0.26%) eked out a small gain while the Gold & Silver Index ($XAU -0.06%) finished flat. PICTURED: The Oil Services Index ($OSX -0.63%) is consolidating above its 50-day moving average (DMA) line since peaking in early March.
| Oil Services |
$OSX |
79.00 |
-0.50 |
-0.63% |
+49.84% |
| Integrated Oil |
$XOI |
1,574.32 |
+4.06 |
+0.26% |
+33.62% |
| Semiconductor |
$SOX |
3,193.96 |
-75.86 |
-2.32% |
-19.06% |
| Networking |
$NWX |
859.61 |
-23.43 |
-2.65% |
-11.48% |
| Broker/Dealer |
$XBD |
448.18 |
-14.51 |
-3.14% |
-7.94% |
| Retail |
$RLX |
3,748.59 |
-86.85 |
-2.26% |
-11.31% |
| Gold & Silver |
$XAU |
157.99 |
-0.09 |
-0.06% |
+19.29% |
| Bank |
$BKX |
119.67 |
-1.65 |
-1.36% |
-9.49% |
| Biotech |
$BTK |
5,243.23 |
+13.24 |
+0.25% |
-4.99% |
|
|
|
 |
Featured Stocks
Kenneth J. Gruneisen - Passed the CAN SLIM® Master's Exam
|
|
|
Color Codes Explained :
Y - Better candidates highlighted by our
staff of experts.
G - Previously featured
in past reports as yellow but may no longer be buyable under the
guidelines.
***Last / Change / Volume data in this table is the closing quote data***
|
|
|
THESE ARE NOT BUY RECOMMENDATIONS!
Comments contained in the body of this report are technical
opinions only. The material herein has been obtained
from sources believed to be reliable and accurate, however,
its accuracy and completeness cannot be guaranteed.
This site is not an investment advisor, hence it does
not endorse or recommend any securities or other investments.
Any recommendation contained in this report may not
be suitable for all investors and it is not to be deemed
an offer or solicitation on our part with respect to
the purchase or sale of any securities. All trademarks,
service marks and trade names appearing in this report
are the property of their respective owners, and are
likewise used for identification purposes only.
This report is a service available
only to active Paid Premium Members.
You may opt-out of receiving report notifications
at any time. Questions or comments may be submitted
by writing to Premium Membership Services 665 S.E. 10 Street, Suite 201 Deerfield Beach, FL 33441-5634 or by calling 1-800-965-8307
or 954-785-1121.
|
|
|