You are not logged in.
This means you
CAN ONLY VIEW reports that were published prior to Saturday, March 22, 2025.
You
MUST UPGRADE YOUR MEMBERSHIP if you want to see any current reports.
AFTER MARKET UPDATE - TUESDAY, APRIL 6TH, 2010
Previous After Market Report Next After Market Report >>>
|
|
|
|
DOW |
-3.56 |
10,969.99 |
-0.03% |
|
Volume |
933,231,300 |
+4% |
|
Volume |
2,123,415,700 |
+3% |
|
NASDAQ |
+7.28 |
2,436.81 |
+0.30% |
|
Advancers |
1,706 |
54% |
|
Advancers |
1,510 |
54% |
|
S&P 500 |
+2.00 |
1,189.44 |
+0.17% |
|
Decliners |
1,306 |
42% |
|
Decliners |
1,163 |
41% |
|
Russell 2000 |
+3.83 |
701.48 |
+0.55% |
|
52 Wk Highs |
479 |
|
|
52 Wk Highs |
217 |
|
|
S&P 600 |
+1.97 |
372.20 |
+0.53% |
|
52 Wk Lows |
4 |
|
|
52 Wk Lows |
10 |
|
|
 |
US Indices Mixed Amid Headlines From Greece and Australia
Adam Sarhan, Contributing Writer,
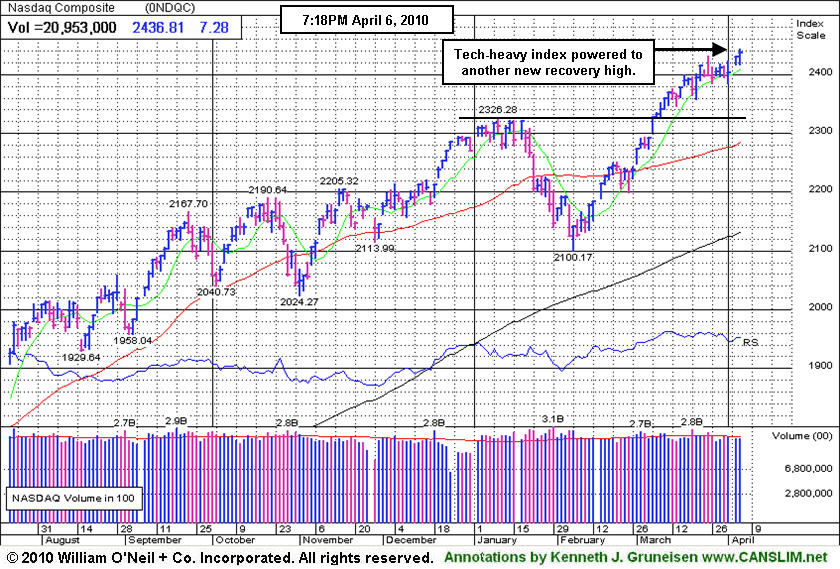
Stocks opened lower after the Australian Central Bank raised interest rates for a 5th time by a quarter point to +4.25% and Greece rejected an EU-IMF aid package. Volume totals on the NYSE and on the Nasdaq exchange were reported higher compared to Monday's totals as the major averages ended the session mixed with small net changes, and small-caps led while blue chips lagged. Breadth was slightly positive as advancers led decliners by about a 17-to-13 ratio on the NYSE, and by a 5-to-4 ratio on the Nasdaq exchange. New 52-week highs trumped new lows on both exchanges yet again. There were 58 high-ranked companies from the CANSLIM.net Leaders List that made a new 52-week high and appeared on the CANSLIM.net BreakOuts Page, down from the 79 issues that appeared on the prior session. A healthy crop of new leaders making new highs bodes well for any market rally, so the recent expansion in leadership has been a welcome post-holiday improvement.
Overnight, the Australian Central Bank raised interest rates for a 5th time since the March 2009 low to help curb its red hot economy. The euro tanked (greenback rallied) after Greece denied an EU-IMF backed plan to help it recovery from its worst financial crisis since WWII. Stateside, the Federal Reserve released the minutes of its latest meeting which showed a stronger, not weaker economic outlook. Looking forward, the next "big" news event will be Q1 earnings season which is slated to begin next week. So far, analysts believe that earnings will be positive as the economy continues to recover from the worst financial crisis since the Great Depression.
The benchmark S&P 500 Index currently has 4 distribution days while the Nasdaq Composite and Dow Jones Industrial Average have 3 since the March 1, 2010 follow-though-day (FTD). These distribution days have not been damaging, and normally it is considered healthy for the major averages to have less than 4 distribution days in a four week period. It is also a welcome sign to see the market continue to improve as investors digest the latest round of stronger than expected economic and earnings data. Remember that now that a new rally has been confirmed, the window is open to proactively be buying high quality breakouts meeting the investment system guidelines. Trade accordingly.
Don't miss your opportunity to view CANSLIM.net's Q1 2010 Webcast - Available free of charge now to all active StockNews (pay premium) members! The link to access the webcast is posted at the top of the white portion of the Premium Membership Homepage (click here). You may take advantage of the SPRING SPECIAL to reactivate an expired membership, start a new membership, or upgrade from your free membership level so you can access this informative webcast.
PICTURED: The Nasdaq Composite Index powered to another new recovery high, helped by ongoing strength in the tech sector.
|
|
|
 |
Strong Bank Index Rallies To New Recovery High
Kenneth J. Gruneisen - Passed the CAN SLIM® Master's Exam
The Bank Index ($BKX +2.43%) was a standout gainer on Tuesday and the Broker/Dealer Index ($XBD +0.69%) and Retail Index ($RLX +0.56%) also provided some important positive influence for the major averages. The Healthcare Index ($HMO +0.55%)
rose, and the Internet Index ($IIX +0.78%) and Networking Index ($NWX +0.99%) gave the tech sector a lift, but the Semiconductor Index ($SOX -0.62%) and Biotechnology Index ($BTK -0.29%) backpedaled. The Gold & Silver Index ($XAU -0.28%) also edged lower while the Integrated Oil Index ($XOI -0.02%) held its ground and the Oil Services Index ($OSX +0.43%) posted a small gain.
Charts courtesy www.stockcharts.com
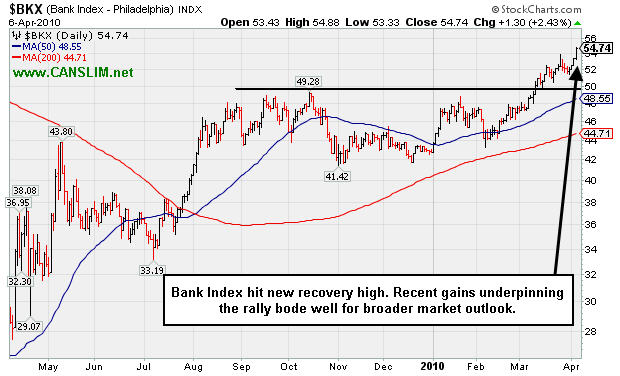
PICTURED: The Bank Index ($BKX +2.43%) hit a new recovery high. Recent gains underpinning the rally bode well for broader market outlook.
| Oil Services |
$OSX |
216.86 |
+0.92 |
+0.43% |
+11.26% |
| Healthcare |
$HMO |
1,603.19 |
+8.74 |
+0.55% |
+8.84% |
| Integrated Oil |
$XOI |
1,115.45 |
-2.34 |
+0.02% |
+4.42% |
| Semiconductor |
$SOX |
375.52 |
-2.34 |
-0.62% |
+4.34% |
| Networking |
$NWX |
262.50 |
+2.58 |
+0.99% |
+13.61% |
| Internet |
$IIX |
252.98 |
+1.96 |
+0.78% |
+8.18% |
| Broker/Dealer |
$XBD |
119.63 |
+0.82 |
+0.69% |
+3.98% |
| Retail |
$RLX |
460.45 |
+2.58 |
+0.56% |
+12.00% |
| Gold & Silver |
$XAU |
172.58 |
-0.49 |
-0.28% |
+2.57% |
| Bank |
$BKX |
54.74 |
+1.30 |
+2.43% |
+28.17% |
| Biotech |
$BTK |
1,242.51 |
-3.67 |
-0.29% |
+31.88% |
|
|
|
 |
Consolidating Above 50 DMA Line; Waning Relative Strength Raises Concerns
Kenneth J. Gruneisen - Passed the CAN SLIM® Master's Exam
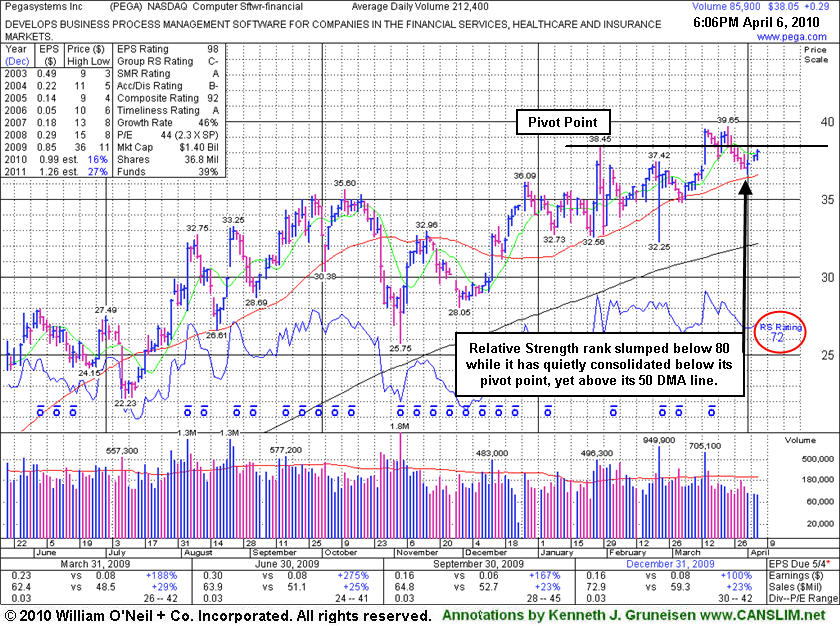
Pegasystems Inc. (PEGA +$0.29 or +0.77% to $38.05) has failed thus far to follow through with confirming gains on heavy volume since it last appeared in this FSU section on 3/15/10 with an annotated graph under the headline "Software Firm Breaks Out After Announcing Acquisition." That considerable gain above its pivot point with more than 3 times average volume met the requirement for a technical buy signal. The bullish action came after the high-ranked Computer Software - Financial firm announced plans to buy Chordiant Software Inc (CHRD), a firm with sub par fundamentals under the investment system guidelines. It is far more common for any company making an acquisition to pull back while the firm being acquired rises, however the market reacted positively to the news and lifted PEGA shares.
PEGA recently found support above its 50-day moving average (DMA) line after slumping below its pivot point and testing support near prior chart highs previously noted as "an initial support level to watch on subsequent pullbacks." Another concern is that its Relative Strength rank has slumped to 72 from an 88 back on February 8, 2010, whereas the best buy candidates under the investment system rules are stocks with RS ranks above the 80 minimum guideline. It had 80+ ranks when it was featured in the January 2010 issue of CANSLIM.net News (read here). The company has attracted an increasing number of institutional investors, as the number of top-rated funds owning its shares rose from 43 in Sep '08 to 90 in Dec '09, which is a solid reassurance concerning the investment system's I criteria. It has shown good sales revenues increases and its earnings increases were well above the +25% guideline in the 5 last quarterly comparisons versus the year ago period.
|
|
|
Color Codes Explained :
Y - Better candidates highlighted by our
staff of experts.
G - Previously featured
in past reports as yellow but may no longer be buyable under the
guidelines.
***Last / Change / Volume quote data in this table corresponds with the timestamp on the note***
Symbol/Exchange
Company Name
Industry Group |
Last |
Chg. |
Vol
% DAV |
Date Featured |
Price Featured |
Latest Pivot Point
Featured |
Status |
| Latest Max Buy Price |
ARUN
- NASDAQ
Aruba Networks Inc
COMPUTER HARDWARE - Networking & Communication Dev
|
$13.77
|
-0.11
|
828,161
52% DAV
1,590,300
|
2/19/2010
(Date
Featured) |
$12.71
(Price
Featured) |
PP = $11.94 |
G |
| MB = $12.54 |
Most Recent Note - 4/6/2010 4:43:53 PM
G - Holding its ground quietly after wedging to new 52-week highs in the past week. Support to watch is defined by prior chart highs and its 50 DMA line in the upper $11 area.
>>> The latest Featured Stock Update with an annotated graph appeared on 3/31/2010. click here.
|
|
C
A
S
I |
News |
Chart |
SEC
View all notes Alert
me of new notes
Company
Profile
|
BIDU
- NASDAQ
Baidu Inc Ads
INTERNET - Internet Information Providers
|
$619.41
|
+18.11
|
1,670,683
100% DAV
1,669,500
|
1/13/2010
(Date
Featured) |
$431.25
(Price
Featured) |
PP = $426.75 |
G |
| MB = $448.09 |
Most Recent Note - 4/6/2010 4:48:48 PM
G - Considerable gain today for a new high close. It is extended from any sound base while on track for its 10th consecutive weekly gain. Recently noted that its sideways action led to a violation of an upward trendline, which may be an early sign of waning strength after a great run up.
>>> The latest Featured Stock Update with an annotated graph appeared on 3/24/2010. click here.
|
|
C
A
S
I |
News |
Chart |
SEC
View all notes Alert
me of new notes
Company
Profile
|
BRLI
- NASDAQ
Bio Reference Labs Inc
HEALTH SERVICES - Medical Laboratories & Researc
|
$43.78
|
-0.08
|
57,516
60% DAV
95,800
|
2/12/2010
(Date
Featured) |
$39.02
(Price
Featured) |
PP = $40.97 |
G |
| MB = $43.02 |
Most Recent Note - 4/6/2010 5:34:19 PM
G - This high-ranked Medical/Dental Services firm has been quietly consolidating in a tight range near all-time highs and above its "max buy" level. Prior chart highs and its 50 DMA line coincide in the $40 area, defining important support to watch.
>>> The latest Featured Stock Update with an annotated graph appeared on 3/22/2010. click here.
|
|
C
A
S
I |
News |
Chart |
SEC
View all notes Alert
me of new notes
Company
Profile
|
CISG
- NASDAQ
Cninsure Inc Ads
INSURANCE - Insurance Brokers
|
$27.44
|
-0.36
|
220,407
96% DAV
229,200
|
3/3/2010
(Date
Featured) |
$24.38
(Price
Featured) |
PP = $23.10 |
G |
| MB = $24.26 |
Most Recent Note - 4/6/2010 5:36:51 PM
G - Closed near the session high today after a small gap down, finishing only -1.3% from its 52-week high. Recently noted as "extended from a sound base, yet no overhead supply remains to act as resistance." It has traded up as much as +14.02% since featured in yellow in the 3/03/10 mid-day report (read here).
>>> The latest Featured Stock Update with an annotated graph appeared on 3/23/2010. click here.
|
|
C
A
S
I |
News |
Chart |
SEC
View all notes Alert
me of new notes
Company
Profile
|
CRM
- NYSE
Salesforce.com Inc
INTERNET - Internet Software & Services
|
$78.83
|
+1.98
|
2,482,036
141% DAV
1,764,500
|
3/5/2010
(Date
Featured) |
$72.28
(Price
Featured) |
PP = $75.53 |
Y |
| MB = $79.31 |
Most Recent Note - 4/6/2010 5:39:15 PM
Y - Solid gain today with volume +40% above average while climbing above its pivot point to a new all-time high. The gain was below the minimum volume guideline of +50% above average volume required to trigger a proper technical buy signal.
>>> The latest Featured Stock Update with an annotated graph appeared on 3/25/2010. click here.
|
|
C
A
S
I |
News |
Chart |
SEC
View all notes Alert
me of new notes
Company
Profile
|
CTRP
- NASDAQ
Ctrip.com Intl Ltd Adr
LEISURE - Resorts & Casinos
|
$39.71
|
-0.60
|
1,581,221
71% DAV
2,213,400
|
3/25/2010
(Date
Featured) |
$40.74
(Price
Featured) |
PP = $39.40 |
Y |
| MB = $41.37 |
Most Recent Note - 4/6/2010 5:41:28 PM
Y - Holding its ground while hovering near all-time highs. On 4/01/10 it gapped up and surged to a new high, briefly trading above its "max buy" level, but while its gain above its pivot point was backed by +72% above average volume, it encountered distributional pressure and quickly reversed a large part of its early gain to ultimately close in the lower part of its intra-day range. CTRP has been stalled at all-time highs since 3/25/10 when a detailed Stock Bulletin with annotated graph and expert analysis was published (read here).
>>> The latest Featured Stock Update with an annotated graph appeared on 3/25/2010. click here.
|
|
C
A
S
I |
News |
Chart |
SEC
View all notes Alert
me of new notes
Company
Profile
|
EZPW
- NASDAQ
Ezcorp Inc Cl A
SPECIALTY RETAIL - Specialty Retail, Other
|
$21.68
|
+0.20
|
372,500
69% DAV
540,600
|
2/19/2010
(Date
Featured) |
$19.03
(Price
Featured) |
PP = $18.80 |
G |
| MB = $19.74 |
Most Recent Note - 4/6/2010 5:42:46 PM
G - Small gain today with below average volume for the 3rd highest close ever. Its 50 DMA line and its recent chart low ($19.73 on 3/16/10) define near-term support. This high-ranked Finance - Consumer/Commercial Loans firm is within close striking distance of its all-time high and has no overhead supply to act as resistance.
>>> The latest Featured Stock Update with an annotated graph appeared on 3/29/2010. click here.
|
|
C
A
S
I |
News |
Chart |
SEC
View all notes Alert
me of new notes
Company
Profile
|
GMCR
- NASDAQ
Green Mtn Coffee Roastrs
FOOD & BEVERAGE - Processed & Packaged Goods
|
$97.66
|
+0.72
|
818,598
70% DAV
1,172,200
|
2/26/2010
(Date
Featured) |
$84.39
(Price
Featured) |
PP = $88.75 |
G |
| MB = $93.19 |
Most Recent Note - 4/6/2010 5:44:02 PM
G - Gain on below average volume today for its best ever close. Support to watch on pullbacks is at prior chart highs and its 50-day moving average (DMA) line now coinciding in the $88 area.
This high-ranked leader is extended from an ideal base and trading above the "max buy" level previously cited. Its gain on 3/08/10 with above average volume was noted as it triggered a most recent technical buy signal.
>>> The latest Featured Stock Update with an annotated graph appeared on 4/5/2010. click here.
|
|
C
A
S
I |
News |
Chart |
SEC
View all notes Alert
me of new notes
Company
Profile
|
ISRG
- NASDAQ
Intuitive Surgical Inc
HEALTH SERVICES - Medical Appliances & Equipment
|
$343.30
|
-2.50
|
444,219
89% DAV
496,700
|
1/22/2010
(Date
Featured) |
$340.40
(Price
Featured) |
PP = $314.00 |
G |
| MB = $329.70 |
Most Recent Note - 4/6/2010 5:58:47 PM
G - Small loss today, slumping to a close just below its 50 DMA line. A subsequent violation of its recent chart low ($338.52 on 3/26/10) would raise more serious concerns and trigger a more worrisome technical sell signal.
>>> The latest Featured Stock Update with an annotated graph appeared on 3/16/2010. click here.
|
|
C
A
S
I |
News |
Chart |
SEC
View all notes Alert
me of new notes
Company
Profile
|
PCLN
- NASDAQ
Priceline.com Inc
INTERNET - Internet Software & Services
|
$399.55
|
-4.72
|
584,812
N/A
|
11/1/2002
(Date
Featured) |
$399.55
(Price
Featured) |
PP = $428.20 |
Y |
| MB = $449.61 |
Most Recent Note - 1/2/2011
Y - Returns to Featured Stocks list with its appearance in the January 2011 CANSLIM.net News including detailed analysis and annotated daily and weekly graphs.
>>> The latest Featured Stock Update with an annotated graph appeared on 3/30/2010. click here.
|
|
C
A
S
I |
News |
Chart |
SEC
View all notes Alert
me of new notes
Company
Profile
|
PEGA
- NASDAQ
Pegasystems Inc
COMPUTER SOFTWARE & SERVICES - Business Software & Services
|
$38.05
|
+0.29
|
86,095
41% DAV
212,400
|
2/26/2010
(Date
Featured) |
$36.00
(Price
Featured) |
PP = $38.55 |
Y |
| MB = $40.48 |
Most Recent Note - 4/6/2010 6:41:00 PM
Y - Today's third consecutive gain with below average volume continues its quiet consolidation near support at prior chart highs and its 50 DMA line which coincide in the $37 area. Its Relative Strength ranks has been slumping while it has failed to follow through with any confirming gains with above average volume since its considerable gap up gain on 3/15/10 triggered a technical buy signal.
>>> The latest Featured Stock Update with an annotated graph appeared on 4/6/2010. click here.
|
|
C
A
S
I |
News |
Chart |
SEC
View all notes Alert
me of new notes
Company
Profile
|
ROVI
- NASDAQ
Rovi Corp
COMPUTER SOFTWARE & SERVICES - Security Software & Services
|
$37.03
|
-0.04
|
735,097
54% DAV
1,361,900
|
2/25/2010
(Date
Featured) |
$33.54
(Price
Featured) |
PP = $34.87 |
G |
| MB = $36.61 |
Most Recent Note - 4/6/2010 6:42:54 PM
G - Consolidating in a tight range for the past 4 weeks within close striking distance of its all-time high. Prior chart highs and its 50 DMA line, coinciding in the $34 area, define an important support level to watch on pullbacks.
>>> The latest Featured Stock Update with an annotated graph appeared on 3/17/2010. click here.
|
|
C
A
S
I |
News |
Chart |
SEC
View all notes Alert
me of new notes
Company
Profile
|
SIRO
- NASDAQ
Sirona Dental Systems
HEALTH SERVICES - Medical Instruments & Supplies
|
$38.19
|
-0.60
|
440,753
73% DAV
606,100
|
2/16/2010
(Date
Featured) |
$36.43
(Price
Featured) |
PP = $36.15 |
G |
| MB = $37.96 |
Most Recent Note - 4/6/2010 6:44:25 PM
G - Small loss today with below average volume. Heavier volume and lack of meaningful upward price progress above prior highs has been noted recently as action indicative of distributional pressure while it steadily has edged higher. Prior chart highs and its 50 DMA line in the $35-36 area define important support to watch.
>>> The latest Featured Stock Update with an annotated graph appeared on 3/26/2010. click here.
|
|
C
A
S
I |
News |
Chart |
SEC
View all notes Alert
me of new notes
Company
Profile
|
ULTA
- NASDAQ
Ulta Salon Cosm & Frag
SPECIALTY RETAIL - Specialty Retail, Other
|
$23.19
|
+0.56
|
261,615
70% DAV
376,300
|
3/12/2010
(Date
Featured) |
$22.81
(Price
Featured) |
PP = $21.72 |
G |
| MB = $22.81 |
Most Recent Note - 4/6/2010 6:47:25 PM
G - Color code is changed to green after closing today's session above its "max buy" level and only 14 cents below its 3/12/10 highest close of the year. A detailed Stock Bulletin with annotated graph was published soon after it was featured in the 3/12/10 mid-day report.
>>> The latest Featured Stock Update with an annotated graph appeared on 4/1/2010. click here.
|
|
C
A
S
I |
News |
Chart |
SEC
View all notes Alert
me of new notes
Company
Profile
|
VPRT
- NASDAQ
Vistaprint Nv
DIVERSIFIED SERVICES - Business/Management Services
|
$58.67
|
+0.38
|
202,006
45% DAV
447,400
|
3/1/2010
(Date
Featured) |
$57.72
(Price
Featured) |
PP = $59.70 |
G |
| MB = $62.69 |
Most Recent Note - 4/6/2010 6:49:02 PM
G - Small gain today on light volume after recently holding its ground near its 50 DMA line. Distributional action pressured it near that short-term average line last week, raising concerns. Color code was changed to green. It did not trigger a technical buy signal since it was featured in the March 2010 CANSLIM.net News monthly newsletter (read here). As previously noted, "Its gain on 3/02/10 was below the volume guidelines for buyable breakouts under the investment system."
>>> The latest Featured Stock Update with an annotated graph appeared on 3/19/2010. click here.
|
|
C
A
S
I |
News |
Chart |
SEC
View all notes Alert
me of new notes
Company
Profile
|
|
|
|
THESE ARE NOT BUY RECOMMENDATIONS!
Comments contained in the body of this report are technical
opinions only. The material herein has been obtained
from sources believed to be reliable and accurate, however,
its accuracy and completeness cannot be guaranteed.
This site is not an investment advisor, hence it does
not endorse or recommend any securities or other investments.
Any recommendation contained in this report may not
be suitable for all investors and it is not to be deemed
an offer or solicitation on our part with respect to
the purchase or sale of any securities. All trademarks,
service marks and trade names appearing in this report
are the property of their respective owners, and are
likewise used for identification purposes only.
This report is a service available
only to active Paid Premium Members.
You may opt-out of receiving report notifications
at any time. Questions or comments may be submitted
by writing to Premium Membership Services 665 S.E. 10 Street, Suite 201 Deerfield Beach, FL 33441-5634 or by calling 1-800-965-8307
or 954-785-1121.
|
|
|


