You are not logged in.
This means you
CAN ONLY VIEW reports that were published prior to Monday, April 14, 2025.
You
MUST UPGRADE YOUR MEMBERSHIP if you want to see any current reports.
AFTER MARKET UPDATE - FRIDAY, APRIL 5TH, 2013
Previous After Market Report Next After Market Report >>>
|
|
|
|
DOW |
-40.86 |
14,565.25 |
-0.28% |
|
Volume |
725,547,080 |
+12% |
|
Volume |
1,555,374,490 |
+10% |
|
NASDAQ |
-21.12 |
3,203.86 |
-0.65% |
|
Advancers |
1,437 |
46% |
|
Advancers |
992 |
39% |
|
S&P 500 |
-6.70 |
1,553.28 |
-0.43% |
|
Decliners |
1,568 |
50% |
|
Decliners |
1,447 |
56% |
|
Russell 2000 |
-2.38 |
923.28 |
-0.26% |
|
52 Wk Highs |
80 |
|
|
52 Wk Highs |
38 |
|
|
S&P 600 |
-1.24 |
517.47 |
-0.24% |
|
52 Wk Lows |
37 |
|
|
52 Wk Lows |
44 |
|
|
 |
Major Averages Rebounded Encouragingly From Session Lows
Kenneth J. Gruneisen - Passed the CAN SLIM® Master's Exam
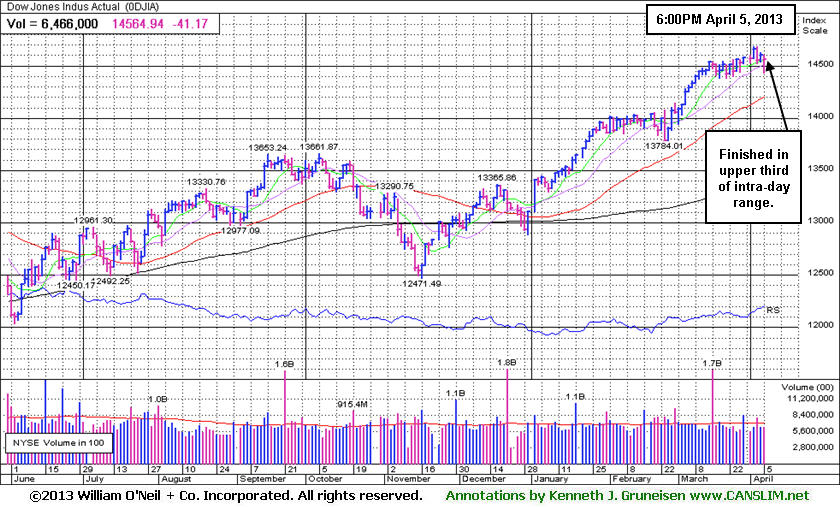
Stocks ended their worst week this year with losses on Friday after a weaker-than-expected jobs report hurt confidence in the economy and first-quarter earnings growth. For the week, the Dow Jones Industrial Average fell -0.1%, the benchmark S&P 500 Index lost -1%, and the tech-heavy Nasdaq Composite Index dropped -1.9%. Friday's volume totals on the exchanges were reported higher than the prior session totals on the NYSE and on the Nasdaq exchange, revealing more institutional selling pressure termed "distribution". New 52-week highs outnumbered new 52-week lows on the NYSE while new lows outnumbered new high on the Nasdaq exchange for the first time in many weeks. Breadth was negative as decliners led advancers on the Nasdaq by nearly 3 to 2, meanwhile the mix was closer to even on the NYSE. Only 5 high-ranked companies from the CANSLIM.net Leaders List making new 52-week highs and appearing on the CANSLIM.net BreakOuts Page, matching the prior session total of 5 stocks. That total is down considerably from 103 stocks last Friday, March 28th (read here). There were gains for only 4 of the 16 high-ranked companies currently included on the Featured Stocks Page, a more negative slant than the broader market.
The market retreated further based upon a new fear-stoking jobs number. The news boosted demand for safety and drove the 10-year Treasury yields back below 1.7% again. Weakness in Europe and the spreading chaos in China, Japan, and North Korea, added to investors' uncertainty.
The most recent Labor Department data pointed out that the economy remains far from the target levels the Fed has set for an exit, despite an unemployment rate drop to 7.6%. The move came not from a significantly improving labor market, but rather an exodus of Americans from the labor force.
American Express Co (AXP -2.14%) and Coca-Cola Co (KO -1.13%) paced losses among the largest companies. F5 Networks Inc (FFIV -19.03%) led declines among technology shares after reporting preliminary results below its forecast. Cisco Systems Inc (CSCO -2.04%) and Juniper Networks Inc (JNPR -3.15%) and other makers of communications equipment fell in sympathy. Hewlett-Packard Co (HPQ -1.48%) fell after it announced a shakeup of its board.
Recent distribution days and weak action among high-ranked stocks has resulted in a noted shift in the market's (M criteria) stance. Earlier this week the rally was noted as "under pressure", but Friday's early action had the look of a more worrisome market "correction". Members have been reminded repeatedly that any sustainable rally requires a healthy crop of companies hitting new 52-week highs, so it is always essential to see meaningful leadership (stocks hitting new 52-week highs). Leadership in the market has quickly evaporated, as noted in the first paragraph of our commentary. This raises the caution flag for investors who should be watchful for individual issues flashing sell signals.
Watch for an announcement via email concerning the next WEBCAST. The webcast will also be available via an updated link highlighted at the top of the Premium Member Homepage.
PICTURED: The Dow Jones Industrial Average finished in the upper third of its intra-day range on Friday, a somewhat encouraging sign stocks were attracting some support rather then enduring heavier selling from the institutional crowd.
|
 Kenneth J. Gruneisen started out as a licensed stockbroker in August 1987, a couple of months prior to the historic stock market crash that took the Dow Jones Industrial Average down -22.6% in a single day. He has published daily fact-based fundamental and technical analysis on high-ranked stocks online for two decades. Through FACTBASEDINVESTING.COM, Kenneth provides educational articles, news, market commentary, and other information regarding proven investment systems that work in good times and bad.
Comments contained in the body of this report are technical opinions only and are not necessarily those of Gruneisen Growth Corp. The material herein has been obtained from sources believed to be reliable and accurate, however, its accuracy and completeness cannot be guaranteed. Our firm, employees, and customers may effect transactions, including transactions contrary to any recommendation herein, or have positions in the securities mentioned herein or options with respect thereto. Any recommendation contained in this report may not be suitable for all investors and it is not to be deemed an offer or solicitation on our part with respect to the purchase or sale of any securities. |
|
 |
Tech Sector Lags and Energy Group Leads Choppy Session
Kenneth J. Gruneisen - Passed the CAN SLIM® Master's Exam
Oil Services Index ($OSX +0.91%) was a standout gainer on Friday's choppy session while most groups recovered to finish well off their lows. The Integrated Oil Index ($XOI -0.04%) ended flat. The tech sector was led lower by the Networking Index ($NWX -1.97%) and the Internet Index ($IIX -1.46%) while the Semiconductor Index ($SOX -0.52%) and Biotechnology Index ($BTK -0.46%) each suffered a smaller loss. Defensive shares also lost ground as the Healthcare Index ($HMO -0.95%) and the Gold & Silver Index ($XAU -0.30%) both finished modestly lower. The Retail Index ($RLX -0.67%) created a drag on the major averages too. There were smaller losses for the Broker/Dealer Index ($XBD -0.23%) and the Bank Index ($BKX -0.04%) ended flat.
Charts courtesy www.stockcharts.com
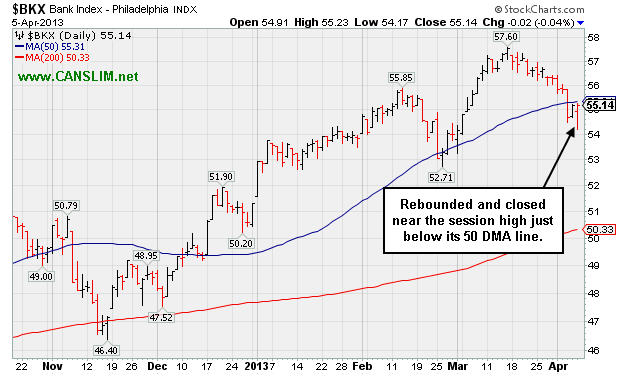
PICTURED: The Bank Index ($BKX -0.04%) rebounded and closed near the session high just below its 50-day moving average (DMA) line. A prompt rebound above that important short-term average would be an encouraging sign to watch for, meanwhile, a more cautious stance is called for while this "leading indicator" sputters.
| Oil Services |
$OSX |
238.33 |
+2.14 |
+0.91% |
+8.25% |
| Healthcare |
$HMO |
2,870.70 |
-27.64 |
-0.95% |
+14.18% |
| Integrated Oil |
$XOI |
1,330.68 |
-0.54 |
-0.04% |
+7.15% |
| Semiconductor |
$SOX |
418.93 |
-2.21 |
-0.52% |
+9.08% |
| Networking |
$NWX |
223.66 |
-4.50 |
-1.97% |
-1.28% |
| Internet |
$IIX |
352.12 |
-5.23 |
-1.46% |
+7.68% |
| Broker/Dealer |
$XBD |
108.33 |
-0.26 |
-0.23% |
+14.84% |
| Retail |
$RLX |
724.55 |
-4.92 |
-0.67% |
+10.95% |
| Gold & Silver |
$XAU |
126.13 |
-0.38 |
-0.30% |
-23.83% |
| Bank |
$BKX |
55.14 |
-0.02 |
-0.04% |
+7.53% |
| Biotech |
$BTK |
1,808.19 |
-8.39 |
-0.46% |
+16.88% |
|
|
|
 |
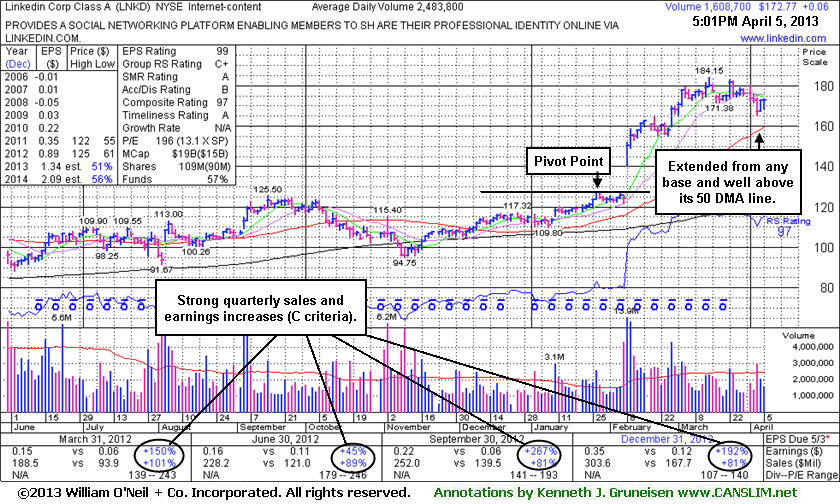
Extended From Prior Base 8-Weeks After Breakaway Gap
Kenneth J. Gruneisen - Passed the CAN SLIM® Master's Exam
Linkedin Corp (LNKD +$0.06 or +0.03% to $172.77) has been consolidating for a couple of weeks. It is extended from any base and still well above its 50-day moving average (DMA) line ($159.57 now) which defines important near term support to watch. Patient investors may be watching for a secondary buy point or new base to potentially form and be noted. Its last appearance in this FSU section was on 3/11/13 with an annotated graph under the headline, "Extended From Base Following Breakaway Gap and Additional Volume-Driven Gains", and afterward it wedged further into new all-time high territory with gains lacking great volume conviction. It has not encountered much distributional pressure and it showed mostly bullish action since. It is very extended from any sound base.
Having quickly rallied more than +20% in the first 2-3 weeks after its technical breakout, regular readers were reminded that the investment system rules suggest holding such explosive winners for a minimum of 8 weeks to allow for potentially greater gains. It has been 8 weeks since its breakout, and it may produce more climatic gains. However, investors should be especially watchful for any subsequent sell signals, especially with consideration that the broader market direction (M criteria) is always likely to impact 3 out of 4 stocks. The company's fundamentals (C and A criteria) remain strong. The high-ranked leader from the Internet - Content group's Return On Equity of 13% is still below the 17% guideline, which is a minor concern. Ownership by top-rated funds has been on the rise, increasing from 601 in Jun '12 to 848 in Mar '13, a very reassuring sign concerning the I criteria. Its current Up/Down Volume Ratio of 1.6 is an unbiased indication that its shares have been under accumulation over the past 50 days.
|
|
|
Color Codes Explained :
Y - Better candidates highlighted by our
staff of experts.
G - Previously featured
in past reports as yellow but may no longer be buyable under the
guidelines.
***Last / Change / Volume data in this table is the closing quote data***
Symbol/Exchange
Company Name
Industry Group |
PRICE |
CHANGE
(%Change) |
Day High |
Volume
(% DAV)
(% 50 day avg vol) |
52 Wk Hi
% From Hi |
Featured
Date |
Price
Featured |
Pivot Featured |
|
Max Buy |
AMBA
-
NASDAQ
Ambarella Inc
ELECTRONICS - Semiconductor - Specialized
|
$14.00
|
-0.55
-3.78% |
$14.55
|
383,874
125.00% of 50 DAV
50 DAV is 307,100
|
$16.00
-12.50%
|
3/26/2013
|
$15.31
|
PP = $14.83
|
|
MB = $15.57
|
 Most Recent Note - 4/5/2013 6:31:51 PM
Y - Slumped today with another loss backed by above average volume. Endured distributional pressure with an abrupt retreat from its 52-week high after a "negative reversal" on 4/01/13. Disciplined investors avoid chasing extended stocks and always limit losses by selling if any stock falls more than -7% from their purchase price.
>>> The latest Featured Stock Update with an annotated graph appeared on 3/26/2013. Click here.
View all notes |
Alert me of new notes |
CANSLIM.net Company Profile |
SEC |
Zacks Reports |
StockTalk |
News |
Chart |
Request a new note
C
A N
S L
I M


|
CELG
-
NASDAQ
Celgene Corp
DRUGS - Drug Manufacturers - Major
|
$116.43
|
+0.48
0.41% |
$117.80
|
3,557,779
109.17% of 50 DAV
50 DAV is 3,258,900
|
$118.78
-1.98%
|
3/27/2013
|
$113.24
|
PP = $115.54
|
|
MB = $121.32
|
Most Recent Note - 4/5/2013 6:32:33 PM
Y - It recently wedged to new highs from an advanced "3-weeks tight" base with only average volume behind its gains above the new pivot point cited based on its 3/14/13 high plus 10 cents.
>>> The latest Featured Stock Update with an annotated graph appeared on 3/28/2013. Click here.
View all notes |
Alert me of new notes |
CANSLIM.net Company Profile |
SEC |
Zacks Reports |
StockTalk |
News |
Chart |
Request a new note
C
A N
S L
I M
|
CFNL
-
NASDAQ
Cardinal Financial Corp
BANKING - Regional - Southeast Banks
|
$17.17
|
-0.27
-1.55% |
$17.20
|
156,252
76.29% of 50 DAV
50 DAV is 204,800
|
$18.40
-6.68%
|
3/22/2013
|
$17.99
|
PP = $18.29
|
|
MB = $19.20
|
Most Recent Note - 4/5/2013 6:33:51 PM
Y - Retreated near its 50 DMA line, enduring recent distributional pressure instead of rallying from the previously noted advanced "3-weeks tight" base. Previously noted - "Gains above the pivot point must have at least the bare minimum +40% above average volume, preferably more, to trigger a proper new (or add-on) technical buy signal."
>>> The latest Featured Stock Update with an annotated graph appeared on 3/18/2013. Click here.
View all notes |
Alert me of new notes |
CANSLIM.net Company Profile |
SEC |
Zacks Reports |
StockTalk |
News |
Chart |
Request a new note
C
A N
S L
I M
|
CMCSA
-
NASDAQ
Comcast Corp Cl A
MEDIA - CATV Systems
|
$41.56
|
-0.56
-1.33% |
$41.64
|
13,974,767
97.97% of 50 DAV
50 DAV is 14,264,400
|
$42.61
-2.46%
|
12/3/2012
|
$37.08
|
PP = $38.06
|
|
MB = $39.96
|
Most Recent Note - 4/2/2013 4:36:31 PM
G - Finished near the session high with a gain on average volume for a new 52-week high. Found recent support and rallied from its 50 DMA line. Relative Strength Rating is at 79, just below the 80+ guideline for buy candidates. Fundamental concerns also remain since it reported earnings +11% on +6% sales revenues for the Dec '12 quarter, below the +25% minimum guideline (C criteria).
>>> The latest Featured Stock Update with an annotated graph appeared on 3/19/2013. Click here.
View all notes |
Alert me of new notes |
CANSLIM.net Company Profile |
SEC |
Zacks Reports |
StockTalk |
News |
Chart |
Request a new note
C
A N
S L
I M
|
CVLT
-
NASDAQ
Commvault Systems Inc
COMPUTER SOFTWARE and SERVICES - Business Software and Services
|
$71.70
|
-3.63
-4.82% |
$72.45
|
1,723,192
227.78% of 50 DAV
50 DAV is 756,500
|
$86.89
-17.48%
|
3/14/2013
|
$84.71
|
PP = $79.63
|
|
MB = $83.61
|
Most Recent Note - 4/5/2013 6:29:53 PM
Gapped down and slumped further below its 50 DMA line with a big loss on heavy volume today raising more serious concerns before rebounding to close in the upper third of its intra-day range. It will be dropped from the Featured Stocks list tonight due to technical deterioration.
>>> The latest Featured Stock Update with an annotated graph appeared on 3/14/2013. Click here.
View all notes |
Alert me of new notes |
CANSLIM.net Company Profile |
SEC |
Zacks Reports |
StockTalk |
News |
Chart |
Request a new note
C
A N
S L
I M
|
Symbol/Exchange
Company Name
Industry Group |
PRICE |
CHANGE
(%Change) |
Day High |
Volume
(% DAV)
(% 50 day avg vol) |
52 Wk Hi
% From Hi |
Featured
Date |
Price
Featured |
Pivot Featured |
|
Max Buy |
EVER
-
NYSE
Everbank Financial Corp
BANKING
|
$15.07
|
+0.09
0.60% |
$15.12
|
1,063,156
114.23% of 50 DAV
50 DAV is 930,700
|
$17.29
-12.84%
|
3/4/2013
|
$15.38
|
PP = $15.83
|
|
MB = $16.62
|
Most Recent Note - 4/2/2013 4:40:04 PM
G - Slumped to a close just below its 50 DMA line ($15.16 now) today. That important short-term average has acted as support since damaging losses violated prior highs in the $16 area raising concerns while completely negating its prior technical breakout.
>>> The latest Featured Stock Update with an annotated graph appeared on 4/2/2013. Click here.
View all notes |
Alert me of new notes |
CANSLIM.net Company Profile |
SEC |
Zacks Reports |
StockTalk |
News |
Chart |
Request a new note
C
A N
S L
I M
|
FLT
-
NYSE
Fleetcor Technologies
DIVERSIFIED SERVICES - Business/Management Services
|
$75.25
|
-2.01
-2.60% |
$76.07
|
1,509,731
189.09% of 50 DAV
50 DAV is 798,400
|
$78.37
-3.98%
|
3/21/2013
|
$71.14
|
PP = $73.00
|
|
MB = $76.65
|
Most Recent Note - 4/5/2013 12:09:36 PM
Y - Color code is changed to yellow while retreating below its "max buy" level, but recent distributional pressure is raising concerns for the market and all stocks. Prior high in the $72 area defines near-term support to watch on pullbacks.
>>> The latest Featured Stock Update with an annotated graph appeared on 3/21/2013. Click here.
View all notes |
Alert me of new notes |
CANSLIM.net Company Profile |
SEC |
Zacks Reports |
StockTalk |
News |
Chart |
Request a new note
C
A N
S L
I M
|
LNKD
-
NYSE
Linkedin Corp Class A
INTERNET - Internet Information Providers
|
$172.77
|
+0.06
0.03% |
$173.68
|
1,611,960
64.90% of 50 DAV
50 DAV is 2,483,800
|
$184.15
-6.18%
|
2/8/2013
|
$147.04
|
PP = $127.55
|
|
MB = $133.93
|
Most Recent Note - 4/5/2013 6:35:46 PM
G - Consolidating for just a couple of weeks, extended from any sound base pattern and well above its 50 DMA line which defines important near term support to watch. See the latest FSU analysis for more details and a new annotated graph.
>>> The latest Featured Stock Update with an annotated graph appeared on 4/5/2013. Click here.
View all notes |
Alert me of new notes |
CANSLIM.net Company Profile |
SEC |
Zacks Reports |
StockTalk |
News |
Chart |
Request a new note
C
A N
S L
I M
|
MIDD
-
NASDAQ
Middleby Corp
MANUFACTURING - Diversified Machinery
|
$147.26
|
-1.19
-0.80% |
$148.59
|
66,207
67.35% of 50 DAV
50 DAV is 98,300
|
$154.74
-4.83%
|
10/8/2012
|
$118.46
|
PP = $122.67
|
|
MB = $128.80
|
Most Recent Note - 4/1/2013 6:13:43 PM
G - Recently staying in tight trading range near all-time highs, stubbornly holding its ground above its 50 DMA line. Fundamental concerns were recently noted.
>>> The latest Featured Stock Update with an annotated graph appeared on 3/25/2013. Click here.
View all notes |
Alert me of new notes |
CANSLIM.net Company Profile |
SEC |
Zacks Reports |
StockTalk |
News |
Chart |
Request a new note
C
A N
S L
I M
|
MNTX
-
NASDAQ
Manitex International
MANUFACTURING - Diversified Machinery
|
$10.82
|
-0.09
-0.82% |
$10.90
|
107,376
53.00% of 50 DAV
50 DAV is 202,600
|
$13.14
-17.66%
|
3/20/2013
|
$11.29
|
PP = $12.05
|
|
MB = $12.65
|
Most Recent Note - 4/3/2013 11:10:42 AM
Y - Testing near its 50 DMA line today with another damaging loss on heavy volume following a weak finish on the prior session noted as - "Indicating more worrisome distributional pressure." Only a prompt show of support near its 50 DMA line would be encouraging. Disciplined investors avoid chasing extended stocks and always limit losses by selling if any stock falls more than -7% from their purchase price.
>>> The latest Featured Stock Update with an annotated graph appeared on 3/20/2013. Click here.
View all notes |
Alert me of new notes |
CANSLIM.net Company Profile |
SEC |
Zacks Reports |
StockTalk |
News |
Chart |
Request a new note
C
A N
S L
I M
|
Symbol/Exchange
Company Name
Industry Group |
PRICE |
CHANGE
(%Change) |
Day High |
Volume
(% DAV)
(% 50 day avg vol) |
52 Wk Hi
% From Hi |
Featured
Date |
Price
Featured |
Pivot Featured |
|
Max Buy |
MRLN
-
NASDAQ
Marlin Business Services
DIVERSIFIED SERVICES - Rental and Leasing Services
|
$22.52
|
-0.34
-1.49% |
$23.10
|
39,080
159.51% of 50 DAV
50 DAV is 24,500
|
$23.98
-6.09%
|
3/15/2013
|
$22.29
|
PP = $23.18
|
|
MB = $24.34
|
Most Recent Note - 4/4/2013 12:54:49 PM
Y - Volume was above average on the prior session as it tallied a small gain against a mostly negative market backdrop. Stubbornly holding its ground within close striking distance of its 52-week high. Previously noted - "Subsequent volume-driven gains above the pivot point could help clinch a more convincing technical buy signal."
>>> The latest Featured Stock Update with an annotated graph appeared on 3/15/2013. Click here.
View all notes |
Alert me of new notes |
CANSLIM.net Company Profile |
SEC |
Zacks Reports |
StockTalk |
News |
Chart |
Request a new note
C
A N
S L
I M
|
MWIV
-
NASDAQ
M W I Veterinary Supply
HEALTH SERVICES - Medical Instruments and; Supplies
|
$131.34
|
-0.50
-0.38% |
$132.73
|
57,925
101.44% of 50 DAV
50 DAV is 57,100
|
$137.18
-4.26%
|
3/4/2013
|
$130.90
|
PP = $129.45
|
|
MB = $135.92
|
Most Recent Note - 4/4/2013 6:34:36 PM
Y - Consolidating above its 50 DMA line and above its pivot point with volume totals cooling in recent weeks. See the latest FSU analysis for more details an a new annotated graph.
>>> The latest Featured Stock Update with an annotated graph appeared on 4/4/2013. Click here.
View all notes |
Alert me of new notes |
CANSLIM.net Company Profile |
SEC |
Zacks Reports |
StockTalk |
News |
Chart |
Request a new note
C
A N
S L
I M
|
N
-
NYSE
Netsuite Inc
DIVERSIFIED SERVICES - Business/Management Services
|
$77.38
|
-0.62
-0.79% |
$77.60
|
292,842
76.26% of 50 DAV
50 DAV is 384,000
|
$80.33
-3.67%
|
12/12/2012
|
$64.75
|
PP = $67.12
|
|
MB = $70.48
|
Most Recent Note - 4/1/2013 7:26:50 PM
G - Perched at 52-week and all-time highs after 7 consecutive weekly gains, extended from its prior base. See the latest FSU analysis for more details and a new annotated graph.
>>> The latest Featured Stock Update with an annotated graph appeared on 4/1/2013. Click here.
View all notes |
Alert me of new notes |
CANSLIM.net Company Profile |
SEC |
Zacks Reports |
StockTalk |
News |
Chart |
Request a new note
C
A N
S L
I M
|
NSR
-
NYSE
Neustar Inc
TELECOMMUNICATIONS - Diversified Communication Serv
|
$43.01
|
-0.20
-0.46% |
$43.53
|
312,539
66.75% of 50 DAV
50 DAV is 468,200
|
$47.24
-8.95%
|
3/8/2013
|
$44.99
|
PP = $47.34
|
|
MB = $49.71
|
Most Recent Note - 4/4/2013 12:57:48 PM
G - Color code is changed to green while slumping below its 50 DMA line and undercutting its prior lows, weakness raising concerns and triggering technical sell signals. Its Relative Strength rating has slumped to 63, well below the 80+ minimum guideline for buy candidates.
>>> The latest Featured Stock Update with an annotated graph appeared on 3/27/2013. Click here.
View all notes |
Alert me of new notes |
CANSLIM.net Company Profile |
SEC |
Zacks Reports |
StockTalk |
News |
Chart |
Request a new note
C
A N
S L
I M
|
RRTS
-
NYSE
Roadrunner Trans Systems
TRANSPORTATION - Air Delivery and Freight Service
|
$23.02
|
+0.03
0.13% |
$23.06
|
434,412
252.86% of 50 DAV
50 DAV is 171,800
|
$23.71
-2.91%
|
4/3/2013
|
$22.77
|
PP = $23.75
|
|
MB = $24.94
|
Most Recent Note - 4/5/2013 12:24:26 PM
Y - Holding its ground stubbornly and perched within close striking distance of its 52-week high. Disciplined investors will watch for volume-driven gains above its pivot point which are still needed to trigger a new technical buy signal. Fundamentals remain strong enough to still satisfy the C and A criteria, however decelerating sales revenues and earnings increases in sequential quarterly comparisons through the Dec '12 quarter is a concern. Completed a new Public Offering on 12/06/12 and, technically, it broke out above previously stubborn resistance in $19 area with volume-driven gains in January. See the latest FSU analysis for more details and a new annotated graph.
>>> The latest Featured Stock Update with an annotated graph appeared on 4/3/2013. Click here.
View all notes |
Alert me of new notes |
CANSLIM.net Company Profile |
SEC |
Zacks Reports |
StockTalk |
News |
Chart |
Request a new note
C
A N
S L
I M
|
Symbol/Exchange
Company Name
Industry Group |
PRICE |
CHANGE
(%Change) |
Day High |
Volume
(% DAV)
(% 50 day avg vol) |
52 Wk Hi
% From Hi |
Featured
Date |
Price
Featured |
Pivot Featured |
|
Max Buy |
VRX
-
NYSE
Valeant Pharmaceuticals
DRUGS - Drug Manufacturers - Other
|
$71.79
|
-0.82
-1.13% |
$71.88
|
1,120,581
79.45% of 50 DAV
50 DAV is 1,410,500
|
$76.56
-6.23%
|
12/20/2012
|
$60.24
|
PP = $61.21
|
|
MB = $64.27
|
Most Recent Note - 4/4/2013 1:16:01 PM
G - Gapped down today and traded near its 50 DMA line, then managed a positive reversal. That important short-term average defines near-term support to watch where a violation may raise concerns and trigger a technical sell signal. On the prior session it pulled back on heavy volume after agreeing to an increased offer price of $24.00 cash for it to acquire Obagi Medical Products.
>>> The latest Featured Stock Update with an annotated graph appeared on 3/12/2013. Click here.
View all notes |
Alert me of new notes |
CANSLIM.net Company Profile |
SEC |
Zacks Reports |
StockTalk |
News |
Chart |
Request a new note
C
A N
S L
I M
|
|
|
|
THESE ARE NOT BUY RECOMMENDATIONS!
Comments contained in the body of this report are technical
opinions only. The material herein has been obtained
from sources believed to be reliable and accurate, however,
its accuracy and completeness cannot be guaranteed.
This site is not an investment advisor, hence it does
not endorse or recommend any securities or other investments.
Any recommendation contained in this report may not
be suitable for all investors and it is not to be deemed
an offer or solicitation on our part with respect to
the purchase or sale of any securities. All trademarks,
service marks and trade names appearing in this report
are the property of their respective owners, and are
likewise used for identification purposes only.
This report is a service available
only to active Paid Premium Members.
You may opt-out of receiving report notifications
at any time. Questions or comments may be submitted
by writing to Premium Membership Services 665 S.E. 10 Street, Suite 201 Deerfield Beach, FL 33441-5634 or by calling 1-800-965-8307
or 954-785-1121.
|
|
|

