You are not logged in.
This means you
CAN ONLY VIEW reports that were published prior to Monday, April 14, 2025.
You
MUST UPGRADE YOUR MEMBERSHIP if you want to see any current reports.
AFTER MARKET UPDATE - FRIDAY, APRIL 4TH, 2014
Previous After Market Report Next After Market Report >>>
|
|
|
|
DOW |
-159.84 |
16,412.71 |
-0.96% |
|
Volume |
764,446,420 |
+18% |
|
Volume |
2,421,218,460 |
+26% |
|
NASDAQ |
-110.01 |
4,127.73 |
-2.60% |
|
Advancers |
1,051 |
33% |
|
Advancers |
477 |
15% |
|
S&P 500 |
-23.68 |
1,865.09 |
-1.25% |
|
Decliners |
2,007 |
64% |
|
Decliners |
2,585 |
83% |
|
Russell 2000 |
-27.74 |
1,153.38 |
-2.35% |
|
52 Wk Highs |
179 |
|
|
52 Wk Highs |
85 |
|
|
S&P 600 |
-14.46 |
663.44 |
-2.13% |
|
52 Wk Lows |
11 |
|
|
52 Wk Lows |
56 |
|
|
 |
Indices Ended Near Lows With Big Losses After Negative Reversal
Kenneth J. Gruneisen - Passed the CAN SLIM® Master's Exam
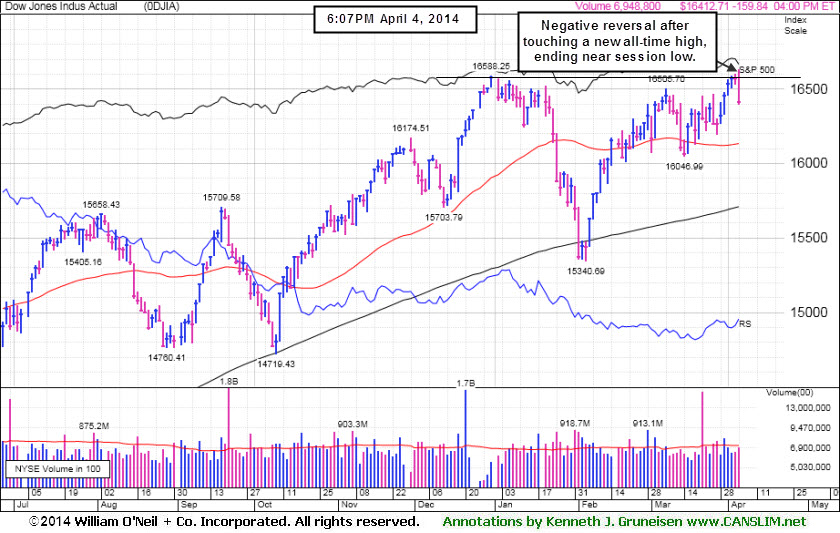
Despite Friday's pullback, stocks were mostly higher for the week. The Dow was up +0.6%, the S&P 500 gained +0.4% while the NASDAQ slipped -0.7%. After a brief move above its all-time high, the Dow fell 160 points to 1,6412. The S&P 500 finished 24 points lower at 1,865. The NASDAQ experienced its biggest decline in almost two years, dropping 110 points to 4,127. Behind Friday's losses the volume totals were reported higher on the NYSE and on the Nasdaq exchange, a clear sign of institutional selling termed "distribution". Decliners led advancers by a 2-1 margin on the NYSE and 5-1 on the Nasdaq exchange. Leadership contracted as there were 36 high-ranked companies from the CANSLIM.net Leaders List that made new 52-week highs and appeared on the CANSLIM.net BreakOuts Page, down from the total of 40 stocks on the prior session. The list of stocks hitting new 52-week highs contracted but still easily outnumbered new 52-week lows on the NYSE and on the Nasdaq exchange. There were unanimous losses for the 9 high-ranked companies currently included on the Featured Stocks Page, a list that has grown shorter as numerous leaders have broken down in recent weeks. The Market (M criteria) uptrend came under pressure. Investors are reminded to limit losses by selling any stock that falls more than -7% from their purchase price and to only make new buying efforts in issues meeting all key criteria while also trading within the proper technical guidelines.
The major averages closed firmly in negative territory attributed to a profit-taking in technology, biotech and consumer discretionary stocks. Microsoft (MSFT -2.8%), Biogen Idec (BIIB -4.5%), and Amazon.com (AMZN -3.2%) suffered big losses The defensive utilities sector was the lone group to finish higher on the session. Exelon (EXC +2%) and PG&E (PGC +1.5%) rose. Less volatile large-cap dividend paying stocks were notable gainers as Coca-Cola (KO +0.4%) and Johnson & Johnson (JNJ +0.2%) edged higher.
Investors also spent the day weighing the jobs report after non-farm payrolls rose 192,000 in March, modestly below a projected 200,000 increase. The unemployment rate remained at 6.7% last month versus a projected decline to 6.6%.
Treasuries rallied with the 10-year note rising 19/32 to 2.73%.
The CANSLIM.net Featured Stocks Page shows the most action-worthy candidates and their latest notes and a Headline Link directs members to the latest detailed analysis with data-packed graphs annotated by a Certified expert along with links to additional resources. The Premium Member Homepage includes "dynamic archives" to all prior pay reports published. Watch for an announcement via email concerning the next WEBCAST.
PICTURED: The Dow Jones Industrial Average touched a new all-time high on Friday but ended near the session low with a large loss after a negative reversal.
|
 Kenneth J. Gruneisen started out as a licensed stockbroker in August 1987, a couple of months prior to the historic stock market crash that took the Dow Jones Industrial Average down -22.6% in a single day. He has published daily fact-based fundamental and technical analysis on high-ranked stocks online for two decades. Through FACTBASEDINVESTING.COM, Kenneth provides educational articles, news, market commentary, and other information regarding proven investment systems that work in good times and bad.
Comments contained in the body of this report are technical opinions only and are not necessarily those of Gruneisen Growth Corp. The material herein has been obtained from sources believed to be reliable and accurate, however, its accuracy and completeness cannot be guaranteed. Our firm, employees, and customers may effect transactions, including transactions contrary to any recommendation herein, or have positions in the securities mentioned herein or options with respect thereto. Any recommendation contained in this report may not be suitable for all investors and it is not to be deemed an offer or solicitation on our part with respect to the purchase or sale of any securities. |
|
 |
Weak Finish for Financial, Retail, and Tech Groups
Kenneth J. Gruneisen - Passed the CAN SLIM® Master's Exam
Financial shares had a negative influence on the major average Friday as the Broker/Dealer Index ($XBD -3.61%) outpaced the Bank Index ($BKX -1.38%) to the downside. The Retail Index ($RLX -2.02%) also created a drag. The tech sector saw unanimous large losses from the Biotechnology Index ($BTK -3.23%), Semiconductor Index ($SOX -2.81%), and the Networking Index ($NWX -2.58%). The Integrated Oil Index ($XOI -0.30%) and Oil Services Index ($OSX -0.01%) did a fair job of holding their ground and the Gold & Silver Index ($XAU +0.66%) eked out a modest gain.
Charts courtesy www.stockcharts.com
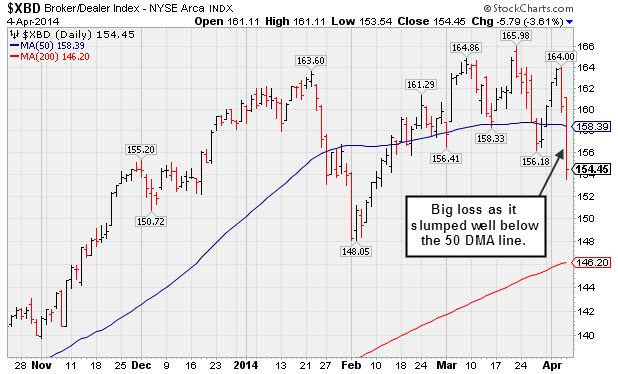
PICTURED: The Broker/Dealer Index ($XBD -3.61%) suffered a big loss and slumped well below its 50-day moving average (DMA) line. Weak action in financial stocks does not bode well for the broader market outlook because the financial groups are usually reliable leading indicators. The major averages have been prone to large downdrafts in the past when financial groups were weak. Further deterioration in financial stocks would raise a caution flag and serve as a reminder for investors to reduce market exposure.
| Oil Services |
$OSX |
291.12 |
-0.03 |
-0.01% |
+3.59% |
| Integrated Oil |
$XOI |
1,546.21 |
-4.63 |
-0.30% |
+2.87% |
| Semiconductor |
$SOX |
579.19 |
-16.74 |
-2.81% |
+8.25% |
| Networking |
$NWX |
337.63 |
-8.95 |
-2.58% |
+4.22% |
| Broker/Dealer |
$XBD |
154.45 |
-5.79 |
-3.61% |
-3.81% |
| Retail |
$RLX |
882.68 |
-18.22 |
-2.02% |
-6.08% |
| Gold & Silver |
$XAU |
93.30 |
+0.61 |
+0.66% |
+10.87% |
| Bank |
$BKX |
71.69 |
-1.00 |
-1.38% |
+3.51% |
| Biotech |
$BTK |
2,499.57 |
-83.32 |
-3.23% |
+7.26% |
|
|
|
 |
Facebook Unfriended After Technical Weakness (See More Comments)
Kenneth J. Gruneisen - Passed the CAN SLIM® Master's Exam
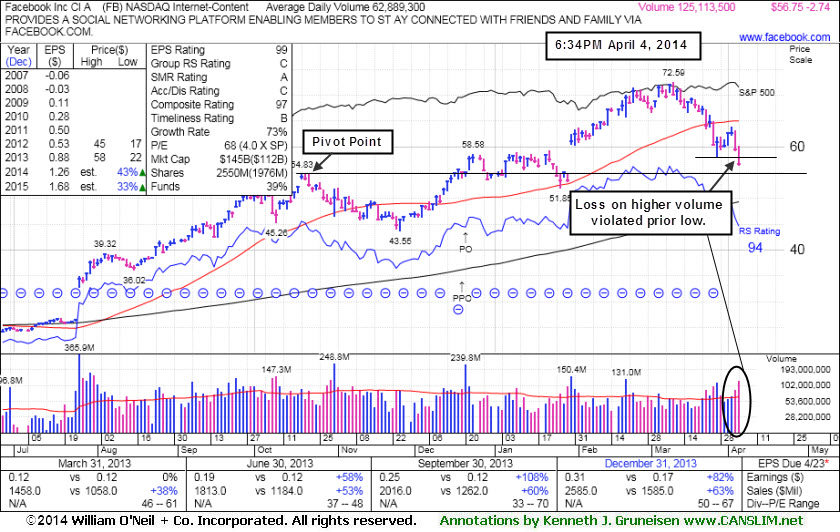
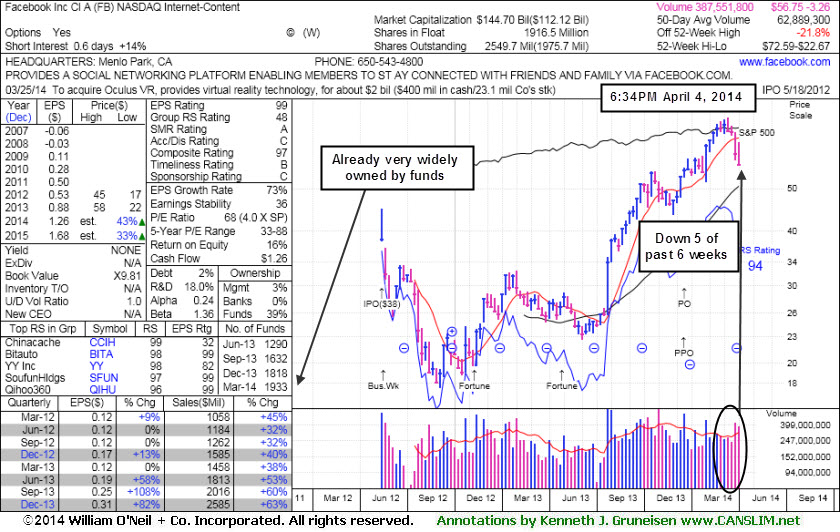
Facebook Inc (FB -$2.74 or -4.61% to $56.75) triggering a more worrisome technical sell signal today while violating the recent low ($57.98 on 3/27/14) and slumping below prior highs in the $58 area defining important near-term support. The annotated weekly graph shows it down in 5 of the past 6 weeks and with above average volume behind the two latest weekly losses. It has slumped -21.8% off its high and it will be dropped from the Featured Stocks list tonight due to weakness. Remember that any stock that is sold can always be bought back again later if strength returns.
Facebook was last shown in this FSU section on 3/28/14 with annotated graphs under the headline, "50-Day Moving Average Violation Triggered Technical Sell Signal", after damaging losses raised concerns. Members were reminded - "Only a prompt rebound above that important short term average would help its outlook improve. It traded up as much as +41.2% since shown in the 12/12/13 mid-day report (read here) first highlighted in yellow at $51.40 with a pivot point cited based on its 10/18/13 high plus 10 cents."
Its fundamentals remain strong as the high-ranked Internet - Content group leader reported earnings +82% on +63% sales revenues for the Dec '13 quarter, its 3rd consecutive quarterly comparison with earnings increasing well above the +25% minimum (C criteria). The number of top-rated funds owning its shares rose from 1,116 in Dec '12 to 1,933 in Dec '13, a reassuring sign concerning the I criteria. However, members were previously warned - "Keep in mind that its large supply of 2.54 billion shares in the public float makes it an unlikely sprinter, especially as it is already well known by the institutional crowd and the general public."
|
|
|
Color Codes Explained :
Y - Better candidates highlighted by our
staff of experts.
G - Previously featured
in past reports as yellow but may no longer be buyable under the
guidelines.
***Last / Change / Volume data in this table is the closing quote data***
Symbol/Exchange
Company Name
Industry Group |
PRICE |
CHANGE
(%Change) |
Day High |
Volume
(% DAV)
(% 50 day avg vol) |
52 Wk Hi
% From Hi |
Featured
Date |
Price
Featured |
Pivot Featured |
|
Max Buy |
EQM
-
NYSE
E Q T Midstream Partners
ENERGY - Oil and Gas Pipelines
|
$71.99
|
-0.66
-0.91% |
$73.11
|
97,985
85.20% of 50 DAV
50 DAV is 115,000
|
$73.43
-1.96%
|
12/12/2013
|
$53.17
|
PP = $56.51
|
|
MB = $59.34
|
Most Recent Note - 4/2/2014 12:48:26 PM
G - Hitting yet another new high with today's 4th consecutive gain. Held its ground since reporting earnings -2% on +22% sales revenues for the Dec '13 quarter, below the +25% minimum earnings guideline (C criteria), raising fundamental concerns. Its 50 DMA line defines near-term support where a violation may trigger a technical sell signal.
>>> FEATURED STOCK ARTICLE : Hit New Highs But Fundamental Concerns Remain - 3/21/2014
View all notes |
Set NEW NOTE alert |
CANSLIM.net Company Profile |
SEC
News |
Chart |
Request a new note
C
A N
S L
I M


|
FB
-
NASDAQ
Facebook Inc Cl A
INTERNET
|
$56.75
|
-2.74
-4.61% |
$60.20
|
125,162,237
199.02% of 50 DAV
50 DAV is 62,889,000
|
$72.59
-21.82%
|
12/12/2013
|
$51.40
|
PP = $54.93
|
|
MB = $57.68
|
 Most Recent Note - 4/4/2014 12:40:49 PM
Triggering a more worrisome technical sell signal today while violating the recent low ($57.98 on 3/27/14) and slumping below prior highs in the $58 area defining important near-term support. It has slumped -21.9% off its high and will be dropped from the Featured Stocks list tonight due to weakness.
>>> FEATURED STOCK ARTICLE : Facebook Unfriended After Technical Weakness (See More Comments) - 4/4/2014
View all notes |
Set NEW NOTE alert |
CANSLIM.net Company Profile |
SEC
News |
Chart |
Request a new note
C
A N
S L
I M
|
FLT
-
NYSE
Fleetcor Technologies
DIVERSIFIED SERVICES - Business/Management Services
|
$113.02
|
-1.81
-1.58% |
$116.49
|
618,518
58.60% of 50 DAV
50 DAV is 1,055,500
|
$132.22
-14.52%
|
3/5/2014
|
$125.40
|
PP = $124.06
|
|
MB = $130.26
|
Most Recent Note - 4/2/2014 1:24:23 PM
G - Consolidating near its 50 DMA line today after recently slumping back into its prior base. Relative Strength rating has slumped to 77, below the 80+ minimum guideline for buy candidates.
>>> FEATURED STOCK ARTICLE : Negated Recent Breakout and Testing Support at 50-Day Average - 3/24/2014
View all notes |
Set NEW NOTE alert |
CANSLIM.net Company Profile |
SEC
News |
Chart |
Request a new note
C
A N
S L
I M
|
GNRC
-
NYSE
Generac Hldgs Inc
Electrical-Power/Equipmt
|
$57.58
|
-1.87
-3.15% |
$59.84
|
694,203
79.70% of 50 DAV
50 DAV is 871,000
|
$62.50
-7.87%
|
2/14/2014
|
$56.50
|
PP = $57.39
|
|
MB = $60.26
|
Most Recent Note - 4/4/2014 7:12:57 PM
Y - Sputtering above prior highs in the $57 area again with today's loss. More damaging losses below its recent low ($56.38 on 3/27/14) would raise greater concerns.
>>> FEATURED STOCK ARTICLE : Perched Near Highs With Mostly Quiet Volume Totals - 3/31/2014
View all notes |
Set NEW NOTE alert |
CANSLIM.net Company Profile |
SEC
News |
Chart |
Request a new note
C
A N
S L
I M
|
ICON
-
NASDAQ
Iconix Brand Group Inc
CONSUMER NON-DURABLES - Textile - Apparel Footwear
|
$38.90
|
-1.06
-2.65% |
$40.49
|
567,280
91.20% of 50 DAV
50 DAV is 622,000
|
$42.47
-8.40%
|
3/7/2014
|
$41.46
|
PP = $40.88
|
|
MB = $42.92
|
Most Recent Note - 4/4/2014 7:16:06 PM
G - Color code is changed to green after a loss on near average volume violated its 50 DMA line and prior low. The deterioration raised greater concerns and triggered a technical sell signal. Only a prompt rebound above the 50 DMA line would help its outlook.
>>> FEATURED STOCK ARTICLE : Falling Back Under Prior Highs Raises Concerns - 3/25/2014
View all notes |
Set NEW NOTE alert |
CANSLIM.net Company Profile |
SEC
News |
Chart |
Request a new note
C
A N
S L
I M
|
Symbol/Exchange
Company Name
Industry Group |
PRICE |
CHANGE
(%Change) |
Day High |
Volume
(% DAV)
(% 50 day avg vol) |
52 Wk Hi
% From Hi |
Featured
Date |
Price
Featured |
Pivot Featured |
|
Max Buy |
KORS
-
NYSE
Michael Kors Hldgs Ltd
RETAIL - Apparel Stores
|
$89.54
|
-3.10
-3.35% |
$93.52
|
3,711,331
119.41% of 50 DAV
50 DAV is 3,108,000
|
$101.04
-11.38%
|
3/12/2014
|
$98.03
|
PP = $101.14
|
|
MB = $106.20
|
Most Recent Note - 4/4/2014 7:11:14 PM
G - Sank further below its 50 DMA line with higher volume today and undercut the recent low ($89.43 on 3/27/14). The deterioration raised greater concerns and triggered a more worrisome technical sell signal.
>>> FEATURED STOCK ARTICLE : Fell Below 50-Day Average Line With 6th Consecutive Loss - 3/27/2014
View all notes |
Set NEW NOTE alert |
CANSLIM.net Company Profile |
SEC
News |
Chart |
Request a new note
C
A N
S L
I M
|
PSIX
-
NASDAQ
Power Solutions Intl Inc
Machinery-Gen Industrial
|
$74.68
|
-2.85
-3.68% |
$79.70
|
102,976
149.24% of 50 DAV
50 DAV is 69,000
|
$87.40
-14.55%
|
2/28/2014
|
$74.65
|
PP = $76.93
|
|
MB = $80.78
|
Most Recent Note - 4/4/2014 12:44:13 PM
Y - Retreating below its pivot point today and slumping toward support at its 50 DMA line. Subsequent violations of the 50 DMA line (now $72.28) or recent low ($68.80 on 3/27/14) would raise more serious concerns and trigger technical sell signals.
>>> FEATURED STOCK ARTICLE : Found Prompt Support Near 50-Day Average After Dip Back Into Prior Base - 4/1/2014
View all notes |
Set NEW NOTE alert |
CANSLIM.net Company Profile |
SEC
News |
Chart |
Request a new note
C
A N
S L
I M
|
SILC
-
NASDAQ
Silicom Ltd
COMPUTER HARDWARE - Networking andamp; Communication Dev
|
$60.09
|
-1.58
-2.56% |
$61.98
|
77,745
77.75% of 50 DAV
50 DAV is 100,000
|
$73.44
-18.18%
|
12/23/2013
|
$44.62
|
PP = $46.25
|
|
MB = $48.56
|
Most Recent Note - 4/4/2014 12:46:41 PM
G - Slumping today near a recent low ($58.12 on 3/26/14) where a violation may trigger a more worrisome technical sell signal. Halted its slide following a damaging 50 DMA line violation last week. A rebound above that important short-term average would help its outlook improve. See the latest FSU analysis for more details and a new annotated graph.
>>> FEATURED STOCK ARTICLE : Halted Slide Following 50-Day Moving Average Violation - 4/3/2014
View all notes |
Set NEW NOTE alert |
CANSLIM.net Company Profile |
SEC
News |
Chart |
Request a new note
C
A N
S L
I M
|
VRX
-
NYSE
Valeant Pharmaceuticals
DRUGS - Drug Manufacturers - Other
|
$124.69
|
-4.41
-3.42% |
$131.31
|
3,294,576
183.85% of 50 DAV
50 DAV is 1,792,000
|
$153.10
-18.56%
|
9/11/2013
|
$100.26
|
PP = $105.50
|
|
MB = $110.78
|
Most Recent Note - 4/4/2014 12:49:22 PM
Today's loss led to a violation of its recent low ($124.67 on 3/27/14) which raises more serious concerns. A rally back above the 50 DMA line is needed to help its outlook improve. Faces resistance due to overhead supply up through $153 which may hinder any upward price progress. It will be dropped from the Featured Stocks list tonight.
>>> FEATURED STOCK ARTICLE : After Damaging Losses a Rebound Above 50 DMA Line is Needed - 4/2/2014
View all notes |
Set NEW NOTE alert |
CANSLIM.net Company Profile |
SEC
News |
Chart |
Request a new note
C
A N
S L
I M
|
|
|
|
THESE ARE NOT BUY RECOMMENDATIONS!
Comments contained in the body of this report are technical
opinions only. The material herein has been obtained
from sources believed to be reliable and accurate, however,
its accuracy and completeness cannot be guaranteed.
This site is not an investment advisor, hence it does
not endorse or recommend any securities or other investments.
Any recommendation contained in this report may not
be suitable for all investors and it is not to be deemed
an offer or solicitation on our part with respect to
the purchase or sale of any securities. All trademarks,
service marks and trade names appearing in this report
are the property of their respective owners, and are
likewise used for identification purposes only.
This report is a service available
only to active Paid Premium Members.
You may opt-out of receiving report notifications
at any time. Questions or comments may be submitted
by writing to Premium Membership Services 665 S.E. 10 Street, Suite 201 Deerfield Beach, FL 33441-5634 or by calling 1-800-965-8307
or 954-785-1121.
|
|
|

