***Last / Change / Volume data in this table is the closing quote data***
Symbol/Exchange
Company Name
Industry Group |
PRICE |
CHANGE
(%Change) |
Day High |
Volume
(% DAV)
(% 50 day avg vol) |
52 Wk Hi
% From Hi |
Featured
Date |
Price
Featured |
Pivot Featured |
|
Max Buy |
ACN
-
NYSE
Accenture Plc
DIVERSIFIED SERVICES - Business/Management Services
|
$64.44
|
-0.51
-0.79% |
$64.77
|
2,383,996
73.17% of 50 DAV
50 DAV is 3,258,000
|
$65.89
-2.20%
|
3/23/2012
|
$64.13
|
PP = $63.76
|
|
MB = $66.95
|
 Most Recent Note - 4/4/2012 4:14:12 PM
Y - Holding its ground with volume totals cooling since the gain above the pivot point on 3/23/12 backed by +88% above average volume triggered a new (or add-on) technical buy signal. Prior highs in the $62-63 area define initial support to watch above its 50 DMA line.
>>> The latest Featured Stock Update with an annotated graph appeared on 3/23/2012. Click here.
View all notes |
Alert me of new notes |
CANSLIM.net Company Profile |
SEC |
Zacks Reports |
StockTalk |
News |
Chart |
Request a new note
C
A N
S L
I M


|
ADS
-
NYSE
Alliance Data Sys Corp
COMPUTER SOFTWARE and SERVICES - Information and Delivery Service
|
$126.60
|
-0.59
-0.46% |
$127.02
|
540,294
83.97% of 50 DAV
50 DAV is 643,400
|
$127.71
-0.87%
|
1/17/2012
|
$108.24
|
PP = $107.43
|
|
MB = $112.80
|
Most Recent Note - 4/4/2012 4:15:41 PM
G - Still holding its ground stubbornly in a tight range near its all-time high. Fundamental concerns were raised by earnings reported +9%, well below the +25% minimum guideline in the latest quarter ended December 31, 2011.
>>> The latest Featured Stock Update with an annotated graph appeared on 2/29/2012. Click here.
View all notes |
Alert me of new notes |
CANSLIM.net Company Profile |
SEC |
Zacks Reports |
StockTalk |
News |
Chart |
Request a new note
C
A N
S L
I M
|
ALLT
-
NASDAQ
Allot Communications Ltd
COMPUTER SOFTWARE andamp; SERVICES - Technical andamp; System Software
|
$22.50
|
-1.04
-4.42% |
$22.95
|
1,090,940
250.79% of 50 DAV
50 DAV is 435,000
|
$24.02
-6.33%
|
3/13/2012
|
$19.72
|
PP = $18.91
|
|
MB = $19.86
|
Most Recent Note - 4/4/2012 10:47:57 AM
G -Gapped down today after churning above average volume on the prior session near its 52-week high, extended from its prior base. Prior highs near $18-19 define initial support to watch on pullbacks.
>>> The latest Featured Stock Update with an annotated graph appeared on 3/19/2012. Click here.
View all notes |
Alert me of new notes |
CANSLIM.net Company Profile |
SEC |
Zacks Reports |
StockTalk |
News |
Chart |
Request a new note
C
A N
S L
I M
|
ALXN
-
NASDAQ
Alexion Pharmaceuticals
DRUGS - Drug Manufacturers - Other
|
$92.83
|
-1.04
-1.11% |
$93.74
|
814,191
61.74% of 50 DAV
50 DAV is 1,318,700
|
$95.01
-2.29%
|
3/12/2012
|
$87.87
|
PP = $87.73
|
|
MB = $92.12
|
Most Recent Note - 4/4/2012 4:33:38 PM
G - Hovering near its all-time high with volume totals cooling, action which suggests that few investors are exiting. Support to watch is at its 50 DMA line ($85.02).
>>> The latest Featured Stock Update with an annotated graph appeared on 2/24/2012. Click here.
View all notes |
Alert me of new notes |
CANSLIM.net Company Profile |
SEC |
Zacks Reports |
StockTalk |
News |
Chart |
Request a new note
C
A N
S L
I M
|
BODY
-
NASDAQ
Body Central Corp
RETAIL - Catalog andamp; Mail Order Houses
|
$27.53
|
-0.16
-0.58% |
$27.78
|
84,590
38.59% of 50 DAV
50 DAV is 219,200
|
$29.49
-6.65%
|
1/27/2012
|
$26.69
|
PP = $25.46
|
|
MB = $26.73
|
Most Recent Note - 4/2/2012 10:27:30 AM
G - Pulling back today when perched within close striking distance of its 52-week high. Found support at its 50 DMA line and prior highs in the $26 area during its recent consolidation. Subsequent damaging losses may trigger a more worrisome technical sell signal.
>>> The latest Featured Stock Update with an annotated graph appeared on 3/13/2012. Click here.
View all notes |
Alert me of new notes |
CANSLIM.net Company Profile |
SEC |
Zacks Reports |
StockTalk |
News |
Chart |
Request a new note
C
A N
S L
I M
|
Symbol/Exchange
Company Name
Industry Group |
PRICE |
CHANGE
(%Change) |
Day High |
Volume
(% DAV)
(% 50 day avg vol) |
52 Wk Hi
% From Hi |
Featured
Date |
Price
Featured |
Pivot Featured |
|
Max Buy |
CDNS
-
NASDAQ
Cadence Design Systems
COMPUTER SOFTWARE and SERVICES - Technical and System Software
|
$11.76
|
-0.13
-1.09% |
$11.85
|
2,793,300
82.76% of 50 DAV
50 DAV is 3,375,000
|
$12.60
-6.67%
|
2/3/2012
|
$11.66
|
PP = $11.15
|
|
MB = $11.71
|
Most Recent Note - 4/4/2012 4:19:20 PM
G - Volume totals have been cooling, meanwhile it is consolidating near its 50 DMA line. Its Relative Strength Rank has slumped to 79, just under the 80+ guideline for buy candidates under the fact-based system. The prior low ($11.24 on 3/06/12) defines the next important support level to watch.
>>> The latest Featured Stock Update with an annotated graph appeared on 3/28/2012. Click here.
View all notes |
Alert me of new notes |
CANSLIM.net Company Profile |
SEC |
Zacks Reports |
StockTalk |
News |
Chart |
Request a new note
C
A N
S L
I M
|
CELG
-
NASDAQ
Celgene Corp
DRUGS - Drug Manufacturers - Major
|
$79.22
|
-1.07
-1.33% |
$80.42
|
3,873,070
138.06% of 50 DAV
50 DAV is 2,805,400
|
$80.37
-1.43%
|
2/2/2012
|
$74.16
|
PP = $75.21
|
|
MB = $78.97
|
Most Recent Note - 4/4/2012 11:59:23 AM
G - Pulling back today following a gain backed by +52% above average volume that confirmed a technical buy signal. Color code was changed to green after quickly rallying above its "max buy" level. Its 50 DMA line defines support to watch.
>>> The latest Featured Stock Update with an annotated graph appeared on 3/26/2012. Click here.
View all notes |
Alert me of new notes |
CANSLIM.net Company Profile |
SEC |
Zacks Reports |
StockTalk |
News |
Chart |
Request a new note
C
A N
S L
I M
|
COO
-
NYSE
Cooper Companies Inc
HEALTH SERVICES - Medical Instruments and Supplies
|
$80.68
|
-0.87
-1.07% |
$80.79
|
347,106
86.45% of 50 DAV
50 DAV is 401,500
|
$84.20
-4.18%
|
3/9/2012
|
$83.05
|
PP = $81.02
|
|
MB = $85.07
|
Most Recent Note - 4/4/2012 4:37:07 PM
Y - Still perched just -4.2% off its 52-week high today, hovering near its pivot point with no resistance remaining. While trading sideways in recent weeks its Relative Strength rating slumped, and now at a mediocre 68, that rating is below the 80+ guideline for buy candidates.
>>> The latest Featured Stock Update with an annotated graph appeared on 3/9/2012. Click here.
View all notes |
Alert me of new notes |
CANSLIM.net Company Profile |
SEC |
Zacks Reports |
StockTalk |
News |
Chart |
Request a new note
C
A N
S L
I M
|
DISH
-
NASDAQ
Dish Network Corp Cl A
CONSUMER DURABLES - Electronic Equipment
|
$32.66
|
-0.63
-1.89% |
$33.00
|
1,813,461
68.07% of 50 DAV
50 DAV is 2,664,300
|
$35.64
-8.36%
|
3/7/2012
|
$30.83
|
PP = $30.10
|
|
MB = $31.61
|
Most Recent Note - 4/4/2012 4:22:33 PM
G - Still consolidating above prior highs with volume totals cooling since blasting higher on 3/22/12 with heavy volume. Prior highs in the $30 area define initial support to watch on pullbacks.
>>> The latest Featured Stock Update with an annotated graph appeared on 3/14/2012. Click here.
View all notes |
Alert me of new notes |
CANSLIM.net Company Profile |
SEC |
Zacks Reports |
StockTalk |
News |
Chart |
Request a new note
C
A N
S L
I M
|
FEIC
-
NASDAQ
F E I Co
ELECTRONICS - Diversified Electronics
|
$47.93
|
-1.09
-2.22% |
$48.75
|
275,983
87.59% of 50 DAV
50 DAV is 315,100
|
$49.92
-3.99%
|
12/7/2011
|
$41.41
|
PP = $42.35
|
|
MB = $44.47
|
Most Recent Note - 4/3/2012 3:39:23 PM
G - Hovering at its 52-week high today with no resistance due to overhead supply. The latest quarterly report showed +21% earnings for the Dec '11 quarter, below the +25% minimum guideline for earnings growth.
>>> The latest Featured Stock Update with an annotated graph appeared on 3/12/2012. Click here.
View all notes |
Alert me of new notes |
CANSLIM.net Company Profile |
SEC |
Zacks Reports |
StockTalk |
News |
Chart |
Request a new note
C
A N
S L
I M
|
Symbol/Exchange
Company Name
Industry Group |
PRICE |
CHANGE
(%Change) |
Day High |
Volume
(% DAV)
(% 50 day avg vol) |
52 Wk Hi
% From Hi |
Featured
Date |
Price
Featured |
Pivot Featured |
|
Max Buy |
GNC
-
NYSE
G N C Holdings Inc
RETAIL - Drug Stores
|
$35.75
|
-0.33
-0.91% |
$35.97
|
1,054,328
65.83% of 50 DAV
50 DAV is 1,601,700
|
$36.10
-0.97%
|
1/19/2012
|
$28.99
|
PP = $29.60
|
|
MB = $31.08
|
Most Recent Note - 4/3/2012 12:03:09 PM
G - Its 50 DMA line defines near-term chart support to watch on pullbacks. Still inching higher, it touched a new high today while adding to its recent spurt of small gains on average volume. It completed Secondary Offerings on 10/25/11 and 3/13/12 after making steady progress following its 4/01/11 IPO.
>>> The latest Featured Stock Update with an annotated graph appeared on 3/5/2012. Click here.
View all notes |
Alert me of new notes |
CANSLIM.net Company Profile |
SEC |
Zacks Reports |
StockTalk |
News |
Chart |
Request a new note
C
A N
S L
I M
|
HLF
-
NYSE
Herbalife Ltd
DRUGS - Nutrition and Weight Management
|
$69.63
|
-0.91
-1.29% |
$70.42
|
1,351,845
98.97% of 50 DAV
50 DAV is 1,365,900
|
$72.11
-3.44%
|
2/22/2012
|
$65.90
|
PP = $63.50
|
|
MB = $66.68
|
Most Recent Note - 4/4/2012 4:25:19 PM
G - Hovering only -3.4% off its all-time high today, stubbornly holding its ground after getting extended from its prior base pattern. Prior highs in the $63 area define support to watch on pullbacks.
>>> The latest Featured Stock Update with an annotated graph appeared on 2/22/2012. Click here.
View all notes |
Alert me of new notes |
CANSLIM.net Company Profile |
SEC |
Zacks Reports |
StockTalk |
News |
Chart |
Request a new note
C
A N
S L
I M
|
ISRG
-
NASDAQ
Intuitive Surgical Inc
HEALTH SERVICES - Medical Appliances and Equipment
|
$543.97
|
-4.42
-0.81% |
$547.51
|
161,159
55.15% of 50 DAV
50 DAV is 292,200
|
$550.47
-1.18%
|
12/20/2011
|
$442.43
|
PP = $449.16
|
|
MB = $471.62
|
Most Recent Note - 4/4/2012 4:28:11 PM
G - On track for its 8th consecutive weekly gain. Stubbornly holding its ground and rising, extended from any sound base pattern. Previously noted - "The December '11 quarterly earnings increased by just below the borderline +25% minimum guideline for ideal buy candidates. Rather than compromise, disciplined investors may sooner consider another Featured Stock when a fresh technical buy signal occurs."
>>> The latest Featured Stock Update with an annotated graph appeared on 3/1/2012. Click here.
View all notes |
Alert me of new notes |
CANSLIM.net Company Profile |
SEC |
Zacks Reports |
StockTalk |
News |
Chart |
Request a new note
C
A N
S L
I M
|
LULU
-
NASDAQ
Lululemon Athletica
MANUFACTURING - Textile Manufacturing
|
$75.30
|
-1.31
-1.71% |
$76.13
|
1,363,971
68.54% of 50 DAV
50 DAV is 1,990,000
|
$76.72
-1.85%
|
1/10/2012
|
$60.97
|
PP = $59.46
|
|
MB = $62.43
|
Most Recent Note - 4/3/2012 4:16:39 PM
G - Up today with slightly higher volume for a best-ever close. It is extended from any sound base. An upward trendline connecting January-March lows defines initial near-term chart support to watch above its 50 DMA line.
>>> The latest Featured Stock Update with an annotated graph appeared on 2/21/2012. Click here.
View all notes |
Alert me of new notes |
CANSLIM.net Company Profile |
SEC |
Zacks Reports |
StockTalk |
News |
Chart |
Request a new note
C
A N
S L
I M
|
MA
-
NYSE
Mastercard Inc Cl A
DIVERSIFIED SERVICES - Business/Management Services
|
$430.94
|
-6.78
-1.55% |
$436.50
|
981,582
104.80% of 50 DAV
50 DAV is 936,600
|
$440.60
-2.19%
|
3/12/2012
|
$419.86
|
PP = $428.67
|
|
MB = $450.10
|
Most Recent Note - 4/4/2012 11:02:38 AM
Y - Pulling back today from a new all-time high hit on the prior session with volume only +23% above average. Gains with at least +40% above average volume, preferably higher, are needed to clinch a proper new (or add-on) technical buy signal. Its 50 DMA line defines near-term support to watch.
>>> The latest Featured Stock Update with an annotated graph appeared on 2/17/2012. Click here.
View all notes |
Alert me of new notes |
CANSLIM.net Company Profile |
SEC |
Zacks Reports |
StockTalk |
News |
Chart |
Request a new note
C
A N
S L
I M
|
Symbol/Exchange
Company Name
Industry Group |
PRICE |
CHANGE
(%Change) |
Day High |
Volume
(% DAV)
(% 50 day avg vol) |
52 Wk Hi
% From Hi |
Featured
Date |
Price
Featured |
Pivot Featured |
|
Max Buy |
MELI
-
NASDAQ
Mercadolibre Inc
INTERNET - Internet Software and; Services
|
$96.78
|
-3.35
-3.35% |
$99.43
|
498,169
101.52% of 50 DAV
50 DAV is 490,700
|
$104.50
-7.39%
|
2/6/2012
|
$97.09
|
PP = $95.58
|
|
MB = $100.36
|
Most Recent Note - 4/4/2012 11:04:32 AM
Y - Down today, slumping near its 50 DMA line again. A damaging violation would raise concerns and trigger a technical sell signal. The recent low ($91.38 on 3/06/12) defines the next important support area to watch.
>>> The latest Featured Stock Update with an annotated graph appeared on 3/29/2012. Click here.
View all notes |
Alert me of new notes |
CANSLIM.net Company Profile |
SEC |
Zacks Reports |
StockTalk |
News |
Chart |
Request a new note
C
A N
S L
I M
|
MG
-
NYSE
Mistras Group Inc
DIVERSIFIED SERVICES - Bulding and Faci;ity Management Services
|
$23.74
|
-1.10
-4.43% |
$24.74
|
163,774
138.56% of 50 DAV
50 DAV is 118,200
|
$26.24
-9.53%
|
3/22/2012
|
$24.96
|
PP = $26.34
|
|
MB = $27.66
|
Most Recent Note - 4/4/2012 11:07:41 AM
G - Down today, consolidating just above its 50 DMA line. Color code is changed to green, meanwhile gains above its recent chart highs are needed to help its technical stance improve. It has remained below the new pivot point cited in the 3/22/12 mid-day report based on its 52-week high plus 10 cents, not triggering a technical buy signal.
>>> The latest Featured Stock Update with an annotated graph appeared on 4/2/2012. Click here.
View all notes |
Alert me of new notes |
CANSLIM.net Company Profile |
SEC |
Zacks Reports |
StockTalk |
News |
Chart |
Request a new note
C
A N
S L
I M
|
MKTX
-
NASDAQ
Marketaxess Holdings Inc
FINANCIAL SERVICES - Investment Brokerage - Nationa
|
$36.98
|
-0.57
-1.52% |
$37.49
|
122,182
42.87% of 50 DAV
50 DAV is 285,000
|
$37.95
-2.56%
|
3/8/2012
|
$35.80
|
PP = $35.52
|
|
MB = $37.30
|
Most Recent Note - 4/4/2012 4:30:36 PM
Y - Volume totals have been cooling while consolidating near its all-time high. Color code is changed to yellow after quietly dipping just under its "max buy" level. Its 50 DMA line defines important support to watch.
>>> The latest Featured Stock Update with an annotated graph appeared on 3/8/2012. Click here.
View all notes |
Alert me of new notes |
CANSLIM.net Company Profile |
SEC |
Zacks Reports |
StockTalk |
News |
Chart |
Request a new note
C
A N
S L
I M
|
NTES
-
NASDAQ
Netease.Com Inc Adr
INTERNET - Internet Information Providers
|
$56.88
|
-2.17
-3.67% |
$58.81
|
767,944
113.55% of 50 DAV
50 DAV is 676,300
|
$60.47
-5.94%
|
3/19/2012
|
$56.18
|
PP = $55.10
|
|
MB = $57.86
|
Most Recent Note - 4/4/2012 4:41:18 PM
G - Suffered its 6th loss in the span of 7 sessions, and its loss on slightly higher volume today led to a close under its "max buy" level. Investors' odds of success are better when buying on strength, rather than on pullbacks. Its old highs in the $55 area define initial support to watch on pullbacks.
>>> The latest Featured Stock Update with an annotated graph appeared on 3/27/2012. Click here.
View all notes |
Alert me of new notes |
CANSLIM.net Company Profile |
SEC |
Zacks Reports |
StockTalk |
News |
Chart |
Request a new note
C
A N
S L
I M
|
RAX
-
NYSE
Rackspace Hosting Inc
INTERNET - Internet Software and; Services
|
$56.53
|
-2.41
-4.09% |
$58.38
|
2,064,984
98.11% of 50 DAV
50 DAV is 2,104,800
|
$59.43
-4.88%
|
2/2/2012
|
$46.69
|
PP = $45.55
|
|
MB = $47.83
|
Most Recent Note - 4/4/2012 4:43:07 PM
G - Pulled back today, yet it remains extended from its prior base. Its 50 DMA line ($52.59) defines important near-term support to watch.
>>> The latest Featured Stock Update with an annotated graph appeared on 2/16/2012. Click here.
View all notes |
Alert me of new notes |
CANSLIM.net Company Profile |
SEC |
Zacks Reports |
StockTalk |
News |
Chart |
Request a new note
C
A N
S L
I M
|
Symbol/Exchange
Company Name
Industry Group |
PRICE |
CHANGE
(%Change) |
Day High |
Volume
(% DAV)
(% 50 day avg vol) |
52 Wk Hi
% From Hi |
Featured
Date |
Price
Featured |
Pivot Featured |
|
Max Buy |
RGR
-
NYSE
Sturm Ruger & Co Inc
CONSUMER DURABLES - Sporting Goods
|
$51.70
|
+0.19
0.37% |
$51.87
|
396,757
122.95% of 50 DAV
50 DAV is 322,700
|
$53.29
-2.98%
|
3/22/2012
|
$46.49
|
PP = $46.78
|
|
MB = $49.12
|
Most Recent Note - 4/3/2012 12:13:05 PM
G - Up today for a 4th consecutive gain and yet another new high. Prior high in the $46 area defines initial chart support to watch on pullbacks toward its 50 DMA line.
>>> The latest Featured Stock Update with an annotated graph appeared on 3/22/2012. Click here.
View all notes |
Alert me of new notes |
CANSLIM.net Company Profile |
SEC |
Zacks Reports |
StockTalk |
News |
Chart |
Request a new note
C
A N
S L
I M
|
RRTS
-
NYSE
Roadrunner Trans Systems
TRANSPORTATION - Air Delivery and Freight Service
|
$17.59
|
-0.16
-0.90% |
$17.75
|
48,894
33.65% of 50 DAV
50 DAV is 145,300
|
$18.59
-5.38%
|
2/10/2012
|
$17.40
|
PP = $17.50
|
|
MB = $18.38
|
Most Recent Note - 4/4/2012 4:44:45 PM
Y - Still testing support at its 50 DMA line again with a quiet loss today. Subsequent losses would raise concerns and trigger technical sell signals. A new pivot point was not cited, yet it has built a base-on-base pattern while consolidating above prior highs in the $17 area.
>>> The latest Featured Stock Update with an annotated graph appeared on 2/13/2012. Click here.
View all notes |
Alert me of new notes |
CANSLIM.net Company Profile |
SEC |
Zacks Reports |
StockTalk |
News |
Chart |
Request a new note
C
A N
S L
I M
|
SHFL
-
NASDAQ
Shuffle Master Inc
MANUFACTURING - Diversified Machinery
|
$17.79
|
-0.64
-3.47% |
$18.30
|
621,201
99.76% of 50 DAV
50 DAV is 622,700
|
$18.77
-5.22%
|
3/6/2012
|
$17.07
|
PP = $15.25
|
|
MB = $16.01
|
Most Recent Note - 4/4/2012 4:46:14 PM
G - Pulled back today on average volume from a new 52-week high hit on the prior session with a volume-driven gain. It may produce more climactic gains, but it is extended from any sound base pattern. Its 50 DMA line defines support to watch on pullbacks.
>>> The latest Featured Stock Update with an annotated graph appeared on 3/15/2012. Click here.
View all notes |
Alert me of new notes |
CANSLIM.net Company Profile |
SEC |
Zacks Reports |
StockTalk |
News |
Chart |
Request a new note
C
A N
S L
I M
|
SWI
-
NYSE
Solarwinds Inc
COMPUTER SOFTWARE and SERVICES - Application Software
|
$37.85
|
-1.65
-4.18% |
$38.95
|
1,680,718
134.81% of 50 DAV
50 DAV is 1,246,700
|
$42.22
-10.35%
|
1/26/2012
|
$32.36
|
PP = $33.78
|
|
MB = $35.47
|
Most Recent Note - 4/4/2012 10:52:04 AM
G - Gapped down today, slumping toward its 50 DMA line. That important short-term average and its prior low ($35.72 on 3/06/12) define chart support where violations would raise concerns and trigger technical sell signals. Earnings below the +25% guideline for the Dec '11 quarter raised fundamental concerns.
>>> The latest Featured Stock Update with an annotated graph appeared on 3/16/2012. Click here.
View all notes |
Alert me of new notes |
CANSLIM.net Company Profile |
SEC |
Zacks Reports |
StockTalk |
News |
Chart |
Request a new note
C
A N
S L
I M
|
SXCI
-
NASDAQ
S X C Health Solutions
COMPUTER SOFTWARE and SERVICES - Healthcare Information Service
|
$76.99
|
-1.88
-2.38% |
$79.24
|
606,975
146.65% of 50 DAV
50 DAV is 413,900
|
$79.26
-2.86%
|
2/23/2012
|
$68.24
|
PP = $66.05
|
|
MB = $69.35
|
Most Recent Note - 4/3/2012 12:21:17 PM
G - Considerable volume-driven gain today for a new 52-week high, getting more extended from its prior base. Its 50 DMA line and prior highs in the $66 area define support to watch on pullbacks.
>>> The latest Featured Stock Update with an annotated graph appeared on 3/6/2012. Click here.
View all notes |
Alert me of new notes |
CANSLIM.net Company Profile |
SEC |
Zacks Reports |
StockTalk |
News |
Chart |
Request a new note
C
A N
S L
I M
|
Symbol/Exchange
Company Name
Industry Group |
PRICE |
CHANGE
(%Change) |
Day High |
Volume
(% DAV)
(% 50 day avg vol) |
52 Wk Hi
% From Hi |
Featured
Date |
Price
Featured |
Pivot Featured |
|
Max Buy |
TDG
-
NYSE
Transdigm Group Inc
AEROSPACE/DEFENSE - Aerospace/Defense Products and; Services
|
$116.18
|
-1.10
-0.94% |
$116.62
|
244,877
58.21% of 50 DAV
50 DAV is 420,700
|
$121.48
-4.36%
|
2/29/2012
|
$120.10
|
PP = $118.93
|
|
MB = $124.88
|
Most Recent Note - 3/30/2012 4:35:12 PM
Y - Up today on light volume after enduring mild distributional pressure this week. It remains below its latest pivot point cited, not having triggered a new buy signal. Its 50 DMA line defines important chart support to watch, and a violation of that important short-term average would trigger a technical sell signal. See the latest FSU analysis for more details and a new annotated graph.
>>> The latest Featured Stock Update with an annotated graph appeared on 3/30/2012. Click here.
View all notes |
Alert me of new notes |
CANSLIM.net Company Profile |
SEC |
Zacks Reports |
StockTalk |
News |
Chart |
Request a new note
C
A N
S L
I M
|
TIBX
-
NASDAQ
Tibco Software Inc
COMPUTER SOFTWARE and SERVICES - Business Software and Services
|
$31.45
|
-0.11
-0.35% |
$31.57
|
2,938,318
120.43% of 50 DAV
50 DAV is 2,439,800
|
$33.00
-4.70%
|
3/30/2012
|
$31.01
|
PP = $31.25
|
|
MB = $32.81
|
Most Recent Note - 4/2/2012 5:47:02 PM
Y - Volume was 2 times average behind today's gain. Reported earnings +25% on +22% sales revenues for the quarter ended February 29, 2012 versus they year ago period. It was featured again in yellow in the 3/30/12 mid-day report with the graph below included while noted - "Fundamentals remain strong concerning the C and A criteria."

>>> The latest Featured Stock Update with an annotated graph appeared on 5/18/2011. Click here.
View all notes |
Alert me of new notes |
CANSLIM.net Company Profile |
SEC |
Zacks Reports |
StockTalk |
News |
Chart |
Request a new note
C
A N
S L
I M
|
TNGO
-
NASDAQ
Tangoe Inc
COMPUTER SOFTWARE and SERVICES - Technical and System Software
|
$18.60
|
-0.52
-2.72% |
$18.96
|
1,315,455
229.09% of 50 DAV
50 DAV is 574,200
|
$20.05
-7.23%
|
3/27/2012
|
$19.35
|
PP = $20.00
|
|
MB = $21.00
|
Most Recent Note - 4/4/2012 10:45:23 AM
Y - Undercut its 50 DMA line with a damaging pullback today, now rebounding above that short-term average, yet clearly coming under distributional pressure. See the latest FSU analysis for more details and a new annotated graph.
>>> The latest Featured Stock Update with an annotated graph appeared on 4/3/2012. Click here.
View all notes |
Alert me of new notes |
CANSLIM.net Company Profile |
SEC |
Zacks Reports |
StockTalk |
News |
Chart |
Request a new note
C
A N
S L
I M
|
TSCO
-
NASDAQ
Tractor Supply Co
SPECIALTY RETAIL - Specialty Retail, Other
|
$92.63
|
-0.26
-0.28% |
$92.82
|
527,932
81.35% of 50 DAV
50 DAV is 649,000
|
$93.22
-0.63%
|
1/12/2012
|
$79.12
|
PP = $75.58
|
|
MB = $79.36
|
Most Recent Note - 4/2/2012 5:48:49 PM
G - Up today for its best-ever close. Its 50 DMA line defines support to watch on pullbacks.
>>> The latest Featured Stock Update with an annotated graph appeared on 2/27/2012. Click here.
View all notes |
Alert me of new notes |
CANSLIM.net Company Profile |
SEC |
Zacks Reports |
StockTalk |
News |
Chart |
Request a new note
C
A N
S L
I M
|
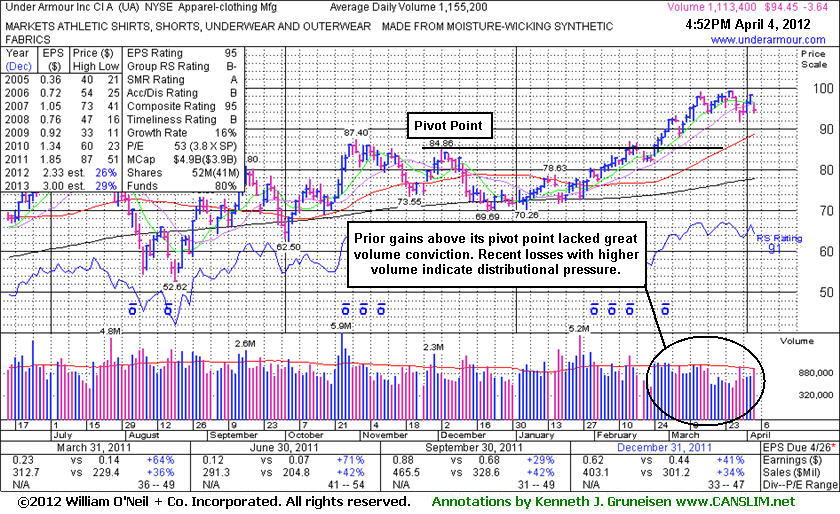
UA
-
NYSE
Under Armour Inc Cl A
CONSUMER NON-DURABLES - Textile - Apparel Clothing
|
$94.45
|
-3.64
-3.71% |
$96.02
|
1,114,833
96.51% of 50 DAV
50 DAV is 1,155,200
|
$99.35
-4.93%
|
2/15/2012
|
$85.77
|
PP = $84.86
|
|
MB = $89.10
|
Most Recent Note - 4/4/2012 5:04:40 PM
G - Prior gains above its pivot point did not have volume sufficient to trigger a proper technical buy signal, and recent losses on higher volume (near average, but above prior session totals) indicate distributional pressure while working on a possible new base-on-base pattern. See the latest FSU analysis for more details and a new annotated graph.
>>> The latest Featured Stock Update with an annotated graph appeared on 4/4/2012. Click here.
View all notes |
Alert me of new notes |
CANSLIM.net Company Profile |
SEC |
Zacks Reports |
StockTalk |
News |
Chart |
Request a new note
C
A N
S L
I M
|
Symbol/Exchange
Company Name
Industry Group |
PRICE |
CHANGE
(%Change) |
Day High |
Volume
(% DAV)
(% 50 day avg vol) |
52 Wk Hi
% From Hi |
Featured
Date |
Price
Featured |
Pivot Featured |
|
Max Buy |
UBNT
-
NASDAQ
Ubiquiti Networks Inc
TELECOMMUNICATIONS - Diversified Communication Serv
|
$31.01
|
-1.94
-5.89% |
$32.90
|
420,431
123.91% of 50 DAV
50 DAV is 339,300
|
$33.97
-8.71%
|
1/27/2012
|
$22.25
|
PP = $23.14
|
|
MB = $24.30
|
Most Recent Note - 4/4/2012 10:56:34 AM
G - Pulling back today amid widespread market weakness. It is extended from the previous base. Its 50 DMA line defines important near-term support to watch on pullbacks.
>>> The latest Featured Stock Update with an annotated graph appeared on 3/21/2012. Click here.
View all notes |
Alert me of new notes |
CANSLIM.net Company Profile |
SEC |
Zacks Reports |
StockTalk |
News |
Chart |
Request a new note
C
A N
S L
I M
|
ULTA
-
NASDAQ
Ulta Salon Cosm & Frag
SPECIALTY RETAIL - Specialty Retail, Other
|
$94.93
|
-0.08
-0.08% |
$95.24
|
551,751
80.09% of 50 DAV
50 DAV is 688,900
|
$95.62
-0.72%
|
1/11/2012
|
$71.97
|
PP = $75.80
|
|
MB = $79.59
|
Most Recent Note - 4/4/2012 10:58:11 AM
G - Pulling back today from another new all-time high hit on the prior session. Its 50 DMA line defines support to watch well above its prior highs in the $75 area. It is extended from any sound base pattern.
>>> The latest Featured Stock Update with an annotated graph appeared on 2/28/2012. Click here.
View all notes |
Alert me of new notes |
CANSLIM.net Company Profile |
SEC |
Zacks Reports |
StockTalk |
News |
Chart |
Request a new note
C
A N
S L
I M
|
V
-
NYSE
Visa Inc Cl A
DIVERSIFIED SERVICES - Business/Management Services
|
$118.98
|
-1.38
-1.15% |
$119.68
|
2,577,012
71.89% of 50 DAV
50 DAV is 3,584,600
|
$120.70
-1.42%
|
3/12/2012
|
$116.53
|
PP = $119.46
|
|
MB = $125.43
|
Most Recent Note - 4/4/2012 10:59:55 AM
Y - Hovering near its all-time high today, wedging higher without great volume conviction behind gains in recent weeks. Volume-driven gains may trigger a new (or add-on) technical buy signal, meanwhile its 50 DMA line defines support to watch well above prior highs in the $103-104 area.
>>> The latest Featured Stock Update with an annotated graph appeared on 3/7/2012. Click here.
View all notes |
Alert me of new notes |
CANSLIM.net Company Profile |
SEC |
Zacks Reports |
StockTalk |
News |
Chart |
Request a new note
C
A N
S L
I M
|