You are not logged in.
This means you
CAN ONLY VIEW reports that were published prior to Monday, April 14, 2025.
You
MUST UPGRADE YOUR MEMBERSHIP if you want to see any current reports.
AFTER MARKET UPDATE - WEDNESDAY, APRIL 3RD, 2013
Previous After Market Report Next After Market Report >>>
|
|
|
|
DOW |
-111.66 |
14,550.35 |
-0.76% |
|
Volume |
811,399,250 |
+27% |
|
Volume |
1,763,939,350 |
+16% |
|
NASDAQ |
-36.26 |
3,218.60 |
-1.11% |
|
Advancers |
649 |
21% |
|
Advancers |
572 |
22% |
|
S&P 500 |
-16.56 |
1,553.69 |
-1.05% |
|
Decliners |
2,358 |
76% |
|
Decliners |
1,891 |
74% |
|
Russell 2000 |
-15.59 |
918.71 |
-1.67% |
|
52 Wk Highs |
125 |
|
|
52 Wk Highs |
63 |
|
|
S&P 600 |
-7.80 |
514.45 |
-1.49% |
|
52 Wk Lows |
48 |
|
|
52 Wk Lows |
48 |
|
|
 |
Indices' Rally Under Pressure and Transportation Index Showing Weakness
Kenneth J. Gruneisen - Passed the CAN SLIM® Master's Exam
The major averages fell on Wednesday, with the S&P 500 Index posting its biggest daily decline in more than a month after a weaker-than-expected survey of private employers raised concerns about the strength of the economy. Volume totals on the exchanges were higher and slightly above average daily volume totals on the NYSE and on the Nasdaq exchange. Decliners outpaced advancers on the NYSE by nearly 4 to 1 and on the Nasdaq by more than 3 to 1. There were 27 high-ranked companies from the CANSLIM.net Leaders List making new 52-week highs and appearing on the CANSLIM.net BreakOuts Page, less than half the prior session total of 61 stocks. Only 1 of the 17 high-ranked companies currently included on the Featured Stocks Page posted a gain, a disconcertingly negative bias versus the broader market.
Investors were cautions after news the Pentagon was sending a missile defense system to Guam in the coming weeks and following remarks by Defense Secretary Chuck Hagel that North Korea posed a "real and clear" danger.
The ADP National Employment report on private-sector jobs showed less-than-expected hiring in March, which was a worrying sign for investors before the Labor Department's March non-farm payrolls report on Friday. The ADP report showed U.S. companies hired at the slowest pace in five months, far below what economists had expected, though the February report was revised upward. Friday's report is expected to show 200,000 jobs were created last month. Additionally, the Institute for Supply Management's March services sector index came in below expectations, with the pace of growth at the lowest level in seven months.
On Tuesday we noted that decliners beat advancers in the market, despite gains in the three major indexes. Energy and financial sectors led the pullback Wednesday, meanwhile Northrop Grumman Corp (NOC +1.12%) and other Defense company shares gained, despite the broader move lower. ConAgra Foods Inc (CAG -1.9%) fell after reporting third-quarter earnings. Monsanto Co (MON +0.8%) edged higher after raising its full-year profit forecast. Defensive sectors like healthcare, consumer staples and utilities, have led this year's rise.
New buying efforts may still be justified under the fact-based system in ideal buy candidates fitting all key criteria, however, recent distribution days and weak action among high-ranked stocks has resulted in a noted shift in the market's (M criteria) stance to a rally that is currently "under pressure". Any sustainable rally requires a healthy crop of companies hitting new 52-week highs, so it is always essential to see meaningful leadership (stocks hitting new 52-week highs).
Watch for an announcement via email concerning the next WEBCAST. The webcast will also be available via an updated link highlighted at the top of the Premium Member Homepage.
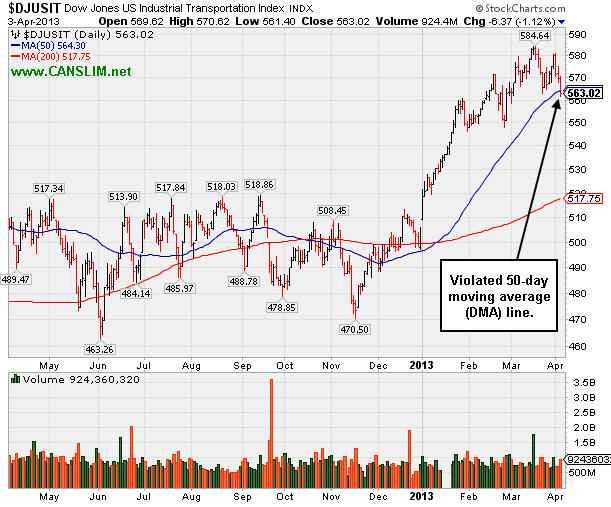
PICTURED: The Dow Jones US Industrial Transportation Index ($DJUSIT -1.12%) slumped to a close below its 50-day moving average for the first time since November 21. Since this index is seen as a barometer of economic activity, the weakness is noted as a worrisome sign of market deterioration.
|
 Kenneth J. Gruneisen started out as a licensed stockbroker in August 1987, a couple of months prior to the historic stock market crash that took the Dow Jones Industrial Average down -22.6% in a single day. He has published daily fact-based fundamental and technical analysis on high-ranked stocks online for two decades. Through FACTBASEDINVESTING.COM, Kenneth provides educational articles, news, market commentary, and other information regarding proven investment systems that work in good times and bad.
Comments contained in the body of this report are technical opinions only and are not necessarily those of Gruneisen Growth Corp. The material herein has been obtained from sources believed to be reliable and accurate, however, its accuracy and completeness cannot be guaranteed. Our firm, employees, and customers may effect transactions, including transactions contrary to any recommendation herein, or have positions in the securities mentioned herein or options with respect thereto. Any recommendation contained in this report may not be suitable for all investors and it is not to be deemed an offer or solicitation on our part with respect to the purchase or sale of any securities. |
|
 |
Gold & Silver Index Dives; Financial, Tech, and Most Groups Fell
Kenneth J. Gruneisen - Passed the CAN SLIM® Master's Exam
The Gold & Silver Index ($XAU -4.24%) was a standout decliner on Wednesday, punishing investors positioned in that classic "safe haven" group. Weakness in energy-related shares led the Oil Services Index ($OSX -2.19%) and the Integrated Oil Index ($XOI -1.64%) lower. The Broker/Dealer Index ($XBD -2.10%) and Bank Index ($BKX -2.02%) were also negative influences on the major averages. The Retail Index ($RLX -0.97%) fell, the Healthcare Index ($HMO -0.92%) edged lower, and in the tech sector there were unanimous losses from the Semiconductor Index ($SOX -1.98%), Biotechnology Index ($BTK -1.86%), Internet Index ($IIX -1.07%), and the Networking Index ($NWX -0.76%).
Charts courtesy www.stockcharts.com
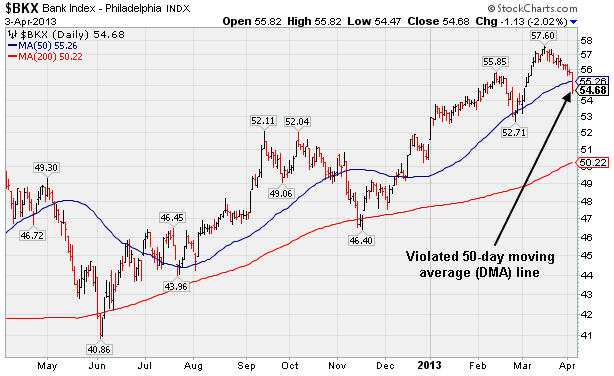
PICTURED: The Bank Index ($BKX -2.02%) violated its 50-day moving average (DMA) line, which is a disconcerting message from a group which is recognized as a "leading indicator" for the broader market. A prompt rebound would be reassuring, while further deterioration in the influential financial groups would not bode well for the broader market outlook.
| Oil Services |
$OSX |
236.12 |
-5.28 |
-2.19% |
+7.25% |
| Healthcare |
$HMO |
2,892.33 |
-26.88 |
-0.92% |
+15.04% |
| Integrated Oil |
$XOI |
1,332.09 |
-22.16 |
-1.64% |
+7.27% |
| Semiconductor |
$SOX |
415.81 |
-8.40 |
-1.98% |
+8.27% |
| Networking |
$NWX |
227.20 |
-1.74 |
-0.76% |
+0.29% |
| Internet |
$IIX |
358.08 |
-3.87 |
-1.07% |
+9.51% |
| Broker/Dealer |
$XBD |
107.72 |
-2.31 |
-2.10% |
+14.20% |
| Retail |
$RLX |
722.05 |
-7.09 |
-0.97% |
+10.56% |
| Gold & Silver |
$XAU |
123.24 |
-5.46 |
-4.24% |
-25.58% |
| Bank |
$BKX |
54.68 |
-1.13 |
-2.02% |
+6.63% |
| Biotech |
$BTK |
1,804.02 |
-34.17 |
-1.86% |
+16.61% |
|
|
|
 |
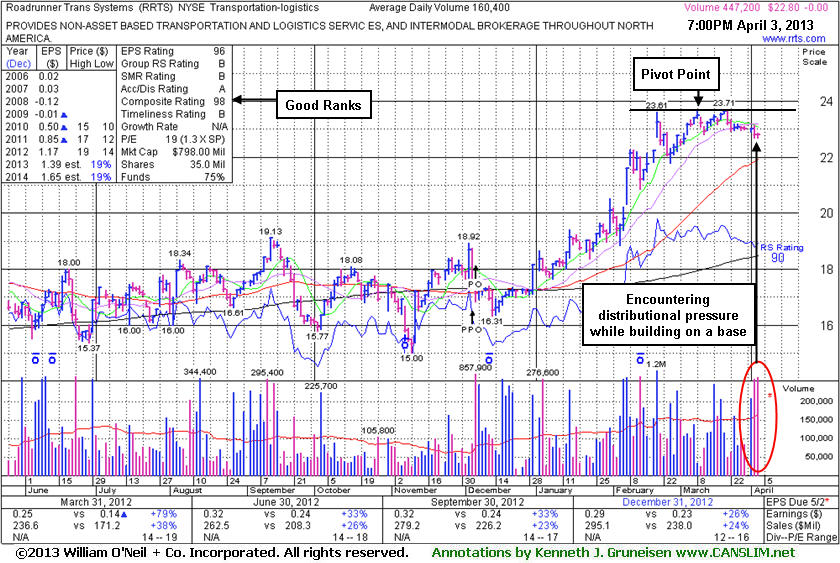
Encountering Distributional Pressure While Building a New Base
Kenneth J. Gruneisen - Passed the CAN SLIM® Master's Exam
Often, when a leading stock is setting up to breakout of a solid base it is highlighted in CANSLIM.net's Mid-Day Breakouts Report. The most relevant factors are noted in the report which alerts prudent CANSLIM oriented investors to place the issue in their watch list. After doing any necessary backup research, the investor is prepared to act after the stock triggers a technical buy signal (breaks above its pivot point on more than +50% average turnover) but before it gets too extended from a sound base. In the event the stock fails to trigger a technical buy signal and its price declines then it will simply be removed from the watch list. Disciplined investors know to buy as near as possible to the pivot point and avoid chasing stocks after they have rallied more than +5% above their pivot point. It is crucial to always limit losses whenever any stock heads the wrong direction, and disciplined investors sell if a struggling stock ever falls more than -7% from their purchase price.
Roadrunner Transportation Systems Inc (RRTS $22.80) was highlighted in yellow with new pivot point cited based on its 3/08/13 high plus 10 cents while consolidating in a flat base pattern in the earlier mid-day report (read here). The company completed a new Public Offering on 12/06/12 and, technically, it broke out above previously stubborn resistance in $19 area with volume-driven gains in January. Disciplined investors may watch for a fresh technical breakout before taking action.
Regular readers may recall that, based on weak action, RRTS had been dropped from the Featured Stocks list on 5/18/12 following a choppy period. Its last appearance in this FSU section was on 4/09/12 with an annotated graph under the headline, "Consolidation Near Important Chart Support Level". A subsequent breakout was very short-lived and it soon slumped below its 50-day and 200-day moving average (DMA) lines during its consolidation, raising concerns. It reported earnings +26% on +24% sales revenues for the quarter ended December 31, 2012 versus the year ago period, continuing its streak of quarters with earnings increases above the +25% minimum guideline (satisfying the C criteria). Fundamentals remain strong enough to still satisfy the C and A criteria, however decelerating sales revenues and earnings increases in sequential quarterly comparisons through the Dec '12 quarter are noted as a concern. It is more ideal when a company shows accelerating sales revenues and earnings increases.
The number of top-rated funds owning its shares rose from 168 in Jun '12 to 198 in Mar '13, a reassuring sign concerning the I criteria. The Transportation - Logistics group currently has a mediocre (67) Relative Strength Rating, which is a bit of a concern with respect to the L criteria, however there is at least one other strong leader in the group showing recent strength. Confirming volume-driven gains into new high ground from it and other leaders in the group would be a welcome reassurance to disciplined investors.
|
|
|
Color Codes Explained :
Y - Better candidates highlighted by our
staff of experts.
G - Previously featured
in past reports as yellow but may no longer be buyable under the
guidelines.
***Last / Change / Volume data in this table is the closing quote data***
Symbol/Exchange
Company Name
Industry Group |
PRICE |
CHANGE
(%Change) |
Day High |
Volume
(% DAV)
(% 50 day avg vol) |
52 Wk Hi
% From Hi |
Featured
Date |
Price
Featured |
Pivot Featured |
|
Max Buy |
AMBA
-
NASDAQ
Ambarella Inc
ELECTRONICS - Semiconductor - Specialized
|
$13.70
|
-1.24
-8.30% |
$15.04
|
1,008,434
356.34% of 50 DAV
50 DAV is 283,000
|
$16.00
-14.38%
|
3/26/2013
|
$15.31
|
PP = $14.83
|
|
MB = $15.57
|
 Most Recent Note - 4/3/2013 1:34:39 PM
Y - Retreating from its 52-week with above average volume behind today's 2nd damaging loss in 3 sessions after a "negative reversal" on 4/01/13. Disciplined investors avoid chasing extended stocks and always limit losses by selling if any stock falls more than -7% from their purchase price.
>>> The latest Featured Stock Update with an annotated graph appeared on 3/26/2013. Click here.
View all notes |
Alert me of new notes |
CANSLIM.net Company Profile |
SEC |
Zacks Reports |
StockTalk |
News |
Chart |
Request a new note
C
A N
S L
I M


|
CELG
-
NASDAQ
Celgene Corp
DRUGS - Drug Manufacturers - Major
|
$115.55
|
-2.24
-1.90% |
$118.30
|
3,447,498
103.97% of 50 DAV
50 DAV is 3,315,900
|
$118.78
-2.72%
|
3/27/2013
|
$113.24
|
PP = $115.54
|
|
MB = $121.32
|
Most Recent Note - 3/28/2013 6:05:26 PM
Y - It wedged to new highs from an advanced "3-weeks tight" base with only average volume behind its gain today above the new pivot point cited based on its 3/14/13 high plus 10 cents. See the latest FSU analysis for more details and a new annotated weekly graph.
>>> The latest Featured Stock Update with an annotated graph appeared on 3/28/2013. Click here.
View all notes |
Alert me of new notes |
CANSLIM.net Company Profile |
SEC |
Zacks Reports |
StockTalk |
News |
Chart |
Request a new note
C
A N
S L
I M
|
CFNL
-
NASDAQ
Cardinal Financial Corp
BANKING - Regional - Southeast Banks
|
$17.35
|
-0.23
-1.31% |
$17.60
|
191,676
91.27% of 50 DAV
50 DAV is 210,000
|
$18.40
-5.71%
|
3/22/2013
|
$17.99
|
PP = $18.29
|
|
MB = $19.20
|
Most Recent Note - 3/28/2013 2:36:56 PM
Y - Inched higher with small gains lacking great volume conviction since forming the previously noted advanced "3-weeks tight" base. Gains above the pivot point must have at least the bare minimum +40% above average volume, preferably more, to trigger a proper new (or add-on) technical buy signal.
>>> The latest Featured Stock Update with an annotated graph appeared on 3/18/2013. Click here.
View all notes |
Alert me of new notes |
CANSLIM.net Company Profile |
SEC |
Zacks Reports |
StockTalk |
News |
Chart |
Request a new note
C
A N
S L
I M
|
CMCSA
-
NASDAQ
Comcast Corp Cl A
MEDIA - CATV Systems
|
$41.82
|
-0.48
-1.13% |
$42.61
|
12,905,543
89.89% of 50 DAV
50 DAV is 14,357,300
|
$42.36
-1.27%
|
12/3/2012
|
$37.08
|
PP = $38.06
|
|
MB = $39.96
|
Most Recent Note - 4/2/2013 4:36:31 PM
G - Finished near the session high with a gain on average volume for a new 52-week high. Found recent support and rallied from its 50 DMA line. Relative Strength Rating is at 79, just below the 80+ guideline for buy candidates. Fundamental concerns also remain since it reported earnings +11% on +6% sales revenues for the Dec '12 quarter, below the +25% minimum guideline (C criteria).
>>> The latest Featured Stock Update with an annotated graph appeared on 3/19/2013. Click here.
View all notes |
Alert me of new notes |
CANSLIM.net Company Profile |
SEC |
Zacks Reports |
StockTalk |
News |
Chart |
Request a new note
C
A N
S L
I M
|
CVLT
-
NASDAQ
Commvault Systems Inc
COMPUTER SOFTWARE and SERVICES - Business Software and Services
|
$76.41
|
-4.37
-5.41% |
$81.87
|
856,874
116.20% of 50 DAV
50 DAV is 737,400
|
$86.89
-12.06%
|
3/14/2013
|
$84.71
|
PP = $79.63
|
|
MB = $83.61
|
Most Recent Note - 4/3/2013 1:40:02 PM
G - Slumping below its 50 DMA line and below prior highs with today's big loss on light volume. The technical deterioration raises concerns and its color code is changed to green. Only a prompt rebound above its short-term average would help its outlook.
>>> The latest Featured Stock Update with an annotated graph appeared on 3/14/2013. Click here.
View all notes |
Alert me of new notes |
CANSLIM.net Company Profile |
SEC |
Zacks Reports |
StockTalk |
News |
Chart |
Request a new note
C
A N
S L
I M
|
Symbol/Exchange
Company Name
Industry Group |
PRICE |
CHANGE
(%Change) |
Day High |
Volume
(% DAV)
(% 50 day avg vol) |
52 Wk Hi
% From Hi |
Featured
Date |
Price
Featured |
Pivot Featured |
|
Max Buy |
EVER
-
NYSE
Everbank Financial Corp
BANKING
|
$15.07
|
-0.05
-0.33% |
$15.17
|
859,207
96.33% of 50 DAV
50 DAV is 891,900
|
$17.29
-12.84%
|
3/4/2013
|
$15.38
|
PP = $15.83
|
|
MB = $16.62
|
Most Recent Note - 4/2/2013 4:40:04 PM
G - Slumped to a close just below its 50 DMA line ($15.16 now) today. That important short-term average has acted as support since damaging losses violated prior highs in the $16 area raising concerns while completely negating its prior technical breakout.
>>> The latest Featured Stock Update with an annotated graph appeared on 4/2/2013. Click here.
View all notes |
Alert me of new notes |
CANSLIM.net Company Profile |
SEC |
Zacks Reports |
StockTalk |
News |
Chart |
Request a new note
C
A N
S L
I M
|
FLT
-
NYSE
Fleetcor Technologies
DIVERSIFIED SERVICES - Business/Management Services
|
$77.27
|
-0.56
-0.72% |
$78.37
|
915,349
117.78% of 50 DAV
50 DAV is 777,200
|
$78.13
-1.10%
|
3/21/2013
|
$71.14
|
PP = $73.00
|
|
MB = $76.65
|
Most Recent Note - 4/1/2013 6:04:06 PM
G - Color code is changed to green after a gain today with above average volume for another new 52-week high, getting extended above its "max buy" level. Prior high in the $72 area defines near-term support to watch on pullbacks.
>>> The latest Featured Stock Update with an annotated graph appeared on 3/21/2013. Click here.
View all notes |
Alert me of new notes |
CANSLIM.net Company Profile |
SEC |
Zacks Reports |
StockTalk |
News |
Chart |
Request a new note
C
A N
S L
I M
|
LNKD
-
NYSE
Linkedin Corp Class A
INTERNET - Internet Information Providers
|
$167.31
|
-5.37
-3.11% |
$174.00
|
2,970,971
121.23% of 50 DAV
50 DAV is 2,450,700
|
$184.15
-9.14%
|
2/8/2013
|
$147.04
|
PP = $127.55
|
|
MB = $133.93
|
Most Recent Note - 4/3/2013 1:47:41 PM
G - Retreating with slightly higher volume behind today's loss indicating distributional pressure. Its 50 DMA line ($157.43 now) defines important near term support to watch. Patient investors may watch for a secondary buy point or new base to form and be noted.
>>> The latest Featured Stock Update with an annotated graph appeared on 3/11/2013. Click here.
View all notes |
Alert me of new notes |
CANSLIM.net Company Profile |
SEC |
Zacks Reports |
StockTalk |
News |
Chart |
Request a new note
C
A N
S L
I M
|
MIDD
-
NASDAQ
Middleby Corp
MANUFACTURING - Diversified Machinery
|
$148.15
|
-1.84
-1.23% |
$150.79
|
84,876
86.34% of 50 DAV
50 DAV is 98,300
|
$154.74
-4.26%
|
10/8/2012
|
$118.46
|
PP = $122.67
|
|
MB = $128.80
|
Most Recent Note - 4/1/2013 6:13:43 PM
G - Recently staying in tight trading range near all-time highs, stubbornly holding its ground above its 50 DMA line. Fundamental concerns were recently noted.
>>> The latest Featured Stock Update with an annotated graph appeared on 3/25/2013. Click here.
View all notes |
Alert me of new notes |
CANSLIM.net Company Profile |
SEC |
Zacks Reports |
StockTalk |
News |
Chart |
Request a new note
C
A N
S L
I M
|
MNTX
-
NASDAQ
Manitex International
MANUFACTURING - Diversified Machinery
|
$10.69
|
-1.04
-8.87% |
$11.70
|
614,509
317.08% of 50 DAV
50 DAV is 193,800
|
$13.14
-18.65%
|
3/20/2013
|
$11.29
|
PP = $12.05
|
|
MB = $12.65
|
Most Recent Note - 4/3/2013 11:10:42 AM
Y - Testing near its 50 DMA line today with another damaging loss on heavy volume following a weak finish on the prior session noted as - "Indicating more worrisome distributional pressure." Only a prompt show of support near its 50 DMA line would be encouraging. Disciplined investors avoid chasing extended stocks and always limit losses by selling if any stock falls more than -7% from their purchase price.
>>> The latest Featured Stock Update with an annotated graph appeared on 3/20/2013. Click here.
View all notes |
Alert me of new notes |
CANSLIM.net Company Profile |
SEC |
Zacks Reports |
StockTalk |
News |
Chart |
Request a new note
C
A N
S L
I M
|
Symbol/Exchange
Company Name
Industry Group |
PRICE |
CHANGE
(%Change) |
Day High |
Volume
(% DAV)
(% 50 day avg vol) |
52 Wk Hi
% From Hi |
Featured
Date |
Price
Featured |
Pivot Featured |
|
Max Buy |
MRLN
-
NASDAQ
Marlin Business Services
DIVERSIFIED SERVICES - Rental and Leasing Services
|
$22.91
|
+0.16
0.70% |
$23.25
|
36,965
153.38% of 50 DAV
50 DAV is 24,100
|
$23.98
-4.46%
|
3/15/2013
|
$22.29
|
PP = $23.18
|
|
MB = $24.34
|
Most Recent Note - 4/3/2013 7:28:26 PM
Y - Volume was above average today as it tallied a small gain against a mostly negative market backdrop. Previously noted - "Subsequent volume-driven gains above the pivot point could help clinch a more convincing technical buy signal."
>>> The latest Featured Stock Update with an annotated graph appeared on 3/15/2013. Click here.
View all notes |
Alert me of new notes |
CANSLIM.net Company Profile |
SEC |
Zacks Reports |
StockTalk |
News |
Chart |
Request a new note
C
A N
S L
I M
|
MWIV
-
NASDAQ
M W I Veterinary Supply
HEALTH SERVICES - Medical Instruments and; Supplies
|
$130.39
|
-0.94
-0.72% |
$132.20
|
41,032
72.24% of 50 DAV
50 DAV is 56,800
|
$137.18
-4.95%
|
3/4/2013
|
$130.90
|
PP = $129.45
|
|
MB = $135.92
|
Most Recent Note - 3/28/2013 2:42:58 PM
Y - Still consolidating above its pivot point with volume totals cooling. Its 50 DMA line defines near-term support. Disciplined investors limit loses by selling if ever any stock fall more than -7% from their purchase price.
>>> The latest Featured Stock Update with an annotated graph appeared on 3/6/2013. Click here.
View all notes |
Alert me of new notes |
CANSLIM.net Company Profile |
SEC |
Zacks Reports |
StockTalk |
News |
Chart |
Request a new note
C
A N
S L
I M
|
N
-
NYSE
Netsuite Inc
DIVERSIFIED SERVICES - Business/Management Services
|
$77.63
|
-1.25
-1.58% |
$79.19
|
401,328
106.00% of 50 DAV
50 DAV is 378,600
|
$80.33
-3.36%
|
12/12/2012
|
$64.75
|
PP = $67.12
|
|
MB = $70.48
|
Most Recent Note - 4/1/2013 7:26:50 PM
G - Perched at 52-week and all-time highs after 7 consecutive weekly gains, extended from its prior base. See the latest FSU analysis for more details and a new annotated graph.
>>> The latest Featured Stock Update with an annotated graph appeared on 4/1/2013. Click here.
View all notes |
Alert me of new notes |
CANSLIM.net Company Profile |
SEC |
Zacks Reports |
StockTalk |
News |
Chart |
Request a new note
C
A N
S L
I M
|
NSR
-
NYSE
Neustar Inc
TELECOMMUNICATIONS - Diversified Communication Serv
|
$43.47
|
-0.98
-2.20% |
$44.86
|
557,470
122.36% of 50 DAV
50 DAV is 455,600
|
$47.24
-7.98%
|
3/8/2013
|
$44.99
|
PP = $47.34
|
|
MB = $49.71
|
Most Recent Note - 4/1/2013 12:20:43 PM
Y - Still consolidating near its 50 DMA line which has acted as support in recent weeks. Its Relative Strength rating has slumped to 77, below the 80+ minimum guideline for buy candidates.
>>> The latest Featured Stock Update with an annotated graph appeared on 3/27/2013. Click here.
View all notes |
Alert me of new notes |
CANSLIM.net Company Profile |
SEC |
Zacks Reports |
StockTalk |
News |
Chart |
Request a new note
C
A N
S L
I M
|
RRTS
-
NYSE
Roadrunner Trans Systems
TRANSPORTATION - Air Delivery and Freight Service
|
$22.80
|
+0.00
0.00% |
$22.86
|
449,053
279.96% of 50 DAV
50 DAV is 160,400
|
$23.71
-3.84%
|
4/3/2013
|
$22.77
|
PP = $23.75
|
|
MB = $24.94
|
Most Recent Note - 4/3/2013 7:39:18 PM
Y - Encountered distributional pressure after highlighted in yellow with new pivot point cited based on its 3/08/13 high plus 10 cents while consolidating in a flat base pattern in the earlier mid-day report. Fundamentals remain strong enough to still satisfy the C and A criteria, however decelerating sales revenues and earnings increases in sequential quarterly comparisons through the Dec '12 quarter is a concern. Completed a new Public Offering on 12/06/12 and, technically, it broke out above previously stubborn resistance in $19 area with volume-driven gains in January. See the latest FSU analysis for more details and a new annotated graph.
>>> The latest Featured Stock Update with an annotated graph appeared on 4/3/2013. Click here.
View all notes |
Alert me of new notes |
CANSLIM.net Company Profile |
SEC |
Zacks Reports |
StockTalk |
News |
Chart |
Request a new note
C
A N
S L
I M
|
Symbol/Exchange
Company Name
Industry Group |
PRICE |
CHANGE
(%Change) |
Day High |
Volume
(% DAV)
(% 50 day avg vol) |
52 Wk Hi
% From Hi |
Featured
Date |
Price
Featured |
Pivot Featured |
|
Max Buy |
SLCA
-
NYSE
U S Silica Holdings Inc
CHEMICALS - Specialty Chemicals
|
$21.39
|
-0.92
-4.12% |
$22.54
|
1,348,751
121.15% of 50 DAV
50 DAV is 1,113,300
|
$28.50
-24.95%
|
2/26/2013
|
$22.23
|
PP = $21.50
|
|
MB = $22.58
|
Most Recent Note - 4/3/2013 7:25:23 PM
Violated its 50 DMA line and recent low ($21.24 on 3/15/13) today with a 3rd consecutive volume-driven loss raising concerns and triggering technical sell signals. Only a prompt rebound above the 50 DMA line would help its outlook improve. Based on technical deterioration it will be dropped from the Featured Stocks list tonight.
>>> The latest Featured Stock Update with an annotated graph appeared on 3/22/2013. Click here.
View all notes |
Alert me of new notes |
CANSLIM.net Company Profile |
SEC |
Zacks Reports |
StockTalk |
News |
Chart |
Request a new note
C
A N
S L
I M
|
VRX
-
NYSE
Valeant Pharmaceuticals
DRUGS - Drug Manufacturers - Other
|
$71.87
|
-3.50
-4.64% |
$76.33
|
6,156,140
490.41% of 50 DAV
50 DAV is 1,255,300
|
$76.56
-6.13%
|
12/20/2012
|
$60.24
|
PP = $61.21
|
|
MB = $64.27
|
Most Recent Note - 4/3/2013 7:22:29 PM
G - Pulled back on heavy volume today after agreeing to an increased offer price of $24.00 cash for it to acquire Obagi Medical Products. The 50 DMA line and recent low ($64.05 on 2/21/13) define important support areas to watch on pullbacks.
>>> The latest Featured Stock Update with an annotated graph appeared on 3/12/2013. Click here.
View all notes |
Alert me of new notes |
CANSLIM.net Company Profile |
SEC |
Zacks Reports |
StockTalk |
News |
Chart |
Request a new note
C
A N
S L
I M
|
|
|
|
THESE ARE NOT BUY RECOMMENDATIONS!
Comments contained in the body of this report are technical
opinions only. The material herein has been obtained
from sources believed to be reliable and accurate, however,
its accuracy and completeness cannot be guaranteed.
This site is not an investment advisor, hence it does
not endorse or recommend any securities or other investments.
Any recommendation contained in this report may not
be suitable for all investors and it is not to be deemed
an offer or solicitation on our part with respect to
the purchase or sale of any securities. All trademarks,
service marks and trade names appearing in this report
are the property of their respective owners, and are
likewise used for identification purposes only.
This report is a service available
only to active Paid Premium Members.
You may opt-out of receiving report notifications
at any time. Questions or comments may be submitted
by writing to Premium Membership Services 665 S.E. 10 Street, Suite 201 Deerfield Beach, FL 33441-5634 or by calling 1-800-965-8307
or 954-785-1121.
|
|
|

