You are not logged in.
This means you
CAN ONLY VIEW reports that were published prior to Monday, April 28, 2025.
You
MUST UPGRADE YOUR MEMBERSHIP if you want to see any current reports.
AFTER MARKET UPDATE - WEDNESDAY, APRIL 2ND, 2014
Previous After Market Report Next After Market Report >>>
|
|
|
|
DOW |
+40.39 |
16,573.00 |
+0.24% |
|
Volume |
640,029,830 |
-8% |
|
Volume |
2,043,773,950 |
+3% |
|
NASDAQ |
+8.42 |
4,276.46 |
+0.20% |
|
Advancers |
1,742 |
55% |
|
Advancers |
1,496 |
54% |
|
S&P 500 |
+5.38 |
1,890.90 |
+0.29% |
|
Decliners |
1,290 |
41% |
|
Decliners |
1,170 |
42% |
|
Russell 2000 |
+4.11 |
1,192.81 |
+0.35% |
|
52 Wk Highs |
184 |
|
|
52 Wk Highs |
123 |
|
|
S&P 600 |
+2.82 |
682.33 |
+0.42% |
|
52 Wk Lows |
1 |
|
|
52 Wk Lows |
18 |
|
|
 |
Major Averages Posted 4th Consecutive Gains
Kenneth J. Gruneisen - Passed the CAN SLIM® Master's Exam
Stocks extended their winning streak to a fourth straight session on Wednesday. The volume totals were reported mixed, higher on the Nasdaq exchange and lighter on the NYSE. Advancers led decliners by a 3-2 margin on the NYSE and 5-4 on the Nasdaq exchange. There were 54 high-ranked companies from the CANSLIM.net Leaders List that made new 52-week highs and appeared on the CANSLIM.net BreakOuts Page, up from the total of 48 stocks on the prior session. The list of stocks hitting new 52-week highs outnumbered new 52-week lows on the NYSE and on the Nasdaq exchange. Gains were posted by 6 of the 9 high-ranked companies currently included on the Featured Stocks Page. The S&P 500 Index's rally for another new all-time high helped signal that the Market (M criteria) has returned to a confirmed uptrend. Investors are reminded only make new buying efforts in issues meeting all key criteria while also trading within the proper technical guidelines.
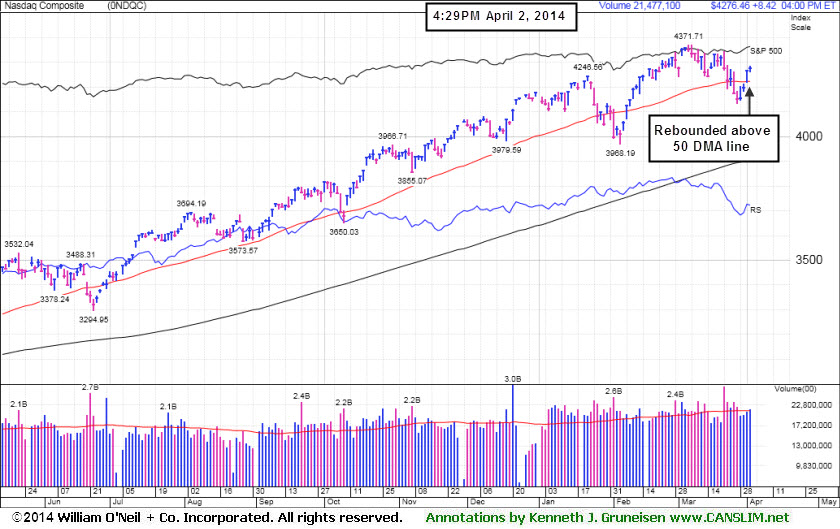 The Dow rose 40 points to 16,573. The S&P 500 climbed 5 points to notch a new all-time high at 1,890. The NASDAQ advanced 8 points to 4,276.
The major averages finished a choppy trading session in positive territory following generally positive updates on the economy. Before the open, the ADP private payrolls survey showed 191,000 were added in March, slightly missing the consensus projection of 195,000. A separate released revealed factory orders unexpectedly grew +1.6% in February compared an expected +1.2% increase.
On the earnings front, Monsanto (MON +0.76%) was higher after posting results above consensus and raising its full-year forecast. Agrium (AGU -1.40%) retreated on its reduced first-quarter earnings guidance.
Nine of 10 sectors in the S&P 500 were up on the session. Materials and industrials were the best performing groups. Caterpillar (CAT +2.83%) putted higher and Newmont Mining (NEM +3.37%) rallied as the price of gold advanced. . Utilities were the lone sector to finish down on the day. Edison International (EIX -1.17%).
Treasuries were down on the session with the 10-year note losing 14/32 to yield 2.80%.
The CANSLIM.net Featured Stocks Page shows the most action-worthy candidates and their latest notes and a Headline Link directs members to the latest detailed analysis with data-packed graphs annotated by a Certified expert along with links to additional resources. The Premium Member Homepage includes "dynamic archives" to all prior pay reports published. Watch for an announcement via email concerning the next WEBCAST.
PICTURED: The Nasdaq Composite Index rebounded above its 50-day moving average (DMA) line.
|
 Kenneth J. Gruneisen started out as a licensed stockbroker in August 1987, a couple of months prior to the historic stock market crash that took the Dow Jones Industrial Average down -22.6% in a single day. He has published daily fact-based fundamental and technical analysis on high-ranked stocks online for two decades. Through FACTBASEDINVESTING.COM, Kenneth provides educational articles, news, market commentary, and other information regarding proven investment systems that work in good times and bad.
Comments contained in the body of this report are technical opinions only and are not necessarily those of Gruneisen Growth Corp. The material herein has been obtained from sources believed to be reliable and accurate, however, its accuracy and completeness cannot be guaranteed. Our firm, employees, and customers may effect transactions, including transactions contrary to any recommendation herein, or have positions in the securities mentioned herein or options with respect thereto. Any recommendation contained in this report may not be suitable for all investors and it is not to be deemed an offer or solicitation on our part with respect to the purchase or sale of any securities. |
|
 |
Retail, Broker/Dealer, and Commodity-Linked Groups Rose
Kenneth J. Gruneisen - Passed the CAN SLIM® Master's Exam
The Retail Index ($RLX +0.67%) rose on Wednesday and the Broker/Dealer Index ($XBD +0.80%) was also a positive influence while the Bank Index ($BKX +0.01%) finished flat. Energy-related shares had a slightly positive bias as the Integrated Oil Index ($XOI +0.25%) and the Oil Services Index ($OSX +0.37%) posted modest gains. The Networking Index ($NWX +0.57%) led the tech sector with a modest gain and the Biotechnology Index ($BTK +0.36%) also edged higher, meanwhile the Semiconductor Index ($SOX -0.16%) ended slightly lower. The Gold & Silver Index ($XAU +2.17%) was a standout gainer.
Charts courtesy www.stockcharts.com
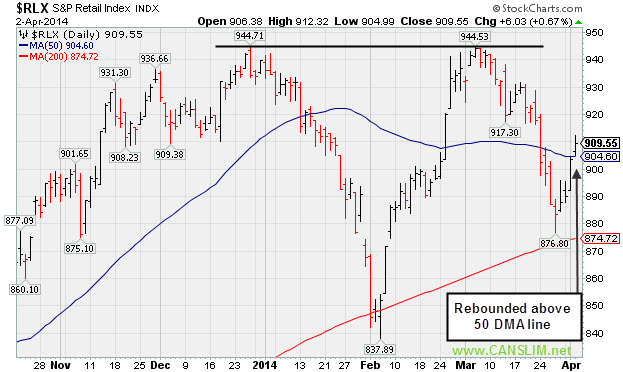
PICTURED: The Retail Index ($RLX +0.67%) met resistance in March near its Dec '13 highs then slumped badly. The longer-term 200-day moving average acted as support during the deep consolidation. Wednesday it rebounded back above its 50-day moving average (DMA) line with its 4th consecutive gain.
| Oil Services |
$OSX |
291.79 |
+1.09 |
+0.37% |
+3.83% |
| Integrated Oil |
$XOI |
1,526.63 |
+3.84 |
+0.25% |
+1.56% |
| Semiconductor |
$SOX |
594.94 |
-0.97 |
-0.16% |
+11.20% |
| Networking |
$NWX |
348.00 |
+1.99 |
+0.57% |
+7.43% |
| Broker/Dealer |
$XBD |
163.80 |
+1.30 |
+0.80% |
+2.02% |
| Retail |
$RLX |
909.55 |
+6.03 |
+0.67% |
-3.22% |
| Gold & Silver |
$XAU |
93.53 |
+1.99 |
+2.17% |
+11.15% |
| Bank |
$BKX |
72.67 |
+0.01 |
+0.01% |
+4.92% |
| Biotech |
$BTK |
2,659.28 |
+9.54 |
+0.36% |
+14.11% |
|
|
|
 |
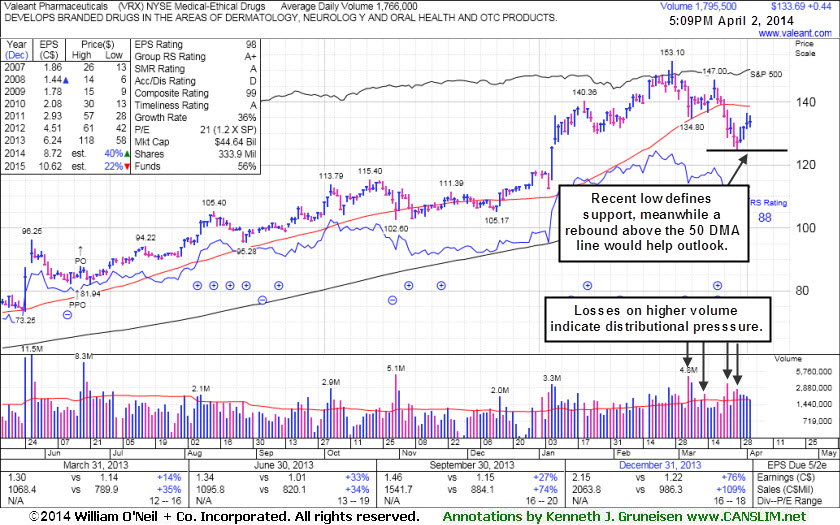
After Damaging Losses a Rebound Above 50 DMA Line is Needed
Kenneth J. Gruneisen - Passed the CAN SLIM® Master's Exam
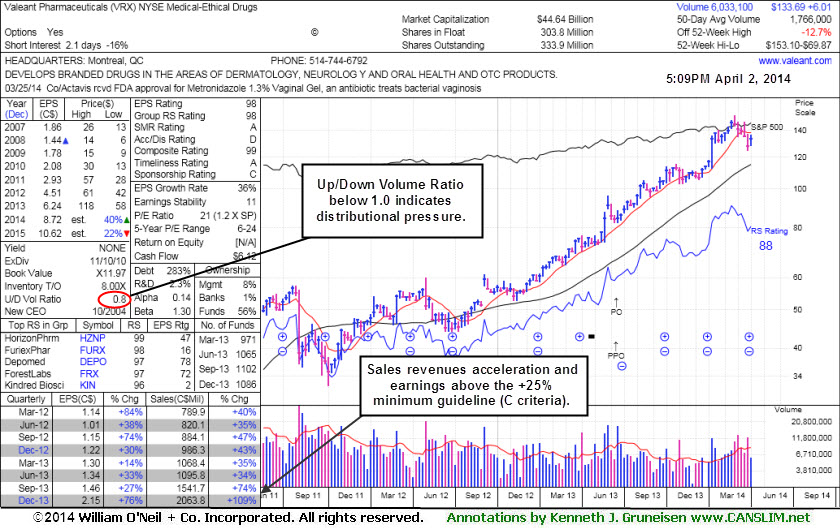
Valeant Pharmaceuticals International, Inc (VRX +$0.44 or +0.33% to $133.69) is still consolidating below its 50-day moving average (DMA) line after recent damaging losses triggered a technical sell signal. Its current Up/Down Volume Ratio of 0.8 is an unbiased indication its shares have faced distributional pressure over the past 50 days. VRX was last shown in this FSU section on 3/17/14 with annotated daily and weekly graphs under the headline, "Finding Support Above 50-Day Moving Average Line". A prompt rebound above the 50 DMA line is needed to help its outlook improve. Subsequent deterioration below the recent low ($124.67 on 3/27/14) would raise more serious concerns and trigger additional sell signals. Meanwhile, patient investors may watch for improvement and wait for a new sound base to possibly develop and be noted in the future.
It reported better than expected Dec '13 quarterly results with earnings +76% on +109% sales revenues, above the +25% minimum guideline (C criteria). A downturn in FY '07 and '08 earnings (A criteria) was been followed by a strong earnings rebound in recent years.
The number of top-rated funds owning its shares rose from 818 in Mar '12 in to 1,086 in Dec '13, a reassuring trend concerning the I criteria. The high-ranked Medical - Ethical Drugs firm completed Public Offering on 6/18/13. The upshot of Public Offerings is that when completed the end result is typically an increase in the total number of institutional owners. Institutional owners are often supportive of their existing positions and will even accumulate more shares when they consolidate near classic support levels like the 50-day and 200-day moving average (DMA) lines, if they are still believers in the company. If too many become pessimistic and decide to unload, this is what ends up sending the stocks slicing through support.
|
|
|
Color Codes Explained :
Y - Better candidates highlighted by our
staff of experts.
G - Previously featured
in past reports as yellow but may no longer be buyable under the
guidelines.
***Last / Change / Volume data in this table is the closing quote data***
Symbol/Exchange
Company Name
Industry Group |
PRICE |
CHANGE
(%Change) |
Day High |
Volume
(% DAV)
(% 50 day avg vol) |
52 Wk Hi
% From Hi |
Featured
Date |
Price
Featured |
Pivot Featured |
|
Max Buy |
EQM
-
NYSE
E Q T Midstream Partners
ENERGY - Oil and Gas Pipelines
|
$71.48
|
-0.30
-0.42% |
$73.43
|
195,461
174.52% of 50 DAV
50 DAV is 112,000
|
$71.79
-0.43%
|
12/12/2013
|
$53.17
|
PP = $56.51
|
|
MB = $59.34
|
 Most Recent Note - 4/2/2014 12:48:26 PM
G - Hitting yet another new high with today's 4th consecutive gain. Held its ground since reporting earnings -2% on +22% sales revenues for the Dec '13 quarter, below the +25% minimum earnings guideline (C criteria), raising fundamental concerns. Its 50 DMA line defines near-term support where a violation may trigger a technical sell signal.
>>> FEATURED STOCK ARTICLE : Hit New Highs But Fundamental Concerns Remain - 3/21/2014
View all notes |
Set NEW NOTE alert |
CANSLIM.net Company Profile |
SEC
News |
Chart |
Request a new note
C
A N
S L
I M


|
FB
-
NASDAQ
Facebook Inc Cl A
INTERNET
|
$62.72
|
+0.10
0.16% |
$63.91
|
66,144,712
106.53% of 50 DAV
50 DAV is 62,091,000
|
$72.59
-13.60%
|
12/12/2013
|
$51.40
|
PP = $54.93
|
|
MB = $57.68
|
Most Recent Note - 4/1/2014 5:55:22 PM
G - Still sputtering below its 50 DMA line after damaging losses. A rebound above that important short-term average is needed to help its outlook improve.
>>> FEATURED STOCK ARTICLE : 50-Day Moving Average Violation Triggered Technical Sell Signal - 3/28/2014
View all notes |
Set NEW NOTE alert |
CANSLIM.net Company Profile |
SEC
News |
Chart |
Request a new note
C
A N
S L
I M
|
FLT
-
NYSE
Fleetcor Technologies
DIVERSIFIED SERVICES - Business/Management Services
|
$117.19
|
-0.49
-0.42% |
$118.35
|
458,965
39.91% of 50 DAV
50 DAV is 1,150,000
|
$132.22
-11.37%
|
3/5/2014
|
$125.40
|
PP = $124.06
|
|
MB = $130.26
|
Most Recent Note - 4/2/2014 1:24:23 PM
G - Consolidating near its 50 DMA line today after recently slumping back into its prior base. Relative Strength rating has slumped to 77, below the 80+ minimum guideline for buy candidates.
>>> FEATURED STOCK ARTICLE : Negated Recent Breakout and Testing Support at 50-Day Average - 3/24/2014
View all notes |
Set NEW NOTE alert |
CANSLIM.net Company Profile |
SEC
News |
Chart |
Request a new note
C
A N
S L
I M
|
GNRC
-
NYSE
Generac Hldgs Inc
Electrical-Power/Equipmt
|
$60.36
|
+1.10
1.86% |
$60.56
|
673,233
76.33% of 50 DAV
50 DAV is 882,000
|
$62.50
-3.42%
|
2/14/2014
|
$56.50
|
PP = $57.39
|
|
MB = $60.26
|
Most Recent Note - 4/2/2014 5:38:46 PM
Y - Posted a 4th consecutive gain today with below average but increasing volume after finding support above prior highs in the $57 area again. More damaging losses below its recent low ($56.38 on 3/27/14) would raise greater concerns.
>>> FEATURED STOCK ARTICLE : Perched Near Highs With Mostly Quiet Volume Totals - 3/31/2014
View all notes |
Set NEW NOTE alert |
CANSLIM.net Company Profile |
SEC
News |
Chart |
Request a new note
C
A N
S L
I M
|
ICON
-
NASDAQ
Iconix Brand Group Inc
CONSUMER NON-DURABLES - Textile - Apparel Footwear
|
$40.23
|
+0.48
1.21% |
$40.31
|
981,933
158.63% of 50 DAV
50 DAV is 619,000
|
$42.47
-5.27%
|
3/7/2014
|
$41.46
|
PP = $40.88
|
|
MB = $42.92
|
Most Recent Note - 4/2/2014 5:37:33 PM
Y - Rallied on higher volume today, climbing back above prior highs in the $40 area after finding prompt support at its 50 DMA line. Further deterioration would raise greater concerns and trigger technical sell signals.
>>> FEATURED STOCK ARTICLE : Falling Back Under Prior Highs Raises Concerns - 3/25/2014
View all notes |
Set NEW NOTE alert |
CANSLIM.net Company Profile |
SEC
News |
Chart |
Request a new note
C
A N
S L
I M
|
Symbol/Exchange
Company Name
Industry Group |
PRICE |
CHANGE
(%Change) |
Day High |
Volume
(% DAV)
(% 50 day avg vol) |
52 Wk Hi
% From Hi |
Featured
Date |
Price
Featured |
Pivot Featured |
|
Max Buy |
KORS
-
NYSE
Michael Kors Hldgs Ltd
RETAIL - Apparel Stores
|
$95.03
|
-0.22
-0.23% |
$96.10
|
1,382,699
43.30% of 50 DAV
50 DAV is 3,193,000
|
$101.04
-5.95%
|
3/12/2014
|
$98.03
|
PP = $101.14
|
|
MB = $106.20
|
Most Recent Note - 4/1/2014 6:03:42 PM
Y - Color code is changed to yellow after finding prompt support at its 50 DMA line. More damaging losses below the 50 DMA line and recent lows would raise greater concerns and trigger technical sell signals.
>>> FEATURED STOCK ARTICLE : Fell Below 50-Day Average Line With 6th Consecutive Loss - 3/27/2014
View all notes |
Set NEW NOTE alert |
CANSLIM.net Company Profile |
SEC
News |
Chart |
Request a new note
C
A N
S L
I M
|
PSIX
-
NASDAQ
Power Solutions Intl Inc
Machinery-Gen Industrial
|
$78.67
|
+1.74
2.26% |
$81.39
|
68,410
99.14% of 50 DAV
50 DAV is 69,000
|
$87.40
-9.99%
|
2/28/2014
|
$74.65
|
PP = $76.93
|
|
MB = $80.78
|
Most Recent Note - 4/2/2014 5:35:09 PM
Y - Color code is changed to yellow after a 4th consecutive gain today, rising back above its pivot point to within close striking distance of its 52-week high. Found prompt support at its 50 DMA line last week.
>>> FEATURED STOCK ARTICLE : Found Prompt Support Near 50-Day Average After Dip Back Into Prior Base - 4/1/2014
View all notes |
Set NEW NOTE alert |
CANSLIM.net Company Profile |
SEC
News |
Chart |
Request a new note
C
A N
S L
I M
|
SILC
-
NASDAQ
Silicom Ltd
COMPUTER HARDWARE - Networking andamp; Communication Dev
|
$62.26
|
+0.08
0.13% |
$62.69
|
31,330
31.33% of 50 DAV
50 DAV is 100,000
|
$73.44
-15.22%
|
12/23/2013
|
$44.62
|
PP = $46.25
|
|
MB = $48.56
|
Most Recent Note - 4/2/2014 5:40:35 PM
G - Posted a 3rd consecutive gain today with lighter and below average volume while still sputtering below its 50 DMA line following a damaging volume-driven loss last week. Only a prompt rebound above that important short-term average would help its outlook improve.
>>> FEATURED STOCK ARTICLE : Traded Up +64.6% in Under 3 Months Since Featured in Mid-Day Report - 3/20/2014
View all notes |
Set NEW NOTE alert |
CANSLIM.net Company Profile |
SEC
News |
Chart |
Request a new note
C
A N
S L
I M
|
VRX
-
NYSE
Valeant Pharmaceuticals
DRUGS - Drug Manufacturers - Other
|
$133.69
|
+0.44
0.33% |
$135.83
|
1,796,094
101.70% of 50 DAV
50 DAV is 1,766,000
|
$153.10
-12.68%
|
9/11/2013
|
$100.26
|
PP = $105.50
|
|
MB = $110.78
|
Most Recent Note - 4/2/2014 5:31:49 PM
G- Rebounded toward its 50 DMA line with today's 4th consecutive gain. A rally back above the 50 DMA line is needed to help its outlook improve. See the latest FSU analysis for more details and new annotated graphs.
>>> FEATURED STOCK ARTICLE : After Damaging Losses a Rebound Above 50 DMA Line is Needed - 4/2/2014
View all notes |
Set NEW NOTE alert |
CANSLIM.net Company Profile |
SEC
News |
Chart |
Request a new note
C
A N
S L
I M
|
|
|
|
THESE ARE NOT BUY RECOMMENDATIONS!
Comments contained in the body of this report are technical
opinions only. The material herein has been obtained
from sources believed to be reliable and accurate, however,
its accuracy and completeness cannot be guaranteed.
This site is not an investment advisor, hence it does
not endorse or recommend any securities or other investments.
Any recommendation contained in this report may not
be suitable for all investors and it is not to be deemed
an offer or solicitation on our part with respect to
the purchase or sale of any securities. All trademarks,
service marks and trade names appearing in this report
are the property of their respective owners, and are
likewise used for identification purposes only.
This report is a service available
only to active Paid Premium Members.
You may opt-out of receiving report notifications
at any time. Questions or comments may be submitted
by writing to Premium Membership Services 665 S.E. 10 Street, Suite 201 Deerfield Beach, FL 33441-5634 or by calling 1-800-965-8307
or 954-785-1121.
|
|
|

