You are not logged in.
This means you
CAN ONLY VIEW reports that were published prior to Tuesday, April 15, 2025.
You
MUST UPGRADE YOUR MEMBERSHIP if you want to see any current reports.
AFTER MARKET UPDATE - TUESDAY, APRIL 1ST, 2014
Previous After Market Report Next After Market Report >>>
|
|
|
|
DOW |
+74.95 |
16,532.61 |
+0.46% |
|
Volume |
695,692,650 |
-17% |
|
Volume |
1,988,597,710 |
+5% |
|
NASDAQ |
+69.05 |
4,268.04 |
+1.64% |
|
Advancers |
2,219 |
70% |
|
Advancers |
2,095 |
74% |
|
S&P 500 |
+13.18 |
1,885.52 |
+0.70% |
|
Decliners |
868 |
27% |
|
Decliners |
652 |
23% |
|
Russell 2000 |
+15.66 |
1,188.70 |
+1.34% |
|
52 Wk Highs |
158 |
|
|
52 Wk Highs |
113 |
|
|
S&P 600 |
+8.39 |
679.51 |
+1.25% |
|
52 Wk Lows |
6 |
|
|
52 Wk Lows |
24 |
|
|
 |
Confirmed Uptrend Resumes as S&P 500 Index Hits New All-Time Highs
Kenneth J. Gruneisen - Passed the CAN SLIM® Master's Exam
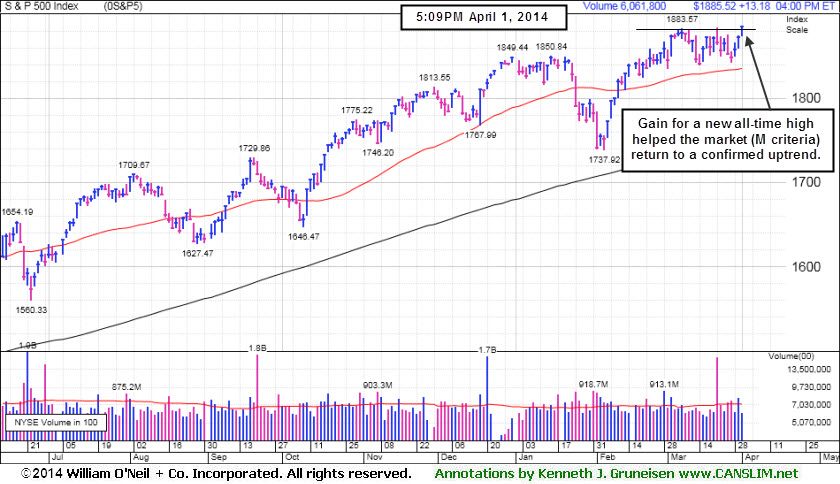
Stocks started the second-quarter on a positive note. The Dow rose 75 points to 16,532. The S&P 500 added 13 points to close at a new all-time high at 1,885. The NASDAQ climbed 69 points to 4,268. The volume totals were reported higher on the Nasdaq exchange and on the NYSE, a reassuring sign of institutional accumulation. Advancers led decliners by about an 11-4 margin on the NYSE and 3-1 on the Nasdaq exchange. There were 48 high-ranked companies from the CANSLIM.net Leaders List that made new 52-week highs and appeared on the CANSLIM.net BreakOuts Page, up from the total of 28 stocks on the prior session. The list of stocks hitting new 52-week highs outnumbered new 52-week lows on the NYSE and on the Nasdaq exchange. Gains were posted by all 9 high-ranked companies currently included on the Featured Stocks Page. The S&P 500 Index's rally for a new all-time high helped signal that the Market (M criteria) has returned to a confirmed uptrend. Investors are reminded only make new buying efforts in issues meeting all key criteria while also trading within the proper technical guidelines.
 The major averages advanced for a third straight session encouraged by the latest economic data. Shortly after the open, the ISM reported manufacturing activity rose in March suggesting a recovery by the industry after the tough winter conditions. A separate release revealed construction spending unexpectedly grew +0.1% in February.
Nine of 10 sectors in the S&P 500 were up on the session led by technology firms including Cisco Systems (CSCO +3.06%) and consumer discretionary issues like TripAdvisor (TRIP +5.48%). Automaker Ford (F +4.62%) rose after posting better-than-expected March sales figures. General Motors (GM +0.23%) edged higher as its CEO testified before Congress related to its problems with defective ignition switches. Intuitive Surgical (ISRG +12.7%) was the biggest gainer in the S&P 500 on the FDA approving its new robotic surgery system. Utilities were the lone sector to finish in negative territory with PG&E (PCG -1.9%) leading the group lower.
Treasuries declined with the 10-year note down 10/32 to yield 2.76%.
The CANSLIM.net Featured Stocks Page shows the most action-worthy candidates and their latest notes and a Headline Link directs members to the latest detailed analysis with data-packed graphs annotated by a Certified expert along with links to additional resources. The Premium Member Homepage includes "dynamic archives" to all prior pay reports published. Watch for an announcement via email concerning the next WEBCAST.
PICTURED: The S&P 500 Index rallied for a new all-time high, helping the market return to a "confirmed uptrend".
|
 Kenneth J. Gruneisen started out as a licensed stockbroker in August 1987, a couple of months prior to the historic stock market crash that took the Dow Jones Industrial Average down -22.6% in a single day. He has published daily fact-based fundamental and technical analysis on high-ranked stocks online for two decades. Through FACTBASEDINVESTING.COM, Kenneth provides educational articles, news, market commentary, and other information regarding proven investment systems that work in good times and bad.
Comments contained in the body of this report are technical opinions only and are not necessarily those of Gruneisen Growth Corp. The material herein has been obtained from sources believed to be reliable and accurate, however, its accuracy and completeness cannot be guaranteed. Our firm, employees, and customers may effect transactions, including transactions contrary to any recommendation herein, or have positions in the securities mentioned herein or options with respect thereto. Any recommendation contained in this report may not be suitable for all investors and it is not to be deemed an offer or solicitation on our part with respect to the purchase or sale of any securities. |
|
 |
Tech, Retail, Financial, and Commodity-Linked Groups Rose
Kenneth J. Gruneisen - Passed the CAN SLIM® Master's Exam
The tech sector helped lead the market rally as the Semiconductor Index ($SOX +1.56%), Networking Index ($NWX +2.13%), and the Biotechnology Index ($BTK +2.41%) tallied solid gains on Tuesday. The Retail Index ($RLX +1.52%) rose and it was a positive influence on the major averages along with financial shares as the Broker/Dealer Index ($XBD +1.39%) and the Bank Index ($BKX +0.51%) posted gains. Commodity-linked groups also traded higher as the Oil Services Index ($OSX +0.65%) and the Integrated Oil Index ($XOI +0.92%) outpaced the Gold & Silver Index ($XAU +0.37%).
Charts courtesy www.stockcharts.com
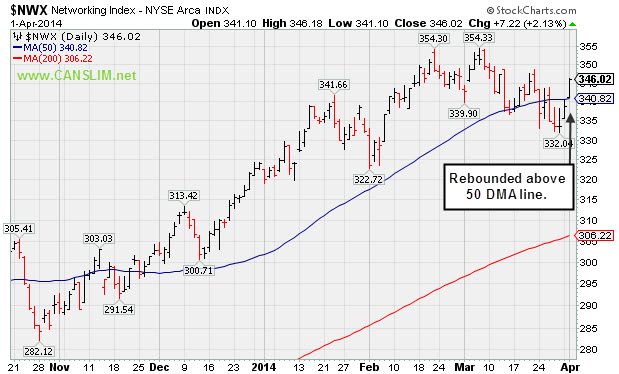
PICTURED: The Networking Index ($NWX +2.13%) rebounded above its 50-day moving average (DMA) line with a solid gain.
| Oil Services |
$OSX |
290.70 |
+1.87 |
+0.65% |
+3.44% |
| Integrated Oil |
$XOI |
1,522.79 |
+13.85 |
+0.92% |
+1.31% |
| Semiconductor |
$SOX |
595.91 |
+9.17 |
+1.56% |
+11.38% |
| Networking |
$NWX |
346.02 |
+7.22 |
+2.13% |
+6.82% |
| Broker/Dealer |
$XBD |
162.51 |
+2.23 |
+1.39% |
+1.21% |
| Retail |
$RLX |
903.52 |
+13.55 |
+1.52% |
-3.86% |
| Gold & Silver |
$XAU |
91.54 |
+0.34 |
+0.37% |
+8.78% |
| Bank |
$BKX |
72.66 |
+0.37 |
+0.51% |
+4.91% |
| Biotech |
$BTK |
2,648.56 |
+62.31 |
+2.41% |
+13.65% |
|
|
|
 |
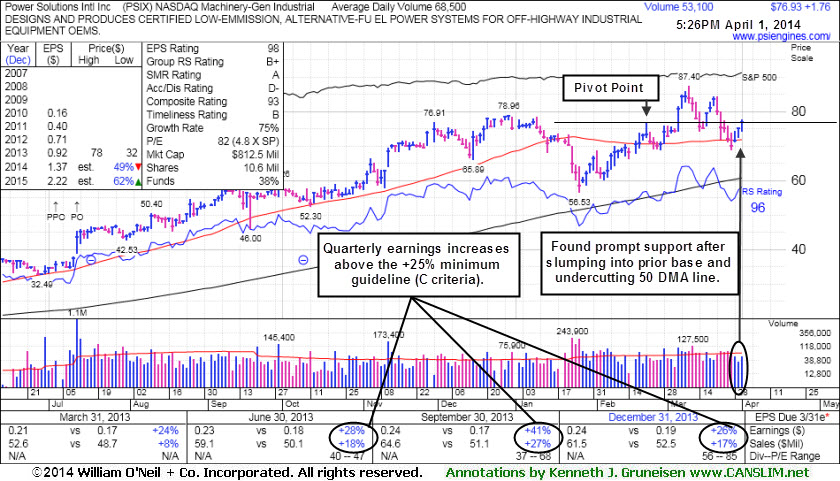
Found Prompt Support Near 50-Day Average After Dip Back Into Prior Base
Kenneth J. Gruneisen - Passed the CAN SLIM® Master's Exam
Power Solutions Int'l Inc (PSIX +$1.76 or +2.34% to $76.93) is consolidating just above its 50-day moving average (DMA) line after halting its latest slide near that important short-term average. The high-ranked firm from the Machinery - General Industrial group was last shown in this FSU section on 3/18/14 with annotated graphs under the headline, "Halted Slide After Undercutting Prior Highs on Pullback". Afterward it slumped well below prior highs in the $78 area raising concerns while completely negating the recent breakout. Disciplined investors avoid chasing stocks more than +5% above prior highs and always sell if any stock falls more than -7% from their purchase price.
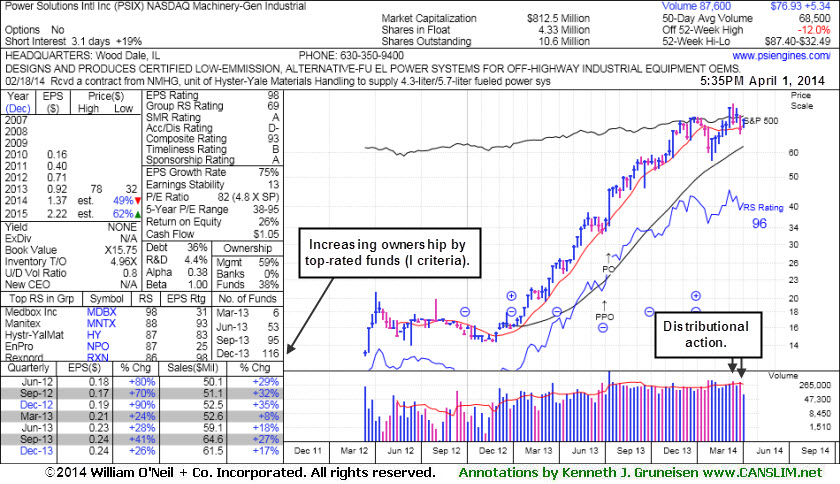
PSIX was highlighted in yellow with a pivot point cited based on its 2/21/14 high in the 2/28/14 mid-day report (read here). It stalled shortly after its 3/06/14 technical breakout having made only a little headway into new high territory. It reported earnings +26% on +17% sales revenues for the Dec '13 quarter, its 3rd consecutive quarter with earnings above the +25% minimum guideline (C criteria). The number of top-rated funds owning its shares rose from 6 in Mar '13 to 116 in Dec '13, a reassuring trend concerning the I criteria. The small supply of only 4.33 million shares (S criteria) can contribute to greater price volatility in the event of institutional buying or selling. Additional leadership in the Machinery - General Industrial group (L criteria) is reassuring.
|
|
|
Color Codes Explained :
Y - Better candidates highlighted by our
staff of experts.
G - Previously featured
in past reports as yellow but may no longer be buyable under the
guidelines.
***Last / Change / Volume data in this table is the closing quote data***
Symbol/Exchange
Company Name
Industry Group |
PRICE |
CHANGE
(%Change) |
Day High |
Volume
(% DAV)
(% 50 day avg vol) |
52 Wk Hi
% From Hi |
Featured
Date |
Price
Featured |
Pivot Featured |
|
Max Buy |
EQM
-
NYSE
E Q T Midstream Partners
ENERGY - Oil and Gas Pipelines
|
$71.78
|
+1.45
2.06% |
$71.79
|
97,410
87.76% of 50 DAV
50 DAV is 111,000
|
$70.89
1.26%
|
12/12/2013
|
$53.17
|
PP = $56.51
|
|
MB = $59.34
|
Most Recent Note - 3/28/2014 12:21:50 PM
G - Inching further into new high territory with today's gain. Held its ground since reporting earnings -2% on +22% sales revenues for the Dec '13 quarter, below the +25% minimum earnings guideline (C criteria), raising fundamental concerns. Its 50 DMA line defines near-term support where a violation may trigger a technical sell signal.
>>> FEATURED STOCK ARTICLE : Hit New Highs But Fundamental Concerns Remain - 3/21/2014
View all notes |
Set NEW NOTE alert |
CANSLIM.net Company Profile |
SEC
News |
Chart |
Request a new note
C
A N
S L
I M


|
FB
-
NASDAQ
Facebook Inc Cl A
INTERNET
|
$62.62
|
+2.38
3.95% |
$62.66
|
59,112,975
95.77% of 50 DAV
50 DAV is 61,723,000
|
$72.59
-13.73%
|
12/12/2013
|
$51.40
|
PP = $54.93
|
|
MB = $57.68
|
 Most Recent Note - 4/1/2014 5:55:22 PM
G - Still sputtering below its 50 DMA line after damaging losses. A rebound above that important short-term average is needed to help its outlook improve.
>>> FEATURED STOCK ARTICLE : 50-Day Moving Average Violation Triggered Technical Sell Signal - 3/28/2014
View all notes |
Set NEW NOTE alert |
CANSLIM.net Company Profile |
SEC
News |
Chart |
Request a new note
C
A N
S L
I M
|
FLT
-
NYSE
Fleetcor Technologies
DIVERSIFIED SERVICES - Business/Management Services
|
$117.68
|
+2.58
2.24% |
$117.83
|
822,965
71.07% of 50 DAV
50 DAV is 1,157,900
|
$132.22
-11.00%
|
3/5/2014
|
$125.40
|
PP = $124.06
|
|
MB = $130.26
|
Most Recent Note - 3/26/2014 5:56:18 PM
G - Failing to find support, it quietly has slumped below its 50 DMA line and its color code is changed to green. Relative Strength rating has slumped to 75, below the 80+ minimum guideline for buy candidates.
>>> FEATURED STOCK ARTICLE : Negated Recent Breakout and Testing Support at 50-Day Average - 3/24/2014
View all notes |
Set NEW NOTE alert |
CANSLIM.net Company Profile |
SEC
News |
Chart |
Request a new note
C
A N
S L
I M
|
GNRC
-
NYSE
Generac Hldgs Inc
Electrical-Power/Equipmt
|
$59.26
|
+0.29
0.49% |
$59.28
|
470,517
51.54% of 50 DAV
50 DAV is 913,000
|
$62.50
-5.18%
|
2/14/2014
|
$56.50
|
PP = $57.39
|
|
MB = $60.26
|
Most Recent Note - 3/31/2014 7:00:27 PM
Y - Posted a 2nd consecutive gain today with below average volume after finding support above prior highs in the $57 area again. More damaging losses would raise greater concerns.See the latest FSU analysis for more details and new annotated graphs.
>>> FEATURED STOCK ARTICLE : Perched Near Highs With Mostly Quiet Volume Totals - 3/31/2014
View all notes |
Set NEW NOTE alert |
CANSLIM.net Company Profile |
SEC
News |
Chart |
Request a new note
C
A N
S L
I M
|
ICON
-
NASDAQ
Iconix Brand Group Inc
CONSUMER NON-DURABLES - Textile - Apparel Footwear
|
$39.75
|
+0.48
1.22% |
$39.81
|
700,200
113.69% of 50 DAV
50 DAV is 615,900
|
$42.47
-6.40%
|
3/7/2014
|
$41.46
|
PP = $40.88
|
|
MB = $42.92
|
Most Recent Note - 4/1/2014 5:59:07 PM
Y - Sputtering below prior highs in the $40 area and finding support near its 50 DMA line today after 5 consecutive losses. Further deterioration would raise greater concerns and trigger technical sell signals.
>>> FEATURED STOCK ARTICLE : Falling Back Under Prior Highs Raises Concerns - 3/25/2014
View all notes |
Set NEW NOTE alert |
CANSLIM.net Company Profile |
SEC
News |
Chart |
Request a new note
C
A N
S L
I M
|
Symbol/Exchange
Company Name
Industry Group |
PRICE |
CHANGE
(%Change) |
Day High |
Volume
(% DAV)
(% 50 day avg vol) |
52 Wk Hi
% From Hi |
Featured
Date |
Price
Featured |
Pivot Featured |
|
Max Buy |
KORS
-
NYSE
Michael Kors Hldgs Ltd
RETAIL - Apparel Stores
|
$95.25
|
+1.98
2.12% |
$95.32
|
1,864,624
57.07% of 50 DAV
50 DAV is 3,267,000
|
$101.04
-5.73%
|
3/12/2014
|
$98.03
|
PP = $101.14
|
|
MB = $106.20
|
Most Recent Note - 4/1/2014 6:03:42 PM
Y - Color code is changed to yellow after finding prompt support at its 50 DMA line. More damaging losses below the 50 DMA line and recent lows would raise greater concerns and trigger technical sell signals.
>>> FEATURED STOCK ARTICLE : Fell Below 50-Day Average Line With 6th Consecutive Loss - 3/27/2014
View all notes |
Set NEW NOTE alert |
CANSLIM.net Company Profile |
SEC
News |
Chart |
Request a new note
C
A N
S L
I M
|
PSIX
-
NASDAQ
Power Solutions Intl Inc
Machinery-Gen Industrial
|
$76.93
|
+1.76
2.34% |
$77.74
|
53,208
78.25% of 50 DAV
50 DAV is 68,000
|
$87.40
-11.98%
|
2/28/2014
|
$74.65
|
PP = $76.93
|
|
MB = $80.78
|
Most Recent Note - 3/31/2014 6:55:27 PM
G - Consolidating just above its 50 DMA line after halting its latest slide near that important short-term average.
>>> FEATURED STOCK ARTICLE : Found Prompt Support Near 50-Day Average After Dip Back Into Prior Base - 4/1/2014
View all notes |
Set NEW NOTE alert |
CANSLIM.net Company Profile |
SEC
News |
Chart |
Request a new note
C
A N
S L
I M
|
SILC
-
NASDAQ
Silicom Ltd
COMPUTER HARDWARE - Networking andamp; Communication Dev
|
$62.18
|
+1.14
1.87% |
$63.91
|
47,088
47.56% of 50 DAV
50 DAV is 99,000
|
$73.44
-15.33%
|
12/23/2013
|
$44.62
|
PP = $46.25
|
|
MB = $48.56
|
Most Recent Note - 3/31/2014 6:56:29 PM
G - Still sputtering below its 50 DMA line following a damaging volume-driven loss last week. Only a prompt rebound above that important short-term average would help its outlook improve.
>>> FEATURED STOCK ARTICLE : Traded Up +64.6% in Under 3 Months Since Featured in Mid-Day Report - 3/20/2014
View all notes |
Set NEW NOTE alert |
CANSLIM.net Company Profile |
SEC
News |
Chart |
Request a new note
C
A N
S L
I M
|
VRX
-
NYSE
Valeant Pharmaceuticals
DRUGS - Drug Manufacturers - Other
|
$133.25
|
+1.42
1.08% |
$136.43
|
2,060,264
116.33% of 50 DAV
50 DAV is 1,771,000
|
$153.10
-12.97%
|
9/11/2013
|
$100.26
|
PP = $105.50
|
|
MB = $110.78
|
Most Recent Note - 3/31/2014 6:57:44 PM
G- Still consolidating below its 50 DMA line after damaging losses triggered a technical sell signal. A rebound above the 50 DMA line is needed to help its outlook improve.
>>> FEATURED STOCK ARTICLE : Finding Support Above 50-Day Moving Average Line - 3/17/2014
View all notes |
Set NEW NOTE alert |
CANSLIM.net Company Profile |
SEC
News |
Chart |
Request a new note
C
A N
S L
I M
|
|
|
|
THESE ARE NOT BUY RECOMMENDATIONS!
Comments contained in the body of this report are technical
opinions only. The material herein has been obtained
from sources believed to be reliable and accurate, however,
its accuracy and completeness cannot be guaranteed.
This site is not an investment advisor, hence it does
not endorse or recommend any securities or other investments.
Any recommendation contained in this report may not
be suitable for all investors and it is not to be deemed
an offer or solicitation on our part with respect to
the purchase or sale of any securities. All trademarks,
service marks and trade names appearing in this report
are the property of their respective owners, and are
likewise used for identification purposes only.
This report is a service available
only to active Paid Premium Members.
You may opt-out of receiving report notifications
at any time. Questions or comments may be submitted
by writing to Premium Membership Services 665 S.E. 10 Street, Suite 201 Deerfield Beach, FL 33441-5634 or by calling 1-800-965-8307
or 954-785-1121.
|
|
|

