***Last / Change / Volume data in this table is the closing quote data***
Symbol/Exchange
Company Name
Industry Group |
PRICE |
CHANGE
(%Change) |
Day High |
Volume
(% DAV)
(% 50 day avg vol) |
52 Wk Hi
% From Hi |
Featured
Date |
Price
Featured |
Pivot Featured |
|
Max Buy |
AMBA
-
NASDAQ
Ambarella Inc
ELECTRONICS - Semiconductor - Specialized
|
$14.87
|
-0.79
-5.04% |
$16.00
|
795,199
292.35% of 50 DAV
50 DAV is 272,000
|
$15.91
-6.54%
|
3/26/2013
|
$15.31
|
PP = $14.83
|
|
MB = $15.57
|
 Most Recent Note - 4/1/2013 11:58:31 AM
Y - Gapped up today and touched a new 52-week high then reversed into the red. Rallied above its pivot point with a considerable gain backed by 5 times average volume on 3/26/13 triggering a technical buy signal from a cup-with-high-handle base. See the latest FSU analysis for more details and a new annotated graph.
>>> The latest Featured Stock Update with an annotated graph appeared on 3/26/2013. Click here.
View all notes |
Alert me of new notes |
CANSLIM.net Company Profile |
SEC |
Zacks Reports |
StockTalk |
News |
Chart |
Request a new note
C
A N
S L
I M


|
CELG
-
NASDAQ
Celgene Corp
DRUGS - Drug Manufacturers - Major
|
$117.04
|
+1.13
0.97% |
$117.94
|
2,536,052
75.64% of 50 DAV
50 DAV is 3,352,600
|
$116.95
0.08%
|
3/27/2013
|
$113.24
|
PP = $115.54
|
|
MB = $121.32
|
Most Recent Note - 3/28/2013 6:05:26 PM
Y - It wedged to new highs from an advanced "3-weeks tight" base with only average volume behind its gain today above the new pivot point cited based on its 3/14/13 high plus 10 cents. See the latest FSU analysis for more details and a new annotated weekly graph.
>>> The latest Featured Stock Update with an annotated graph appeared on 3/28/2013. Click here.
View all notes |
Alert me of new notes |
CANSLIM.net Company Profile |
SEC |
Zacks Reports |
StockTalk |
News |
Chart |
Request a new note
C
A N
S L
I M
|
CFNL
-
NASDAQ
Cardinal Financial Corp
BANKING - Regional - Southeast Banks
|
$17.70
|
-0.48
-2.64% |
$18.33
|
282,537
133.08% of 50 DAV
50 DAV is 212,300
|
$18.40
-3.80%
|
3/22/2013
|
$17.99
|
PP = $18.29
|
|
MB = $19.20
|
Most Recent Note - 3/28/2013 2:36:56 PM
Y - Inched higher with small gains lacking great volume conviction since forming the previously noted advanced "3-weeks tight" base. Gains above the pivot point must have at least the bare minimum +40% above average volume, preferably more, to trigger a proper new (or add-on) technical buy signal.
>>> The latest Featured Stock Update with an annotated graph appeared on 3/18/2013. Click here.
View all notes |
Alert me of new notes |
CANSLIM.net Company Profile |
SEC |
Zacks Reports |
StockTalk |
News |
Chart |
Request a new note
C
A N
S L
I M
|
CMCSA
-
NASDAQ
Comcast Corp Cl A
MEDIA - CATV Systems
|
$41.38
|
-0.41
-0.97% |
$42.07
|
10,038,762
70.37% of 50 DAV
50 DAV is 14,265,300
|
$42.01
-1.50%
|
12/3/2012
|
$37.08
|
PP = $38.06
|
|
MB = $39.96
|
Most Recent Note - 3/27/2013 6:32:11 PM
G - Found recent support and rallied from its 50 DMA line. Relative Strength Rating is at 78, just the 80+ guideline. Fundamental concerns remain since it reported earnings +11% on +6% sales revenues for the Dec '12 quarter.
>>> The latest Featured Stock Update with an annotated graph appeared on 3/19/2013. Click here.
View all notes |
Alert me of new notes |
CANSLIM.net Company Profile |
SEC |
Zacks Reports |
StockTalk |
News |
Chart |
Request a new note
C
A N
S L
I M
|
CVLT
-
NASDAQ
Commvault Systems Inc
COMPUTER SOFTWARE and SERVICES - Business Software and Services
|
$80.77
|
-1.23
-1.50% |
$83.83
|
578,734
78.90% of 50 DAV
50 DAV is 733,500
|
$86.89
-7.04%
|
3/14/2013
|
$84.71
|
PP = $79.63
|
|
MB = $83.61
|
Most Recent Note - 3/27/2013 6:34:45 PM
Y - Volume totals have been cooling in recent weeks while consolidating above prior highs in the $79 area defining initial chart support to watch. Its technical breakout on 3/14/13 was backed by 4.5 times average volume. Prior highs define initial support to watch above its 50 DMA line.
>>> The latest Featured Stock Update with an annotated graph appeared on 3/14/2013. Click here.
View all notes |
Alert me of new notes |
CANSLIM.net Company Profile |
SEC |
Zacks Reports |
StockTalk |
News |
Chart |
Request a new note
C
A N
S L
I M
|
Symbol/Exchange
Company Name
Industry Group |
PRICE |
CHANGE
(%Change) |
Day High |
Volume
(% DAV)
(% 50 day avg vol) |
52 Wk Hi
% From Hi |
Featured
Date |
Price
Featured |
Pivot Featured |
|
Max Buy |
EVER
-
NYSE
Everbank Financial Corp
BANKING
|
$15.40
|
+0.00
0.00% |
$15.62
|
436,330
49.43% of 50 DAV
50 DAV is 882,800
|
$17.29
-10.93%
|
3/4/2013
|
$15.38
|
PP = $15.83
|
|
MB = $16.62
|
Most Recent Note - 3/28/2013 2:38:16 PM
G - Still quietly consolidating above its 50 DMA line. That important short-term average has acted as support since damaging losses violated prior highs in the $16 area raising concerns while completely negating its prior technical breakout.
>>> The latest Featured Stock Update with an annotated graph appeared on 3/4/2013. Click here.
View all notes |
Alert me of new notes |
CANSLIM.net Company Profile |
SEC |
Zacks Reports |
StockTalk |
News |
Chart |
Request a new note
C
A N
S L
I M
|
FLT
-
NYSE
Fleetcor Technologies
DIVERSIFIED SERVICES - Business/Management Services
|
$77.24
|
+0.57
0.74% |
$77.91
|
970,060
128.11% of 50 DAV
50 DAV is 757,200
|
$77.46
-0.28%
|
3/21/2013
|
$71.14
|
PP = $73.00
|
|
MB = $76.65
|
Most Recent Note - 4/1/2013 6:04:06 PM
G - Color code is changed to green after a gain today with above average volume for another new 52-week high, getting extended above its "max buy" level. Prior high in the $72 area defines near-term support to watch on pullbacks.
>>> The latest Featured Stock Update with an annotated graph appeared on 3/21/2013. Click here.
View all notes |
Alert me of new notes |
CANSLIM.net Company Profile |
SEC |
Zacks Reports |
StockTalk |
News |
Chart |
Request a new note
C
A N
S L
I M
|
JAZZ
-
NASDAQ
Jazz Pharmaceuticals Plc
DRUGS - Biotechnology
|
$55.17
|
-0.74
-1.32% |
$56.38
|
564,731
103.91% of 50 DAV
50 DAV is 543,500
|
$60.79
-9.24%
|
3/5/2013
|
$59.10
|
PP = $60.10
|
|
MB = $63.11
|
Most Recent Note - 4/1/2013 6:07:33 PM
Slid further below its 50 DMA line and its Relative Strength rating has slumped to 55, well below the 80+ minimum guideline for buy candidates. Completed a Secondary Offering on 3/05/13. Needs a rebound above its 50 DMA line for its outlook to improve. Based on weak action it will be dropped from the Featured Stocks list tonight.
>>> The latest Featured Stock Update with an annotated graph appeared on 3/7/2013. Click here.
View all notes |
Alert me of new notes |
CANSLIM.net Company Profile |
SEC |
Zacks Reports |
StockTalk |
News |
Chart |
Request a new note
C
A N
S L
I M
|
KORS
-
NYSE
Michael Kors Hldgs Ltd
RETAIL - Apparel Stores
|
$55.50
|
-1.29
-2.27% |
$57.49
|
3,535,905
58.02% of 50 DAV
50 DAV is 6,094,800
|
$65.10
-14.75%
|
1/23/2013
|
$54.98
|
PP = $58.72
|
|
MB = $61.66
|
Most Recent Note - 3/27/2013 6:37:30 PM
G - Still sputtering below its 50 DMA line and its Relative Strength rating has slumped to 72, below the 80+ minimum guideline for buy candidates raising more concerns. Completed another Secondary Offering 2/20/13 while perched near its all-time high.
>>> The latest Featured Stock Update with an annotated graph appeared on 3/8/2013. Click here.
View all notes |
Alert me of new notes |
CANSLIM.net Company Profile |
SEC |
Zacks Reports |
StockTalk |
News |
Chart |
Request a new note
C
A N
S L
I M
|
LNKD
-
NYSE
Linkedin Corp Class A
INTERNET - Internet Information Providers
|
$173.61
|
-2.45
-1.39% |
$180.39
|
1,811,622
74.15% of 50 DAV
50 DAV is 2,443,300
|
$184.15
-5.72%
|
2/8/2013
|
$147.04
|
PP = $127.55
|
|
MB = $133.93
|
Most Recent Note - 4/1/2013 6:09:52 PM
G - Volume was higher but below average behind today's loss. It is still extended from its prior base, meanwhile its 50 DMA line defines important near term support to watch on pullbacks.
>>> The latest Featured Stock Update with an annotated graph appeared on 3/11/2013. Click here.
View all notes |
Alert me of new notes |
CANSLIM.net Company Profile |
SEC |
Zacks Reports |
StockTalk |
News |
Chart |
Request a new note
C
A N
S L
I M
|
Symbol/Exchange
Company Name
Industry Group |
PRICE |
CHANGE
(%Change) |
Day High |
Volume
(% DAV)
(% 50 day avg vol) |
52 Wk Hi
% From Hi |
Featured
Date |
Price
Featured |
Pivot Featured |
|
Max Buy |
LOPE
-
NASDAQ
Grand Canyon Education
DIVERSIFIED SERVICES - Education and; Training Services
|
$24.12
|
-1.27
-5.00% |
$25.47
|
539,809
121.47% of 50 DAV
50 DAV is 444,400
|
$27.18
-11.26%
|
2/20/2013
|
$26.44
|
PP = $25.10
|
|
MB = $26.36
|
Most Recent Note - 4/1/2013 6:13:05 PM
Slumped to a weak close just below its 50 DMA line with above average volume behind today's loss. Its Relative Strength Rating has also slumped to 74, below the 80+ minimum guideline for buy candidates. It will be dropped from the Featured Stocks list tonight. Volume-driven gains to new highs are needed for its technical stance to improve.
>>> The latest Featured Stock Update with an annotated graph appeared on 3/13/2013. Click here.
View all notes |
Alert me of new notes |
CANSLIM.net Company Profile |
SEC |
Zacks Reports |
StockTalk |
News |
Chart |
Request a new note
C
A N
S L
I M
|
MIDD
-
NASDAQ
Middleby Corp
MANUFACTURING - Diversified Machinery
|
$150.20
|
-1.95
-1.28% |
$152.72
|
112,541
117.35% of 50 DAV
50 DAV is 95,900
|
$154.74
-2.93%
|
10/8/2012
|
$118.46
|
PP = $122.67
|
|
MB = $128.80
|
Most Recent Note - 4/1/2013 6:13:43 PM
G - Recently staying in tight trading range near all-time highs, stubbornly holding its ground above its 50 DMA line. Fundamental concerns were recently noted.
>>> The latest Featured Stock Update with an annotated graph appeared on 3/25/2013. Click here.
View all notes |
Alert me of new notes |
CANSLIM.net Company Profile |
SEC |
Zacks Reports |
StockTalk |
News |
Chart |
Request a new note
C
A N
S L
I M
|
MNTX
-
NASDAQ
Manitex International
MANUFACTURING - Diversified Machinery
|
$12.32
|
-0.09
-0.73% |
$12.84
|
112,571
59.85% of 50 DAV
50 DAV is 188,100
|
$13.14
-6.24%
|
3/20/2013
|
$11.29
|
PP = $12.05
|
|
MB = $12.65
|
Most Recent Note - 3/28/2013 12:30:16 PM
Y - Encountering some distributional pressure after a considerable gain with heavy volume on 3/25/13 cleared its pivot point and triggered a technical buy signal. Prior highs define initial support to watch on pullbacks.
>>> The latest Featured Stock Update with an annotated graph appeared on 3/20/2013. Click here.
View all notes |
Alert me of new notes |
CANSLIM.net Company Profile |
SEC |
Zacks Reports |
StockTalk |
News |
Chart |
Request a new note
C
A N
S L
I M
|
MRLN
-
NASDAQ
Marlin Business Services
DIVERSIFIED SERVICES - Rental and Leasing Services
|
$23.16
|
-0.03
-0.13% |
$23.43
|
26,660
112.49% of 50 DAV
50 DAV is 23,700
|
$23.98
-3.42%
|
3/15/2013
|
$22.29
|
PP = $23.18
|
|
MB = $24.34
|
Most Recent Note - 3/28/2013 6:18:39 PM
Y - Volume was above average today after a "negative reversal" as it hit a new 52-week high and then finished lower on the session. The action was indicative of distributional pressure, rather than institutional accumulation. MRLN wedged higher with gains lacking great volume conviction since last noted on 3/25/13 with caution - "Subsequent volume-driven gains above the pivot point could help clinch a more convincing technical buy signal."
>>> The latest Featured Stock Update with an annotated graph appeared on 3/15/2013. Click here.
View all notes |
Alert me of new notes |
CANSLIM.net Company Profile |
SEC |
Zacks Reports |
StockTalk |
News |
Chart |
Request a new note
C
A N
S L
I M
|
MWIV
-
NASDAQ
M W I Veterinary Supply
HEALTH SERVICES - Medical Instruments and; Supplies
|
$132.87
|
+0.61
0.46% |
$133.38
|
40,941
72.59% of 50 DAV
50 DAV is 56,400
|
$137.18
-3.14%
|
3/4/2013
|
$130.90
|
PP = $129.45
|
|
MB = $135.92
|
Most Recent Note - 3/28/2013 2:42:58 PM
Y - Still consolidating above its pivot point with volume totals cooling. Its 50 DMA line defines near-term support. Disciplined investors limit loses by selling if ever any stock fall more than -7% from their purchase price.
>>> The latest Featured Stock Update with an annotated graph appeared on 3/6/2013. Click here.
View all notes |
Alert me of new notes |
CANSLIM.net Company Profile |
SEC |
Zacks Reports |
StockTalk |
News |
Chart |
Request a new note
C
A N
S L
I M
|
Symbol/Exchange
Company Name
Industry Group |
PRICE |
CHANGE
(%Change) |
Day High |
Volume
(% DAV)
(% 50 day avg vol) |
52 Wk Hi
% From Hi |
Featured
Date |
Price
Featured |
Pivot Featured |
|
Max Buy |
N
-
NYSE
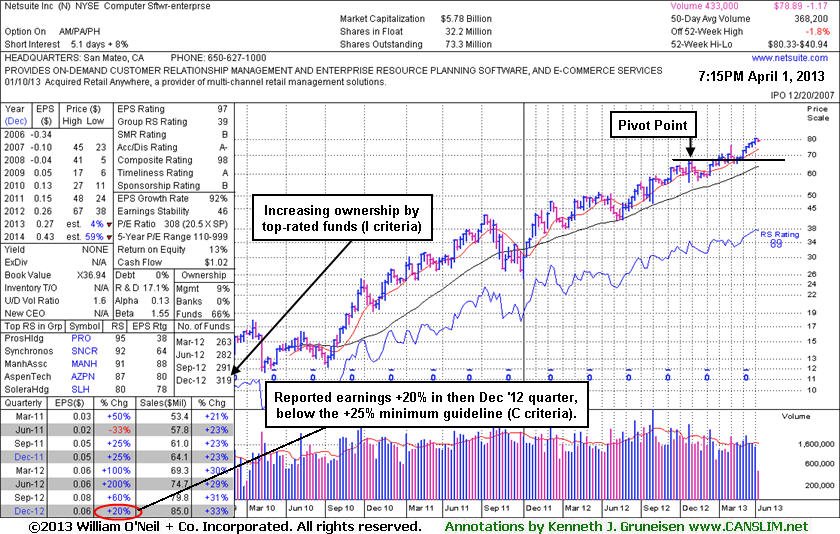
Netsuite Inc
DIVERSIFIED SERVICES - Business/Management Services
|
$78.89
|
-1.17
-1.46% |
$80.30
|
433,592
117.76% of 50 DAV
50 DAV is 368,200
|
$80.33
-1.79%
|
12/12/2012
|
$64.75
|
PP = $67.12
|
|
MB = $70.48
|
Most Recent Note - 4/1/2013 7:26:50 PM
G - Perched at 52-week and all-time highs after 7 consecutive weekly gains, extended from its prior base. See the latest FSU analysis for more details and a new annotated graph.
>>> The latest Featured Stock Update with an annotated graph appeared on 4/1/2013. Click here.
View all notes |
Alert me of new notes |
CANSLIM.net Company Profile |
SEC |
Zacks Reports |
StockTalk |
News |
Chart |
Request a new note
C
A N
S L
I M
|
NSR
-
NYSE
Neustar Inc
TELECOMMUNICATIONS - Diversified Communication Serv
|
$45.03
|
-1.50
-3.22% |
$46.69
|
957,339
216.59% of 50 DAV
50 DAV is 442,000
|
$47.24
-4.68%
|
3/8/2013
|
$44.99
|
PP = $47.34
|
|
MB = $49.71
|
Most Recent Note - 4/1/2013 12:20:43 PM
Y - Still consolidating near its 50 DMA line which has acted as support in recent weeks. Its Relative Strength rating has slumped to 77, below the 80+ minimum guideline for buy candidates.
>>> The latest Featured Stock Update with an annotated graph appeared on 3/27/2013. Click here.
View all notes |
Alert me of new notes |
CANSLIM.net Company Profile |
SEC |
Zacks Reports |
StockTalk |
News |
Chart |
Request a new note
C
A N
S L
I M
|
SLCA
-
NYSE
U S Silica Holdings Inc
CHEMICALS - Specialty Chemicals
|
$22.94
|
-0.64
-2.71% |
$23.99
|
1,774,419
166.21% of 50 DAV
50 DAV is 1,067,600
|
$28.50
-19.51%
|
2/26/2013
|
$22.23
|
PP = $21.50
|
|
MB = $22.58
|
Most Recent Note - 4/1/2013 6:15:25 PM
G - Consolidating above its 50 DMA line with higher volume behind today's loss a sign of more distributional pressure. Completed a Secondary Offering on 3/14/13. Any violation of its 50 DMA line or recent low ($21.24 on 3/15/13) would raise concerns and trigger technical sell signals.
>>> The latest Featured Stock Update with an annotated graph appeared on 3/22/2013. Click here.
View all notes |
Alert me of new notes |
CANSLIM.net Company Profile |
SEC |
Zacks Reports |
StockTalk |
News |
Chart |
Request a new note
C
A N
S L
I M
|
VRX
-
NYSE
Valeant Pharmaceuticals
DRUGS - Drug Manufacturers - Other
|
$76.05
|
+1.03
1.37% |
$76.44
|
1,298,248
104.13% of 50 DAV
50 DAV is 1,246,700
|
$75.10
1.26%
|
12/20/2012
|
$60.24
|
PP = $61.21
|
|
MB = $64.27
|
Most Recent Note - 3/27/2013 6:43:52 PM
G - Hovering near its all-time high today, holding its ground with volume totals cooling in the past week. It is very extended from the secondary buy point noted earlier. The 50 DMA line and recent low ($64.05 on 2/21/13) define important support areas to watch on pullbacks.
>>> The latest Featured Stock Update with an annotated graph appeared on 3/12/2013. Click here.
View all notes |
Alert me of new notes |
CANSLIM.net Company Profile |
SEC |
Zacks Reports |
StockTalk |
News |
Chart |
Request a new note
C
A N
S L
I M
|