You are not logged in.
This means you
CAN ONLY VIEW reports that were published prior to Monday, April 14, 2025.
You
MUST UPGRADE YOUR MEMBERSHIP if you want to see any current reports.
AFTER MARKET UPDATE - THURSDAY, APRIL 1ST, 2010
Previous After Market Report Next After Market Report >>>
|
|
|
|
DOW |
+70.44 |
10,927.07 |
+0.65% |
|
Volume |
913,775,700 |
-21% |
|
Volume |
2,300,673,970 |
-7% |
|
NASDAQ |
+3.61 |
2,401.57 |
+0.15% |
|
Advancers |
2,253 |
72% |
|
Advancers |
1,526 |
54% |
|
S&P 500 |
+8.67 |
1,178.10 |
+0.74% |
|
Decliners |
779 |
25% |
|
Decliners |
1,159 |
41% |
|
Russell 2000 |
+5.34 |
683.98 |
+0.79% |
|
52 Wk Highs |
318 |
|
|
52 Wk Highs |
146 |
|
|
S&P 600 |
+3.12 |
363.42 |
+0.87% |
|
52 Wk Lows |
5 |
|
|
52 Wk Lows |
11 |
|
|
 |
Rally Continues Into Holiday Weekend
Adam Sarhan, Contributing Writer,
Stocks rallied on this shortened holiday week as investors digested the latest round of healthy economic data and Q1 came to close. Volume totals on the NYSE and on the Nasdaq exchange were reported lighter compared to Wednesday's session. Breadth was positive, advancers led decliners by nearly a 3-to-1 ratio on the NYSE and by almost a 3-to-2 ratio on the Nasdaq exchange. New 52-week highs trumped new lows on both exchanges yet again. Meanwhile, there were 43 high-ranked companies from the CANSLIM.net Leaders List made a new 52-week high and appeared on the CANSLIM.net BreakOuts Page, higher than the 16 issues that appeared on the prior session.
Stocks rallied on Monday as the US dollar fell after the government said consumer spending rose in February for a fifth consecutive month while personal income levels held steady. On Tuesday, stocks closed with modest gains after trading between positive and negative as investors digested a slew of economic data. Housing stocks sold off after the S&P/Case-Shiller index of home prices was released. The 20-city home-price index unexpectedly rose +0.3% in January. The closely watched index tracks monthly changes of home prices in 20 metropolitan regions across the country and is used as a good proxy for the underlying health of the residential real estate market. Elsewhere, the Conference Board released its consumer sentiment index which rose to +52.5 in March, up from +46.4 in February.
Before Wednesday's opening bell, ADP, the country's largest private payrolls company, said US employers slashed -23,000 jobs in March which fell short of the Street's +40,000 estimate. Elsewhere, the Chicago PMI index grew to 58.8 but fell short of the Street's more robust 61 forecast. A separate report showed that factory orders grew +0.6% as the economy continues to improve. Wednesday also marked the end of the first quarter.
Stocks jumped on Thursday after the Labor Department said weekly jobless claims fell to the lowest level since 2008 which bodes well for Friday's much anticipated non-farm payrolls report. Many global markets are closed for holidays, the government will report March payrolls. The median of economists’ forecasts in a Bloomberg survey is for an increase of 184,000, the biggest in three years.
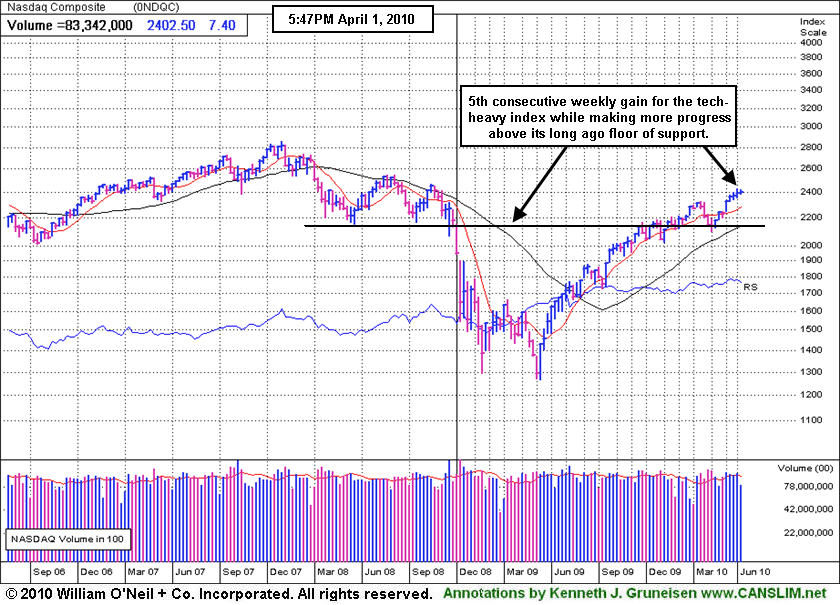
The benchmark S&P 500 Index currently has 4 distribution days while the Nasdaq Composite and Dow Jones Industrial Average have 3 since the March 1, 2010 follow-though-day (FTD). These distribution days have not been damaging, and normally it is considered healthy for the major averages to have less than 4 distribution days in a four week period. It is also a welcome sign to see the market continue to improve as investors digest the latest round of stronger than expected economic and earnings data. Remember that now that a new rally has been confirmed, the window is open to proactively be buying high quality breakouts meeting the investment system guidelines. Trade accordingly.
Don't miss your opportunity to view CANSLIM.net's Q1 2010 Webcast - Available free of charge now to all active StockNews (pay premium) members! The link to access the webcast is posted at the top of the white portion of the Premium Membership Homepage (click here). You may take advantage of the SPRING SPECIAL to reactivate an expired membership, start a new membership, or upgrade from your free membership level so you can access this informative webcast.
PICTURED: The tech-heavy Nasdaq Composite Index finished Q1 with its 5th consecutive weekly gain, making more progress above its long ago floor of support.
|
|
|
 |
XAU Rallying Back Promptly After Latest 200 DMA Violation
Kenneth J. Gruneisen - Passed the CAN SLIM® Master's Exam
Modest gains from several influential groups helped underpin the major averages' gains on Thursday as the Broker/Dealer Index ($XBD +0.78%), Bank Index ($BKX +0.85%), and Retail Index ($RLX +0.40%) were among the groups that traded with a positive bias. The Healthcare Index ($HMO +1.63%) and Biotechnology Index ($BTK +1.16%) posted solid gains. Energy-related shares were mixed as the Oil Services Index ($OSX +2.63%) posted a solid gain but the Integrated Oil Index ($XOI -0.85%) fell. The tech sector had a quiet session as the Internet Index ($IIX +0.54%) tallied a small gain while the Networking Index ($NWX -0.07%) and Semiconductor Index ($SOX +0.10%) showed no decisiveness.
Charts courtesy www.stockcharts.com
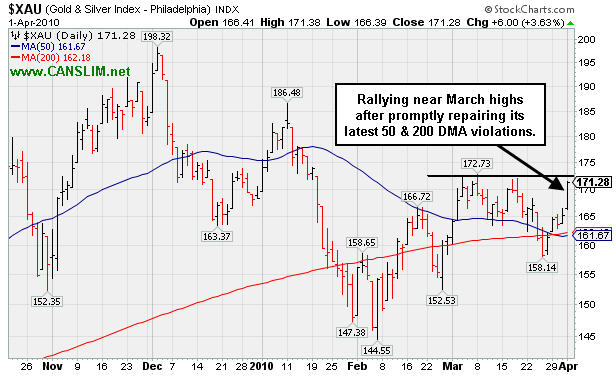
PICTURED: The Gold & Silver Index ($XAU +3.63%) is rallying near March highs after promptly repairing its latest 50-day moving average (DMA) and 200 DMA violations.
| Oil Services |
$OSX |
211.38 |
+5.41 |
+2.63% |
+8.44% |
| Healthcare |
$HMO |
1,587.95 |
+12.94 |
+0.82% |
+1.66% |
| Integrated Oil |
$XOI |
1,100.93 |
+19.73 |
+1.82% |
+1.45% |
| Semiconductor |
$SOX |
366.93 |
+0.36 |
+0.10% |
+1.95% |
| Networking |
$NWX |
254.90 |
-0.19 |
-0.07% |
+10.32% |
| Internet |
$IIX |
247.35 |
-0.83 |
-0.34% |
+5.61% |
| Broker/Dealer |
$XBD |
117.56 |
+0.91 |
+0.78% |
+2.18% |
| Retail |
$RLX |
451.61 |
+1.82 |
+0.40% |
+9.85% |
| Gold & Silver |
$XAU |
171.28 |
+6.00 |
+3.63% |
+1.80% |
| Bank |
$BKX |
52.44 |
+0.44 |
+0.85% |
+22.78% |
| Biotech |
$BTK |
1,241.73 |
+14.18 |
+1.16% |
+31.80% |
|
|
|
 |
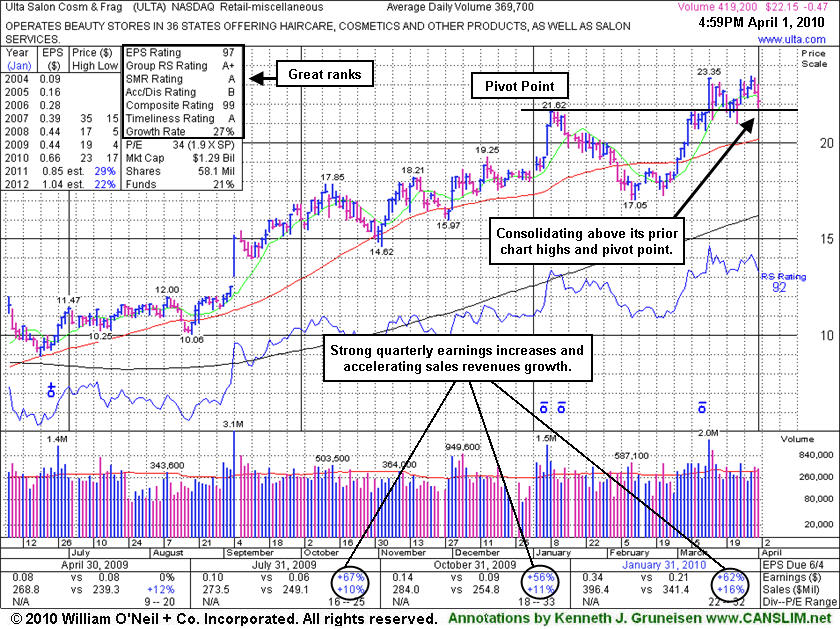
Consolidating Above Prior Chart Highs
Kenneth J. Gruneisen - Passed the CAN SLIM® Master's Exam
Ulta Salon Cosmetics & Fragrance, Inc. (ULTA -0.47 or -2.08% to $22.15) suffered a second consecutive loss today with slightly higher than average volume, a sign of mild distributional pressure this week. Its color code was changed to yellow while consolidating below its "max buy" level but staying above its pivot point. Prior chart highs are now a support level to watch, while any close below its $21.61 high close from January 8, 2010 would raise concerns by negating its latest technical breakout. A detailed Stock Bulletin with annotated graph was published soon after it was featured in the 3/12/10 mid-day report (read here) as a considerable gain with heavy volume helped it reach a new 52-week high. It was noted as it rose from an 8-week cup shaped base following stronger results for the quarter ended January 31, 2010.
This high-ranked leader in the Retail - Misc group which has shown accelerating sales revenues increases. Strong quarterly earnings increases above the +25% guideline in the 3 latest quarterly comparisons satisfies the C criteria. The number of top-rated funds with an ownership interest has grown from 49 funds in March '09 to 72 funds as of Dec '09 which is an encouraging sign of increasing institutional interest (the I criteria). Management's 51% ownership stake keeps the company's directors very motivated to look after and build shareholder value. Its current Up/Down Volume Ratio of 1.5 is an unbiased bullish indication concerning its recent action. It has rallied from March '09 lows near $4, yet it has encountered very little distributional pressure during that period. It now faces no resistance due to overhead supply.
|
|
|
Color Codes Explained :
Y - Better candidates highlighted by our
staff of experts.
G - Previously featured
in past reports as yellow but may no longer be buyable under the
guidelines.
***Last / Change / Volume quote data in this table corresponds with the timestamp on the note***
Symbol/Exchange
Company Name
Industry Group |
Last |
Chg. |
Vol
% DAV |
Date Featured |
Price Featured |
Latest Pivot Point
Featured |
Status |
| Latest Max Buy Price |
ARUN
- NASDAQ
Aruba Networks Inc
COMPUTER HARDWARE - Networking & Communication Dev
|
$13.65
|
-0.01
|
1,211,331
76% DAV
1,589,900
|
2/19/2010
(Date
Featured) |
$12.71
(Price
Featured) |
PP = $11.94 |
G |
| MB = $12.54 |
Most Recent Note - 4/1/2010 4:24:48 PM
G - Small loss today after touching a new 52-week high ended a winning streak of 5 consecutive gains. Support to watch is defined by prior chart highs and its 50 DMA line in the upper $11 area.
>>> The latest Featured Stock Update with an annotated graph appeared on 3/31/2010. click here.
|
|
C
A
S
I |
News |
Chart |
SEC
View all notes Alert
me of new notes
Company
Profile
|
BIDU
- NASDAQ
Baidu Inc Ads
INTERNET - Internet Information Providers
|
$600.00
|
+3.00
|
1,029,888
61% DAV
1,696,400
|
1/13/2010
(Date
Featured) |
$431.25
(Price
Featured) |
PP = $426.75 |
G |
| MB = $448.09 |
Most Recent Note - 4/1/2010 4:29:38 PM
G - Still quietly hovering near all-time highs and near an upward trendline connecting its late-January to March lows previously noted as an initial chart support level to watch. It may easily rally and get even more extended from a sound base, but a subsequent violation of its upward trendline may be considered an early sell signal that prompts investors to lock in some gains.
>>> The latest Featured Stock Update with an annotated graph appeared on 3/24/2010. click here.
|
|
C
A
S
I |
News |
Chart |
SEC
View all notes Alert
me of new notes
Company
Profile
|
BRLI
- NASDAQ
Bio Reference Labs Inc
HEALTH SERVICES - Medical Laboratories & Researc
|
$43.75
|
-0.22
|
52,071
54% DAV
97,100
|
2/12/2010
(Date
Featured) |
$39.02
(Price
Featured) |
PP = $40.97 |
G |
| MB = $43.02 |
Most Recent Note - 4/1/2010 4:31:22 PM
G - Second consecutive loss on below average volume. This high-ranked Medical/Dental Services firm is consolidating above its "max buy" level. Prior chart highs and its 50 DMA line coincide in the $40 area, defining important support to watch.
>>> The latest Featured Stock Update with an annotated graph appeared on 3/22/2010. click here.
|
|
C
A
S
I |
News |
Chart |
SEC
View all notes Alert
me of new notes
Company
Profile
|
CISG
- NASDAQ
Cninsure Inc Ads
INSURANCE - Insurance Brokers
|
$27.64
|
+1.03
|
271,197
118% DAV
230,400
|
3/3/2010
(Date
Featured) |
$24.38
(Price
Featured) |
PP = $23.10 |
G |
| MB = $24.26 |
Most Recent Note - 4/1/2010 4:32:03 PM
G - Hit a new 52-week high with today's solid gain, getting more extended from a sound base, yet no overhead supply remains to act as resistance. It rose from a 20-week double bottom base with 8 times average volume as it was featured in the 3/03/10 mid-day report (read here).
>>> The latest Featured Stock Update with an annotated graph appeared on 3/23/2010. click here.
|
|
C
A
S
I |
News |
Chart |
SEC
View all notes Alert
me of new notes
Company
Profile
|
CRM
- NYSE
Salesforce.com Inc
INTERNET - Internet Software & Services
|
$75.54
|
+1.09
|
1,053,197
58% DAV
1,808,100
|
3/5/2010
(Date
Featured) |
$72.28
(Price
Featured) |
PP = $75.53 |
Y |
| MB = $79.31 |
Most Recent Note - 4/1/2010 4:33:20 PM
Y - Small gain today with light volume, closing near its pivot point and only -3.1% from its all-time high. A solid gain above its pivot point with at least +50% above average volume is required to trigger a technical buy signal.
>>> The latest Featured Stock Update with an annotated graph appeared on 3/25/2010. click here.
|
|
C
A
S
I |
News |
Chart |
SEC
View all notes Alert
me of new notes
Company
Profile
|
CTRP
- NASDAQ
Ctrip.com Intl Ltd Adr
LEISURE - Resorts & Casinos
|
$40.29
|
+1.09
|
3,811,259
172% DAV
2,211,900
|
3/25/2010
(Date
Featured) |
$40.74
(Price
Featured) |
PP = $39.40 |
Y |
| MB = $41.37 |
Most Recent Note - 4/1/2010 4:38:09 PM
Y - Gapped up and surged to a new high, briefly trading above its "max buy" level, but while its gain above its pivot point today was backed by +72% above average volume, it encountered distributional pressure and quickly reversed a large part of its early gain to ultimately close in the lower part of its intra-day range. CTRP has been stalled at all-time highs since 3/25/10 when a detailed Stock Bulletin with annotated graph and expert analysis was published (read here).
>>> The latest Featured Stock Update with an annotated graph appeared on 3/25/2010. click here.
|
|
C
A
S
I |
News |
Chart |
SEC
View all notes Alert
me of new notes
Company
Profile
|
EZPW
- NASDAQ
Ezcorp Inc Cl A
SPECIALTY RETAIL - Specialty Retail, Other
|
$20.95
|
+0.35
|
364,277
67% DAV
544,600
|
2/19/2010
(Date
Featured) |
$19.03
(Price
Featured) |
PP = $18.80 |
G |
| MB = $19.74 |
Most Recent Note - 4/1/2010 4:39:11 PM
G - Small gain today, still quietly consolidating above its 50 DMA line and its recent chart low ($19.73 on 3/16/10) which define near-term support. This high-ranked Finance - Consumer/Commercial Loans firm is only -5.6% from its all-time high and has no overhead supply to act as resistance.
>>> The latest Featured Stock Update with an annotated graph appeared on 3/29/2010. click here.
|
|
C
A
S
I |
News |
Chart |
SEC
View all notes Alert
me of new notes
Company
Profile
|
GMCR
- NASDAQ
Green Mtn Coffee Roastrs
FOOD & BEVERAGE - Processed & Packaged Goods
|
$96.48
|
-0.39
|
996,498
83% DAV
1,195,200
|
2/26/2010
(Date
Featured) |
$84.39
(Price
Featured) |
PP = $88.75 |
G |
| MB = $93.19 |
Most Recent Note - 4/1/2010 4:40:36 PM
G - Today it hit a new all-time high then negatively reversed and closed near the session low with a small loss on below average volume. Initial support to watch is at prior chart highs and its 50 DMA line in the $86-88 area.
>>> The latest Featured Stock Update with an annotated graph appeared on 3/12/2010. click here.
|
|
C
A
S
I |
News |
Chart |
SEC
View all notes Alert
me of new notes
Company
Profile
|
ISRG
- NASDAQ
Intuitive Surgical Inc
HEALTH SERVICES - Medical Appliances & Equipment
|
$349.60
|
+1.47
|
274,070
52% DAV
523,000
|
1/22/2010
(Date
Featured) |
$340.40
(Price
Featured) |
PP = $314.00 |
G |
| MB = $329.70 |
Most Recent Note - 4/1/2010 4:43:54 PM
G - Found support this week near prior chart highs ($346) and its 50 DMA line - important support levels to watch. As previously repeated in notes, it did not trigger a technical buy signal in recent weeks.
>>> The latest Featured Stock Update with an annotated graph appeared on 3/16/2010. click here.
|
|
C
A
S
I |
News |
Chart |
SEC
View all notes Alert
me of new notes
Company
Profile
|
PCLN
- NASDAQ
Priceline.com Inc
INTERNET - Internet Software & Services
|
$399.55
|
-4.72
|
584,812
N/A
|
11/1/2002
(Date
Featured) |
$399.55
(Price
Featured) |
PP = $428.20 |
Y |
| MB = $449.61 |
Most Recent Note - 1/2/2011
Y - Returns to Featured Stocks list with its appearance in the January 2011 CANSLIM.net News including detailed analysis and annotated daily and weekly graphs.
>>> The latest Featured Stock Update with an annotated graph appeared on 3/30/2010. click here.
|
|
C
A
S
I |
News |
Chart |
SEC
View all notes Alert
me of new notes
Company
Profile
|
PEGA
- NASDAQ
Pegasystems Inc
COMPUTER SOFTWARE & SERVICES - Business Software & Services
|
$37.24
|
+0.24
|
94,176
44% DAV
214,100
|
2/26/2010
(Date
Featured) |
$36.00
(Price
Featured) |
PP = $38.55 |
Y |
| MB = $40.48 |
Most Recent Note - 4/1/2010 4:46:59 PM
Y - Today's small gain on light volume ended a streak of 6 consecutive small losses with below average volume, pulling back near prior chart highs and its 50 DMA line which coincide in the $37 area. Volume totals have cooled while it has hovered in a tight range near all-time highs, but it has failed to follow through with confirming gains since its considerable gap up gain on 3/15/10 triggered a technical buy signal.
>>> The latest Featured Stock Update with an annotated graph appeared on 3/15/2010. click here.
|
|
C
A
S
I |
News |
Chart |
SEC
View all notes Alert
me of new notes
Company
Profile
|
ROVI
- NASDAQ
Rovi Corp
COMPUTER SOFTWARE & SERVICES - Security Software & Services
|
$36.74
|
-0.39
|
957,046
69% DAV
1,382,700
|
2/25/2010
(Date
Featured) |
$33.54
(Price
Featured) |
PP = $34.87 |
G |
| MB = $36.61 |
Most Recent Note - 4/1/2010 4:53:33 PM
G - Posted a 7th consecutive small loss today on below average volume, yet it is still perched only -4.6% from its all-time high. It ended the week just above its "max buy" level, while prior chart highs in the $34 area define an important support level to watch on pullbacks.
>>> The latest Featured Stock Update with an annotated graph appeared on 3/17/2010. click here.
|
|
C
A
S
I |
News |
Chart |
SEC
View all notes Alert
me of new notes
Company
Profile
|
SIRO
- NASDAQ
Sirona Dental Systems
HEALTH SERVICES - Medical Instruments & Supplies
|
$38.46
|
+0.43
|
1,032,449
174% DAV
592,100
|
2/16/2010
(Date
Featured) |
$36.43
(Price
Featured) |
PP = $36.15 |
G |
| MB = $37.96 |
Most Recent Note - 4/1/2010 4:57:14 PM
G - Small gain today with heavy volume for a new high close, but heavier volume and lack of meaningful upward price progress above prior highs may be indicative of distributional pressure. Prior chart highs and its 50 DMA line in the $35-36 area define important support to watch.
>>> The latest Featured Stock Update with an annotated graph appeared on 3/26/2010. click here.
|
|
C
A
S
I |
News |
Chart |
SEC
View all notes Alert
me of new notes
Company
Profile
|
ULTA
- NASDAQ
Ulta Salon Cosm & Frag
SPECIALTY RETAIL - Specialty Retail, Other
|
$22.15
|
-0.47
|
421,577
114% DAV
369,700
|
3/12/2010
(Date
Featured) |
$22.81
(Price
Featured) |
PP = $21.72 |
Y |
| MB = $22.81 |
Most Recent Note - 4/1/2010 5:13:54 PM
Y - Second consecutive loss today with slightly higher than average volume, a sign of mild distributional pressure this week. Color code is changed to yellow while consolidating below its "max buy" level. A detailed Stock Bulletin with annotated graph was published soon after it was featured in the 3/12/10 mid-day report.
>>> The latest Featured Stock Update with an annotated graph appeared on 4/1/2010. click here.
|
|
C
A
S
I |
News |
Chart |
SEC
View all notes Alert
me of new notes
Company
Profile
|
VPRT
- NASDAQ
Vistaprint Nv
DIVERSIFIED SERVICES - Business/Management Services
|
$57.14
|
-0.23
|
285,929
63% DAV
451,300
|
3/1/2010
(Date
Featured) |
$57.72
(Price
Featured) |
PP = $59.70 |
G |
| MB = $62.69 |
Most Recent Note - 4/1/2010 5:16:24 PM
G - Holding its ground near its 50 DMA line, but distributional action pressured it near that short-term average line this week, raising concerns. Color code was changed to green. It did not trigger a technical buy signal since it was featured in the March 2010 CANSLIM.net News monthly newsletter (read here). As previously noted, "Its gain on 3/02/10 was below the volume guidelines for buyable breakouts under the investment system."
>>> The latest Featured Stock Update with an annotated graph appeared on 3/19/2010. click here.
|
|
C
A
S
I |
News |
Chart |
SEC
View all notes Alert
me of new notes
Company
Profile
|
|
|
|
THESE ARE NOT BUY RECOMMENDATIONS!
Comments contained in the body of this report are technical
opinions only. The material herein has been obtained
from sources believed to be reliable and accurate, however,
its accuracy and completeness cannot be guaranteed.
This site is not an investment advisor, hence it does
not endorse or recommend any securities or other investments.
Any recommendation contained in this report may not
be suitable for all investors and it is not to be deemed
an offer or solicitation on our part with respect to
the purchase or sale of any securities. All trademarks,
service marks and trade names appearing in this report
are the property of their respective owners, and are
likewise used for identification purposes only.
This report is a service available
only to active Paid Premium Members.
You may opt-out of receiving report notifications
at any time. Questions or comments may be submitted
by writing to Premium Membership Services 665 S.E. 10 Street, Suite 201 Deerfield Beach, FL 33441-5634 or by calling 1-800-965-8307
or 954-785-1121.
|
|
|


