You are not logged in.
This means you
CAN ONLY VIEW reports that were published prior to Monday, April 14, 2025.
You
MUST UPGRADE YOUR MEMBERSHIP if you want to see any current reports.
AFTER MARKET UPDATE - MONDAY, MARCH 31ST, 2014
Previous After Market Report Next After Market Report >>>
|
|
|
|
DOW |
+134.60 |
16,457.66 |
+0.82% |
|
Volume |
833,417,930 |
+33% |
|
Volume |
1,901,571,200 |
+1% |
|
NASDAQ |
+43.23 |
4,198.99 |
+1.04% |
|
Advancers |
2,342 |
74% |
|
Advancers |
2,123 |
75% |
|
S&P 500 |
+14.72 |
1,872.34 |
+0.79% |
|
Decliners |
724 |
23% |
|
Decliners |
643 |
23% |
|
Russell 2000 |
+21.23 |
1,173.04 |
+1.84% |
|
52 Wk Highs |
143 |
|
|
52 Wk Highs |
75 |
|
|
S&P 600 |
+11.89 |
671.12 |
+1.80% |
|
52 Wk Lows |
8 |
|
|
52 Wk Lows |
29 |
|
|
 |
Indices Rose With Encouraging Increase in Volume Behind Gains
Kenneth J. Gruneisen - Passed the CAN SLIM® Master's Exam
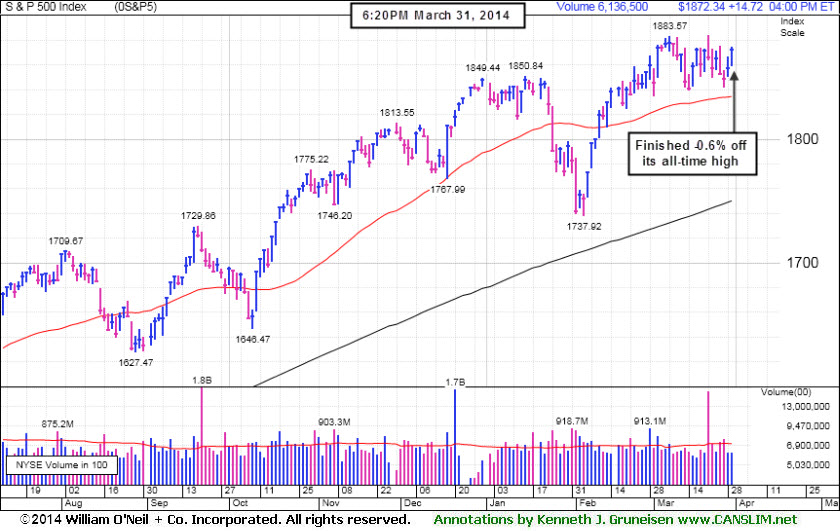
Monday's modest gains ended March on a positive note as the Dow pared its first-quarter decline to -0.7% while the S&P 500 gained +1.3% and the NASDAQ added +0.5%. The Dow climbed 135 points to 16,457. The S&P 500 added 15 points to 1,872. The NASDAQ rose 43 points to 4,198. The volume totals were reported higher on the Nasdaq exchange and on the NYSE. Advancers led decliners by 13-4 margin on the NYSE while advancers led 16-5 over decliners on the Nasdaq exchange. There were 28 high-ranked companies from the CANSLIM.net Leaders List that made new 52-week highs and appeared on the CANSLIM.net BreakOuts Page, up from the total of 13 stocks on the prior session. The list of stocks hitting new 52-week highs outnumbered new 52-week lows on the NYSE, however new lows outnumbered new highs on the Nasdaq exchange. Gains were posted by 8 of the 9 high-ranked companies currently included on the Featured Stocks Page. Recent weakness in the major indices coupled with waning of leadership in the Market (M criteria) recently earned the label of a "correction" again. Investors are reminded to reduce market exposure and avoid new buying efforts until the market produces a new confirmed uptrend.
The major averages were higher on Monday following comments by Fed Chairwoman Janet Yellen. In a speech today, Yellen suggested the current conditions in the labor market still warrant an accommodative interest rate policy. The market’s advance was also attributed to easing tension over Ukraine following a meeting between U.S. Secretary of State John Kerry and Russia's foreign minister over the weekend. On the economic front, a report showed the pace of manufacturing activity declined in March.
Nine of 10 sectors in the S&P 500 were up on the session. Health care and technology were the best performing groups. Johnson & Johnson (JNJ +0.8%) rose after it agreed to sell its diagnostics unit to private-equity firm Carlyle Group for $4 billion. Chipmaker Micron (MU +8%) rose while Oracle (ORCL +3.4%). Energy was the lone sector down as Halliburton (HAL -1%) and others fell.
Treasuries were mixed with the 10-year note unchanged to yield 2.72%.
The CANSLIM.net Featured Stocks Page shows the most action-worthy candidates and their latest notes and a Headline Link directs members to the latest detailed analysis with data-packed graphs annotated by a Certified expert along with links to additional resources. The Premium Member Homepage includes "dynamic archives" to all prior pay reports published. Watch for an announcement via email concerning the next WEBCAST.
PICTURED: The S&P 500 Index is perched -0.6% off its all-time high, consolidating well above its 50-day moving average (DMA) line.
|
 Kenneth J. Gruneisen started out as a licensed stockbroker in August 1987, a couple of months prior to the historic stock market crash that took the Dow Jones Industrial Average down -22.6% in a single day. He has published daily fact-based fundamental and technical analysis on high-ranked stocks online for two decades. Through FACTBASEDINVESTING.COM, Kenneth provides educational articles, news, market commentary, and other information regarding proven investment systems that work in good times and bad.
Comments contained in the body of this report are technical opinions only and are not necessarily those of Gruneisen Growth Corp. The material herein has been obtained from sources believed to be reliable and accurate, however, its accuracy and completeness cannot be guaranteed. Our firm, employees, and customers may effect transactions, including transactions contrary to any recommendation herein, or have positions in the securities mentioned herein or options with respect thereto. Any recommendation contained in this report may not be suitable for all investors and it is not to be deemed an offer or solicitation on our part with respect to the purchase or sale of any securities. |
|
 |
Financial and Tech Indexes Led Gainers
Kenneth J. Gruneisen - Passed the CAN SLIM® Master's Exam
The Broker/Dealer Index ($XBD +1.99%) and the Bank Index ($BKX +1.19%) posted gains on Monday which underpinned the major averages' advance. The Biotechnology Index ($BTK +3.18%) led the tech sector higher while the Networking Index ($NWX +1.58%) and the Semiconductor Index ($SOX +1.60%) posted solid gains. The Retail Index ($RLX +0.25%) eked out a small gain while the Integrated Oil Index ($XOI -0.04%) and the Oil Services Index ($OSX +0.07%) were both virtually unchanged. The Gold & Silver Index ($XAU -2.31%) was a laggard as it fell on the mostly positive session.
Charts courtesy www.stockcharts.com
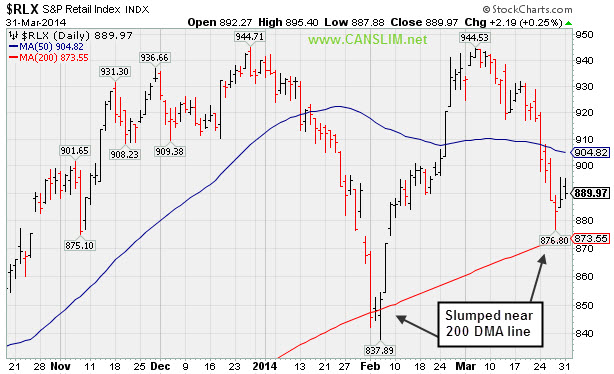
PICTURED: The Retail Index ($RLX +0.25%) recently slumped near its 200-day moving average (DMA) line.
| Oil Services |
$OSX |
288.83 |
+0.20 |
+0.07% |
+2.78% |
| Integrated Oil |
$XOI |
1,508.94 |
-0.58 |
-0.04% |
+0.39% |
| Semiconductor |
$SOX |
586.74 |
+9.26 |
+1.60% |
+9.66% |
| Networking |
$NWX |
338.80 |
+5.25 |
+1.58% |
+4.59% |
| Broker/Dealer |
$XBD |
160.27 |
+3.13 |
+1.99% |
-0.18% |
| Retail |
$RLX |
889.97 |
+2.19 |
+0.25% |
-5.30% |
| Gold & Silver |
$XAU |
91.20 |
-2.16 |
-2.31% |
+8.38% |
| Bank |
$BKX |
72.29 |
+0.85 |
+1.19% |
+4.37% |
| Biotech |
$BTK |
2,586.24 |
+79.68 |
+3.18% |
+10.98% |
|
|
|
 |
Perched Near Highs With Mostly Quiet Volume Totals
Kenneth J. Gruneisen - Passed the CAN SLIM® Master's Exam
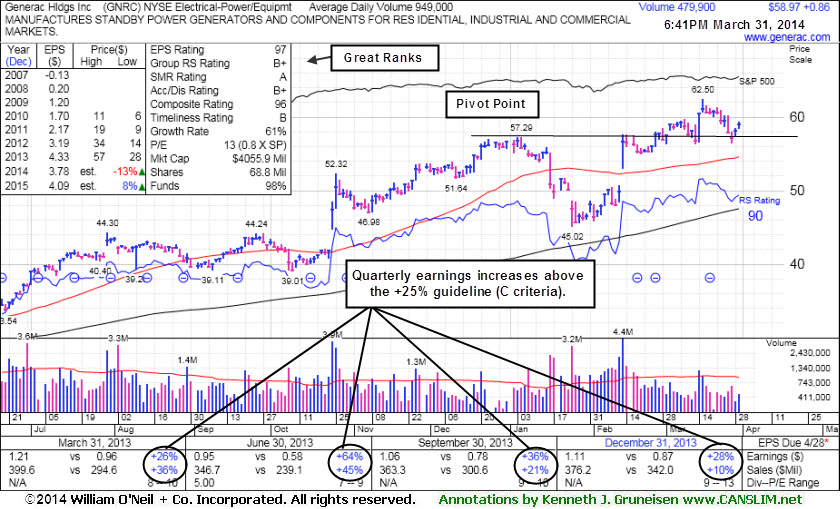
Generac Hldgs Inc (GNRC +$0.86 or +1.48% to $58.97) has been consolidating above prior highs in the $57 area defining near-term support to watch. It was last shown in this FSU section on 3/11/14 with annotated graphs under the headline, "Bullish Gap Up Followed By Wedging and Stalling Action", while not showing compelling evidence of recent institutional accumulation and making limited headway above prior resistance in the $57 area. The volume totals have not been above average behind its recent gains since its big gap up gain on 2/13/14. Members were previously cautioned - "Volume should be at least +40% above average as a stock rallies above its pivot point to trigger a proper technical buy signal."
It has held its ground and made gradual progress since 2/14/14 mid-day report (read here) when highlighted in yellow as it returned to the Featured Stocks list with a new pivot point based on its 1/06/14 high plus 10 cents. Members were previously reminded - "It may likely encounter resistance near prior highs, however, any more convincing volume-driven gains into new high territory may confirm a new technical buy signal."
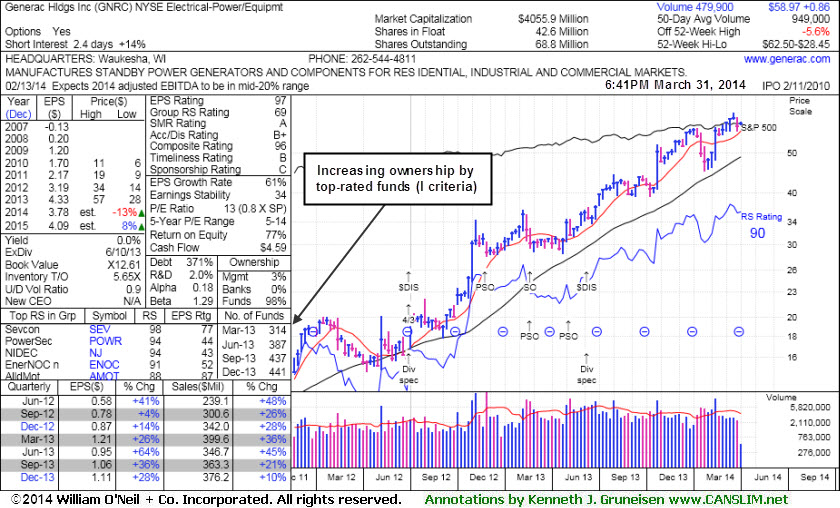
The high-ranked Electrical - Power/Equipment firm reported earnings +28% on +10% sales revenues for the Dec '13 quarter, continuing its strong earnings history satisfying the C criteria. Consensus estimates are calling for FY '14 earnings down -13%, and its currently low P/E valuation (0.8 X SP) suggests that the market has a timid outlook for future growth which is cause for some concern. Disciplined investors avoid chasing stocks if they get extended more than +5% above their pivot point, and they always limit losses by selling if any stock falls more than -7% from their purchase price.
GNRC has seen an increase in the number of top-rated funds owning its shares from 280 in Dec '12 to 441 in Dec '13, an encouraging sign concerning the I criteria. Its small float of only 42.6 million shares (S criteria) can contribute to greater price volatility in the event of institutional buying or selling.
|
|
|
Color Codes Explained :
Y - Better candidates highlighted by our
staff of experts.
G - Previously featured
in past reports as yellow but may no longer be buyable under the
guidelines.
***Last / Change / Volume data in this table is the closing quote data***
Symbol/Exchange
Company Name
Industry Group |
PRICE |
CHANGE
(%Change) |
Day High |
Volume
(% DAV)
(% 50 day avg vol) |
52 Wk Hi
% From Hi |
Featured
Date |
Price
Featured |
Pivot Featured |
|
Max Buy |
EQM
-
NYSE
E Q T Midstream Partners
ENERGY - Oil and Gas Pipelines
|
$70.33
|
+0.83
1.19% |
$70.89
|
143,194
130.18% of 50 DAV
50 DAV is 110,000
|
$69.99
0.49%
|
12/12/2013
|
$53.17
|
PP = $56.51
|
|
MB = $59.34
|
Most Recent Note - 3/28/2014 12:21:50 PM
G - Inching further into new high territory with today's gain. Held its ground since reporting earnings -2% on +22% sales revenues for the Dec '13 quarter, below the +25% minimum earnings guideline (C criteria), raising fundamental concerns. Its 50 DMA line defines near-term support where a violation may trigger a technical sell signal.
>>> FEATURED STOCK ARTICLE : Hit New Highs But Fundamental Concerns Remain - 3/21/2014
View all notes |
Set NEW NOTE alert |
CANSLIM.net Company Profile |
SEC
News |
Chart |
Request a new note
C
A N
S L
I M


|
FB
-
NASDAQ
Facebook Inc Cl A
INTERNET
|
$60.24
|
+0.23
0.38% |
$61.52
|
52,925,381
86.26% of 50 DAV
50 DAV is 61,354,000
|
$72.59
-17.01%
|
12/12/2013
|
$51.40
|
PP = $54.93
|
|
MB = $57.68
|
Most Recent Note - 3/28/2014 6:53:57 PM
G - Violated its 50 DMA line this week triggering a technical sell signal. Only a prompt rebound above that important short term average would help its outlook improve. See the latest FSU analysis for more details and new annotated graphs.
>>> FEATURED STOCK ARTICLE : 50-Day Moving Average Violation Triggered Technical Sell Signal - 3/28/2014
View all notes |
Set NEW NOTE alert |
CANSLIM.net Company Profile |
SEC
News |
Chart |
Request a new note
C
A N
S L
I M
|
FLT
-
NYSE
Fleetcor Technologies
DIVERSIFIED SERVICES - Business/Management Services
|
$115.10
|
+1.74
1.53% |
$115.11
|
630,640
54.43% of 50 DAV
50 DAV is 1,158,700
|
$132.22
-12.95%
|
3/5/2014
|
$125.40
|
PP = $124.06
|
|
MB = $130.26
|
Most Recent Note - 3/26/2014 5:56:18 PM
G - Failing to find support, it quietly has slumped below its 50 DMA line and its color code is changed to green. Relative Strength rating has slumped to 75, below the 80+ minimum guideline for buy candidates.
>>> FEATURED STOCK ARTICLE : Negated Recent Breakout and Testing Support at 50-Day Average - 3/24/2014
View all notes |
Set NEW NOTE alert |
CANSLIM.net Company Profile |
SEC
News |
Chart |
Request a new note
C
A N
S L
I M
|
GNRC
-
NYSE
Generac Hldgs Inc
Electrical-Power/Equipmt
|
$58.97
|
+0.86
1.48% |
$59.38
|
484,539
51.06% of 50 DAV
50 DAV is 949,000
|
$62.50
-5.65%
|
2/14/2014
|
$56.50
|
PP = $57.39
|
|
MB = $60.26
|
 Most Recent Note - 3/31/2014 7:00:27 PM
Y - Posted a 2nd consecutive gain today with below average volume after finding support above prior highs in the $57 area again. More damaging losses would raise greater concerns.See the latest FSU analysis for more details and new annotated graphs.
>>> FEATURED STOCK ARTICLE : Perched Near Highs With Mostly Quiet Volume Totals - 3/31/2014
View all notes |
Set NEW NOTE alert |
CANSLIM.net Company Profile |
SEC
News |
Chart |
Request a new note
C
A N
S L
I M
|
ICON
-
NASDAQ
Iconix Brand Group Inc
CONSUMER NON-DURABLES - Textile - Apparel Footwear
|
$39.27
|
-0.01
-0.03% |
$39.41
|
920,886
151.71% of 50 DAV
50 DAV is 607,000
|
$42.47
-7.53%
|
3/7/2014
|
$41.46
|
PP = $40.88
|
|
MB = $42.92
|
Most Recent Note - 3/25/2014 6:07:38 PM
Y - Ended near the session low today with a loss on higher volume, sputtering near prior highs in the $40 area. More damaging losses and deterioration below recent lows ($39.75 on 3/14/14) would raise greater concerns. See the latest FSU analysis for more details and new annotated graphs.
>>> FEATURED STOCK ARTICLE : Falling Back Under Prior Highs Raises Concerns - 3/25/2014
View all notes |
Set NEW NOTE alert |
CANSLIM.net Company Profile |
SEC
News |
Chart |
Request a new note
C
A N
S L
I M
|
Symbol/Exchange
Company Name
Industry Group |
PRICE |
CHANGE
(%Change) |
Day High |
Volume
(% DAV)
(% 50 day avg vol) |
52 Wk Hi
% From Hi |
Featured
Date |
Price
Featured |
Pivot Featured |
|
Max Buy |
KORS
-
NYSE
Michael Kors Hldgs Ltd
RETAIL - Apparel Stores
|
$93.27
|
+0.52
0.56% |
$93.63
|
1,599,778
47.78% of 50 DAV
50 DAV is 3,348,000
|
$101.04
-7.69%
|
3/12/2014
|
$98.03
|
PP = $101.14
|
|
MB = $106.20
|
Most Recent Note - 3/27/2014 6:40:23 PM
G - Color code is changed to green after today's 6th consecutive loss as it slumped below its 50 DMA line. Prior highs in the $84 area define the next support level. See the latest FSU analysis for more details and new annotated graphs.
>>> FEATURED STOCK ARTICLE : Fell Below 50-Day Average Line With 6th Consecutive Loss - 3/27/2014
View all notes |
Set NEW NOTE alert |
CANSLIM.net Company Profile |
SEC
News |
Chart |
Request a new note
C
A N
S L
I M
|
PSIX
-
NASDAQ
Power Solutions Intl Inc
Machinery-Gen Industrial
|
$75.17
|
+3.58
5.00% |
$75.36
|
34,515
50.76% of 50 DAV
50 DAV is 68,000
|
$87.40
-13.99%
|
2/28/2014
|
$74.65
|
PP = $76.93
|
|
MB = $80.78
|
Most Recent Note - 3/31/2014 6:55:27 PM
G - Consolidating just above its 50 DMA line after halting its latest slide near that important short-term average.
>>> FEATURED STOCK ARTICLE : Halted Slide After Undercutting Prior Highs on Pullback - 3/18/2014
View all notes |
Set NEW NOTE alert |
CANSLIM.net Company Profile |
SEC
News |
Chart |
Request a new note
C
A N
S L
I M
|
SILC
-
NASDAQ
Silicom Ltd
COMPUTER HARDWARE - Networking andamp; Communication Dev
|
$62.04
|
+1.75
2.90% |
$62.24
|
84,519
85.37% of 50 DAV
50 DAV is 99,000
|
$73.44
-15.52%
|
12/23/2013
|
$44.62
|
PP = $46.25
|
|
MB = $48.56
|
Most Recent Note - 3/31/2014 6:56:29 PM
G - Still sputtering below its 50 DMA line following a damaging volume-driven loss last week. Only a prompt rebound above that important short-term average would help its outlook improve.
>>> FEATURED STOCK ARTICLE : Traded Up +64.6% in Under 3 Months Since Featured in Mid-Day Report - 3/20/2014
View all notes |
Set NEW NOTE alert |
CANSLIM.net Company Profile |
SEC
News |
Chart |
Request a new note
C
A N
S L
I M
|
VRX
-
NYSE
Valeant Pharmaceuticals
DRUGS - Drug Manufacturers - Other
|
$131.83
|
+4.15
3.25% |
$132.33
|
2,177,454
123.86% of 50 DAV
50 DAV is 1,758,000
|
$153.10
-13.89%
|
9/11/2013
|
$100.26
|
PP = $105.50
|
|
MB = $110.78
|
Most Recent Note - 3/31/2014 6:57:44 PM
G- Still consolidating below its 50 DMA line after damaging losses triggered a technical sell signal. A rebound above the 50 DMA line is needed to help its outlook improve.
>>> FEATURED STOCK ARTICLE : Finding Support Above 50-Day Moving Average Line - 3/17/2014
View all notes |
Set NEW NOTE alert |
CANSLIM.net Company Profile |
SEC
News |
Chart |
Request a new note
C
A N
S L
I M
|
|
|
|
THESE ARE NOT BUY RECOMMENDATIONS!
Comments contained in the body of this report are technical
opinions only. The material herein has been obtained
from sources believed to be reliable and accurate, however,
its accuracy and completeness cannot be guaranteed.
This site is not an investment advisor, hence it does
not endorse or recommend any securities or other investments.
Any recommendation contained in this report may not
be suitable for all investors and it is not to be deemed
an offer or solicitation on our part with respect to
the purchase or sale of any securities. All trademarks,
service marks and trade names appearing in this report
are the property of their respective owners, and are
likewise used for identification purposes only.
This report is a service available
only to active Paid Premium Members.
You may opt-out of receiving report notifications
at any time. Questions or comments may be submitted
by writing to Premium Membership Services 665 S.E. 10 Street, Suite 201 Deerfield Beach, FL 33441-5634 or by calling 1-800-965-8307
or 954-785-1121.
|
|
|

