You are not logged in.
This means you
CAN ONLY VIEW reports that were published prior to Monday, April 14, 2025.
You
MUST UPGRADE YOUR MEMBERSHIP if you want to see any current reports.
AFTER MARKET UPDATE - TUESDAY, MARCH 29TH, 2011
Previous After Market Report Next After Market Report >>>
|
|
|
|
DOW |
+81.13 |
12,279.01 |
+0.67% |
|
Volume |
805,688,350 |
+3% |
|
Volume |
1,571,302,940 |
-4% |
|
NASDAQ |
+26.21 |
2,756.89 |
+0.96% |
|
Advancers |
2,007 |
64% |
|
Advancers |
1,749 |
64% |
|
S&P 500 |
+9.25 |
1,319.44 |
+0.71% |
|
Decliners |
1,012 |
32% |
|
Decliners |
889 |
32% |
|
Russell 2000 |
+7.72 |
829.49 |
+0.94% |
|
52 Wk Highs |
117 |
|
|
52 Wk Highs |
114 |
|
|
S&P 600 |
+3.73 |
438.66 |
+0.86% |
|
52 Wk Lows |
12 |
|
|
52 Wk Lows |
27 |
|
|
 |
Advancers Lead Decliners 2-to-1 as Major Averages Rise Quietly
Kenneth J. Gruneisen - Passed the CAN SLIM® Master's Exam
Volume totals on the NYSE and the Nasdaq exchange were light on Tuesday while trading ticked up slightly on the NYSE, meanwhile the Nasdaq exchange marked a new lowest volume total of this year. Advancing issues beat decliners 2-1 on both the NYSE and the Nasdaq exchange. New 52-week highs outnumbered new 52-week lows on the Nasdaq exchange and on the NYSE. There were 55 high-ranked companies from the CANSLIM.net Leaders List that made new 52-week highs and appeared on the CANSLIM.net BreakOuts Page, down from a total of 59 on the prior session. On the Featured Stocks Page there were gains from 16 of the 20 high-ranked market leaders currently listed.
Economic reports were lackluster. A private survey showed home prices dropped for a seventh straight month in January. March consumer confidence fell as fuel costs surged to the highest in more than two years. S&P downgraded credit of Greece and Portugal, adding to concerns that Europe’s debt crisis will be a drag on the world economy. Investors shrugged off the negative news out of Europe and the weak U.S. economic reports. Treasuries fell as the government sold five-year notes at the highest yields in almost a year.
Retail and tech stocks were leaders. Home Depot Inc (HD +2.86%) rose after saying it would buy back up to $1 billion of its shares. Amazon.com Inc (AMZN +3.11%) traded up after it introduced its new music-streaming service. On the downside, Apollo Group Inc (APOL -4.25%) sank after the education company said new enrollment fell in the second quarter. Lennar Corp (LEN -3.44%) posted a surprise profit, but revenues fell and shares of the homebuilder slid.
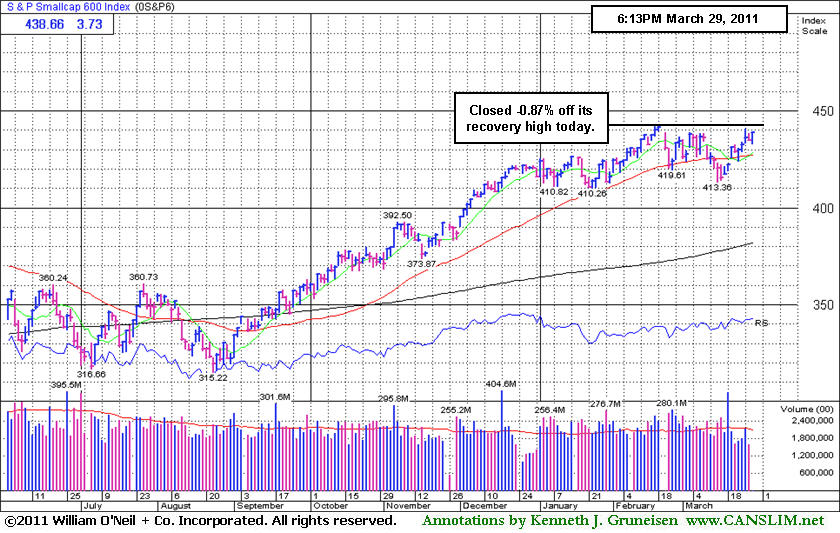
The bullish action in the past week or more did not meet the strict definition of a follow-through day (FTD). However, recent signs of new leadership (increase in new 52-week highs) have suggested that the market has a healthy crop of strong leaders underpinning the latest rally effort. It is also difficult to argue that the major averages are in a "correction" while they all are perched less than -3% from their recovery highs now. The Dow Jones Industrial Average, S&P 500 Index, the S&P Mid-Cap 400 and S&P Small-Cap 600 indexes, and the tech-heavy Nasdaq Composite Index are, collectively, trading above their respective 50-day moving average (DMA) lines. Barring any more damaging distribution days in the near term, investors may be wise to keep a close eye on a watchlist of high-ranked leaders and have a bias toward making new buys whenever all key criteria are met and powerful technical breakouts occur. The usual discipline applies, and losses should always be limited if a stock falls -7% or more from your purchase price.
PICTURED: The S&P Small-Cap 600 Index closed -0.87% off its recovery high.
|
 Kenneth J. Gruneisen started out as a licensed stockbroker in August 1987, a couple of months prior to the historic stock market crash that took the Dow Jones Industrial Average down -22.6% in a single day. He has published daily fact-based fundamental and technical analysis on high-ranked stocks online for two decades. Through FACTBASEDINVESTING.COM, Kenneth provides educational articles, news, market commentary, and other information regarding proven investment systems that work in good times and bad.
Comments contained in the body of this report are technical opinions only and are not necessarily those of Gruneisen Growth Corp. The material herein has been obtained from sources believed to be reliable and accurate, however, its accuracy and completeness cannot be guaranteed. Our firm, employees, and customers may effect transactions, including transactions contrary to any recommendation herein, or have positions in the securities mentioned herein or options with respect thereto. Any recommendation contained in this report may not be suitable for all investors and it is not to be deemed an offer or solicitation on our part with respect to the purchase or sale of any securities. |
|
 |
Healthcare Index Continues Rally To New Recovery Highs
Kenneth J. Gruneisen - Passed the CAN SLIM® Master's Exam
The tech sector indices posted unanimous gains as the Internet Index ($IIX +1.46%), Biotechnology Index ($BTK +1.67%), Networking Index ($NWX +1.29%), and Semiconductor Index ($SOX +0.98%) contributed to the tech-heavy Nasdaq Composite Index's standout gain. Financial shares were mixed and little changed as the Bank Index ($BKX +0.31%) posted a small gain and the Broker/Dealer Index ($XBD -0.34%) suffered a similar sized loss. Gains from the Retail Index ($RLX +1.36%) and the Healthcare Index ($HMO +1.07%) also helped the major averages have a positive bias. The Gold & Silver Index ($XAU -0.03%) ended flat while strength in energy-related shares helped the Oil Services Index ($OSX +1.89%) and Integrated Oil Index ($XOI +0.84%) tally solid gains.
Charts courtesy www.stockcharts.com
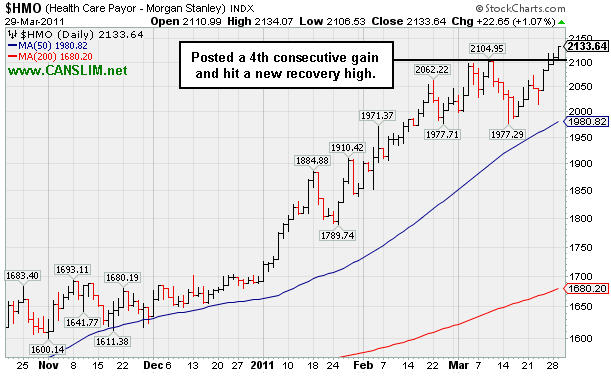
PICTURED: The Healthcare Index ($HMO +1.07%) posted a 4th consecutive gain and hit a new recovery high. In times of economic uncertainty, defensive groups including healthcare companies have typically been a "safe haven" area sought by investors.
| Oil Services |
$OSX |
296.91 |
+5.51 |
+1.89% |
+21.13% |
| Healthcare |
$HMO |
2,133.64 |
+22.65 |
+1.07% |
+26.10% |
| Integrated Oil |
$XOI |
1,372.12 |
+11.40 |
+0.84% |
+13.10% |
| Semiconductor |
$SOX |
441.04 |
+4.29 |
+0.98% |
+7.10% |
| Networking |
$NWX |
328.03 |
+4.19 |
+1.29% |
+16.92% |
| Internet |
$IIX |
315.02 |
+4.52 |
+1.46% |
+2.37% |
| Broker/Dealer |
$XBD |
119.25 |
-0.41 |
-0.34% |
-1.86% |
| Retail |
$RLX |
512.72 |
+6.90 |
+1.36% |
+0.85% |
| Gold & Silver |
$XAU |
211.47 |
-0.07 |
-0.03% |
-6.67% |
| Bank |
$BKX |
51.79 |
+0.16 |
+0.31% |
-0.80% |
| Biotech |
$BTK |
1,325.65 |
+21.73 |
+1.67% |
+2.16% |
|
|
|
 |
Extended From Sound Base, Up +113% In Just Over One Year
Kenneth J. Gruneisen - Passed the CAN SLIM® Master's Exam
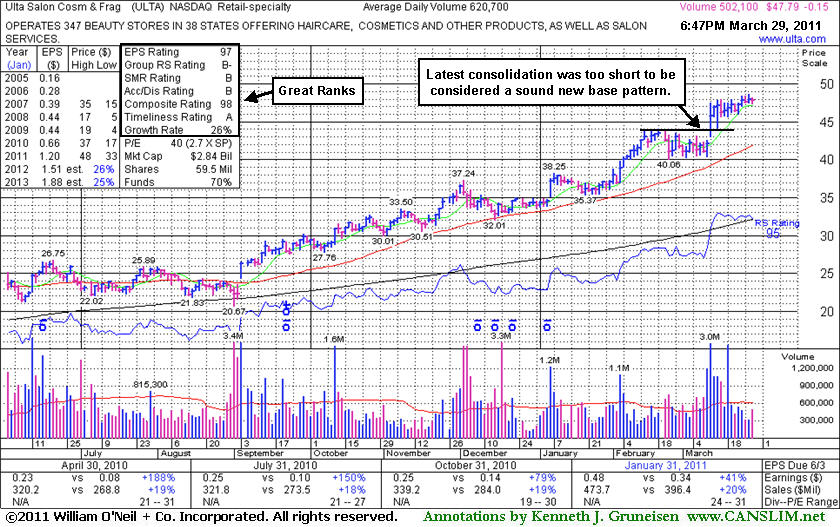
Ulta Salon Cosmetics & Fragrance, Inc. (ULTA -$0.15 or -0.31% to $47.79) quietly touched a new all-time high on the prior session and pulled back today. It has been stubbornly holding its ground after a spurt of volume-driven gains. Since its last appearance in this FSU section on 2/17/11 with an annotated graph and details under the headline, "Extended From Sound Base After Quiet Gains", it has not formed a sound base pattern. Disciplined investors would avoid chasing it, meanwhile it has been repeatedly noted as "extended from a sound base pattern". Initial support to watch is at recent chart highs in the $44 area, and then at its 50-day moving average (DMA) line, a classic chart support level.
Since first featured in yellow in the 3/12/10 mid-day report at $22.81 and (read here) and in a more detailed Stock Bulletin later that afternoon under the headline "Strong Earnings Increases Help Leader Meet Key Criteria", it has traded up as much as +113% in just over one year.
The number of top-rated funds with an ownership interest has grown from 274 funds in Mar '10 to 422 funds as of Dec '10 which is an encouraging sign of increasing institutional interest (the I criteria). Management's 36% ownership stake (after the latest offering) still keeps the company's directors very motivated to look after and build shareholder value. This has strong quarterly earnings increases above the +25% guideline in the 7 latest comparisons (satisfies the C criteria).
|
|
|
Color Codes Explained :
Y - Better candidates highlighted by our
staff of experts.
G - Previously featured
in past reports as yellow but may no longer be buyable under the
guidelines.
***Last / Change / Volume data in this table is the closing quote data***
Symbol/Exchange
Company Name
Industry Group |
PRICE |
CHANGE
(%Change) |
Day High |
Volume
(% DAV)
(% 50 day avg vol) |
52 Wk Hi
% From Hi |
Featured
Date |
Price
Featured |
Pivot Featured |
|
Max Buy |
BIDU
-
NASDAQ
Baidu Inc Ads
INTERNET - Internet Information Providers
|
$136.00
|
+2.33
1.74% |
$136.24
|
5,231,012
75.07% of 50 DAV
50 DAV is 6,968,300
|
$136.49
-0.36%
|
3/17/2011
|
$121.97
|
PP = $131.73
|
|
MB = $138.32
|
 Most Recent Note - 3/29/2011 5:49:04 PM
Y - Up today with lighter than average volume for its best-ever close. Its gain with 2 times average volume on 3/23/11 triggered a technical buy signal after a riskier "late stage" set-up. The M criteria remains a concern until a follow-through day confirms the new rally and justifies new buying efforts under the system's strict guidelines. Prior high near $131 defines initial chart support to watch.
>>> The latest Featured Stock Update with an annotated graph appeared on 3/9/2011. Click here.
View all notes |
Alert me of new notes |
CANSLIM.net Company Profile |
SEC |
Zacks Reports |
StockTalk |
News |
Chart |
Request a new note
C
A N
S L
I M


|
CMG
-
NYSE
Chipotle Mexican Grill
LEISURE - Restaurants
|
$266.12
|
+8.16
3.16% |
$266.54
|
1,167,744
109.15% of 50 DAV
50 DAV is 1,069,900
|
$275.00
-3.23%
|
2/11/2011
|
$271.15
|
PP = $262.87
|
|
MB = $276.01
|
Most Recent Note - 3/29/2011 5:31:43 PM
G - Closed near the session high with a 5th consecutive gain, rising from support at its 50 DMA line for its third highest close with gains this week backed by light or near average volume. Its recent low ($234.48 on 3/02/11) defines another important nearby level for chart readers to watch closely. Subsequent violations and damaging losses would raise greater concerns and trigger technical sell signals.
>>> The latest Featured Stock Update with an annotated graph appeared on 3/14/2011. Click here.
View all notes |
Alert me of new notes |
CANSLIM.net Company Profile |
SEC |
Zacks Reports |
StockTalk |
News |
Chart |
Request a new note
C
A N
S L
I M
|
CTCT
-
NASDAQ
Constant Contact Inc
MEDIA - Advertising Services
|
$34.09
|
+0.71
2.13% |
$34.38
|
674,033
169.61% of 50 DAV
50 DAV is 397,400
|
$36.13
-5.65%
|
3/22/2011
|
$33.59
|
PP = $32.49
|
|
MB = $34.11
|
Most Recent Note - 3/29/2011 5:33:02 PM
Y - Traded up today after early weakness following a worrisome negative reversal previously noted on the prior session. Color code was changed to yellow after the pullback near its "max buy" level. Prior highs in the $32 area define support to watch above its 50 DMA line. Approximately 40% of successful winners pull back and test support at their prior resistance level before continuing higher. Disciplined investors always limit losses if a stock falls more than -7% from their purchase price.
>>> The latest Featured Stock Update with an annotated graph appeared on 3/22/2011. Click here.
View all notes |
Alert me of new notes |
CANSLIM.net Company Profile |
SEC |
Zacks Reports |
StockTalk |
News |
Chart |
Request a new note
C
A N
S L
I M
|
CTSH
-
NASDAQ
Cognizant Tech Sol Cl A
COMPUTER SOFTWARE and SERVICES - Business Software and Services
|
$80.93
|
+1.36
1.71% |
$80.93
|
1,506,296
63.09% of 50 DAV
50 DAV is 2,387,600
|
$81.17
-0.30%
|
2/7/2011
|
$75.09
|
PP = $76.46
|
|
MB = $80.28
|
Most Recent Note - 3/29/2011 5:54:35 PM
G - Held its ground and finished at a best-ever close today. Recent gains helped it hit a new 52-week high (N criteria) , with no resistance remaining due to overhead supply. Color code is changed to green after gains above its "max buy" level without heavy enough volume to trigger a proper technical buy signal. Disciplined investors also know that a follow-through day (FTD) is needed to confirm the market direction (M criteria) is again favorable for new buying efforts.
>>> The latest Featured Stock Update with an annotated graph appeared on 3/17/2011. Click here.
View all notes |
Alert me of new notes |
CANSLIM.net Company Profile |
SEC |
Zacks Reports |
StockTalk |
News |
Chart |
Request a new note
C
A N
S L
I M
|
DECK
-
NASDAQ
Deckers Outdoor Corp
CONSUMER NON-DURABLES - Textile - Apparel Footwear
|
$85.14
|
+1.77
2.12% |
$85.51
|
664,077
45.72% of 50 DAV
50 DAV is 1,452,400
|
$94.70
-10.10%
|
2/3/2011
|
$79.61
|
PP = $82.67
|
|
MB = $86.80
|
Most Recent Note - 3/29/2011 5:39:42 PM
Y - Today's 5th consecutive gain with light volume has it continuing to rebound back above its 50 DMA line. Color code was changed to yellow based on its resilience after slumping below its latest pivot point, but it has not formed a sound new base. Its recent low ($77.71 on 3/21/11) defines the next important chart support level.
>>> The latest Featured Stock Update with an annotated graph appeared on 3/3/2011. Click here.
View all notes |
Alert me of new notes |
CANSLIM.net Company Profile |
SEC |
Zacks Reports |
StockTalk |
News |
Chart |
Request a new note
C
A N
S L
I M
|
Symbol/Exchange
Company Name
Industry Group |
PRICE |
CHANGE
(%Change) |
Day High |
Volume
(% DAV)
(% 50 day avg vol) |
52 Wk Hi
% From Hi |
Featured
Date |
Price
Featured |
Pivot Featured |
|
Max Buy |
EZPW
-
NASDAQ
Ezcorp Inc Cl A
SPECIALTY RETAIL - Specialty Retail, Other
|
$31.10
|
-0.22
-0.70% |
$31.65
|
192,492
49.08% of 50 DAV
50 DAV is 392,200
|
$31.80
-2.20%
|
2/18/2011
|
$27.94
|
PP = $30.04
|
|
MB = $31.54
|
Most Recent Note - 3/29/2011 5:43:24 PM
Y - Volume cooled while pulling back slightly under its "max buy" level, and its color code is changed to yellow. The M criteria remains a concern until a FTD occurs, but recent signs of healthy leadership (new 52-week highs) have been reassuring.
>>> The latest Featured Stock Update with an annotated graph appeared on 3/10/2011. Click here.
View all notes |
Alert me of new notes |
CANSLIM.net Company Profile |
SEC |
Zacks Reports |
StockTalk |
News |
Chart |
Request a new note
C
A N
S L
I M
|
FOSL
-
NASDAQ
Fossil Inc
CONSUMER DURABLES - Recreational Goods, Other
|
$90.05
|
+1.80
2.04% |
$90.18
|
725,502
75.67% of 50 DAV
50 DAV is 958,800
|
$89.42
0.70%
|
2/1/2011
|
$73.30
|
PP = $74.44
|
|
MB = $78.16
|
Most Recent Note - 3/29/2011 5:44:33 PM
G - Up today for a gain with lighter than average volume and another new all-time high, getting more extended from any sound base. Support to watch is at its 50 DMA line.
>>> The latest Featured Stock Update with an annotated graph appeared on 2/24/2011. Click here.
View all notes |
Alert me of new notes |
CANSLIM.net Company Profile |
SEC |
Zacks Reports |
StockTalk |
News |
Chart |
Request a new note
C
A N
S L
I M
|
HMSY
-
NASDAQ
H M S Holdings Corp
COMPUTER SOFTWARE and SERVICES - Healthcare Information Service
|
$82.41
|
+1.08
1.33% |
$82.89
|
186,796
111.85% of 50 DAV
50 DAV is 167,000
|
$83.98
-1.87%
|
11/19/2010
|
$61.89
|
PP = $63.01
|
|
MB = $66.16
|
Most Recent Note - 3/29/2011 5:47:18 PM
G - Gain today with slightly above average volume for its best close ever. It is extended from any sound base pattern. See the latest FSU analysis for additional details and a new annotated graph.
>>> The latest Featured Stock Update with an annotated graph appeared on 3/25/2011. Click here.
View all notes |
Alert me of new notes |
CANSLIM.net Company Profile |
SEC |
Zacks Reports |
StockTalk |
News |
Chart |
Request a new note
C
A N
S L
I M
|
HS
-
NYSE
Healthspring Inc
HEALTH SERVICES - Health Care Plans
|
$36.92
|
+0.07
0.19% |
$37.01
|
890,326
121.08% of 50 DAV
50 DAV is 735,300
|
$39.19
-5.79%
|
3/22/2011
|
$38.29
|
PP = $38.85
|
|
MB = $40.79
|
Most Recent Note - 3/28/2011 7:17:04 PM
G - Held its ground today. Gapped down on 3/25/11 after pricing a new Public Offering of 7.5 million shares, holding its ground near recent lows and well above its 50 DMA line. It failed to convincingly rally for a close above its pivot point after touching a new 52-week high on 3/22/11, and its color code was changed to green after slumping more than -7% below its pivot point.
>>> The latest Featured Stock Update with an annotated graph appeared on 3/23/2011. Click here.
View all notes |
Alert me of new notes |
CANSLIM.net Company Profile |
SEC |
Zacks Reports |
StockTalk |
News |
Chart |
Request a new note
C
A N
S L
I M
|
INFA
-
NASDAQ
Informatica Corp
COMPUTER SOFTWARE and SERVICES - Business Software and Services
|
$50.79
|
+0.34
0.67% |
$51.06
|
680,084
68.82% of 50 DAV
50 DAV is 988,200
|
$51.97
-2.27%
|
3/24/2011
|
$50.04
|
PP = $49.86
|
|
MB = $52.35
|
Most Recent Note - 3/28/2011 7:30:12 PM
Y - Today's loss on lighter volume followed 6 consecutive gains. Prior highs in the $49 area define initial support to watch. See the latest FSU analysis for more details and a new annotated graph.
>>> The latest Featured Stock Update with an annotated graph appeared on 3/28/2011. Click here.
View all notes |
Alert me of new notes |
CANSLIM.net Company Profile |
SEC |
Zacks Reports |
StockTalk |
News |
Chart |
Request a new note
C
A N
S L
I M
|
Symbol/Exchange
Company Name
Industry Group |
PRICE |
CHANGE
(%Change) |
Day High |
Volume
(% DAV)
(% 50 day avg vol) |
52 Wk Hi
% From Hi |
Featured
Date |
Price
Featured |
Pivot Featured |
|
Max Buy |
LULU
-
NASDAQ
Lululemon Athletica
MANUFACTURING - Textile Manufacturing
|
$89.17
|
+3.90
4.57% |
$89.25
|
5,894,050
278.61% of 50 DAV
50 DAV is 2,115,500
|
$86.00
3.69%
|
3/28/2011
|
$68.11
|
PP = $85.38
|
|
MB = $89.65
|
Most Recent Note - 3/29/2011 5:26:34 PM
Y - Gapped up today, rallying to a new all-time high with a considerable volume-driven gain above its pivot point, triggering a new (or add-on) technical buy signal while breaking out above prior resistance following a noted new base-on-base pattern. Its board of directors approved a 2-for-1 stock split (pending). At today's earlier high it traded +87% from when first featured less than 6 months earlier in the 10/08/10 mid-day report (read here) and in that evening's Featured Stock Update section with an annotated graph (read here).
>>> The latest Featured Stock Update with an annotated graph appeared on 2/25/2011. Click here.
View all notes |
Alert me of new notes |
CANSLIM.net Company Profile |
SEC |
Zacks Reports |
StockTalk |
News |
Chart |
Request a new note
C
A N
S L
I M
|
MG
-
NYSE
Mistras Group Inc
DIVERSIFIED SERVICES - Bulding and Faci;ity Management Services
|
$17.14
|
+0.03
0.18% |
$17.19
|
162,477
158.36% of 50 DAV
50 DAV is 102,600
|
$17.23
-0.52%
|
3/15/2011
|
$15.48
|
PP = $15.90
|
|
MB = $16.70
|
Most Recent Note - 3/29/2011 1:10:42 PM
G - It has been stubbornly holding its ground, extended from a sound base pattern. Prior highs and its 50 DMA line define important support to watch on pullbacks.
>>> The latest Featured Stock Update with an annotated graph appeared on 3/15/2011. Click here.
View all notes |
Alert me of new notes |
CANSLIM.net Company Profile |
SEC |
Zacks Reports |
StockTalk |
News |
Chart |
Request a new note
C
A N
S L
I M
|
MWIV
-
NASDAQ
M W I Veterinary Supply
HEALTH SERVICES - Medical Instruments and; Supplies
|
$77.63
|
-0.27
-0.35% |
$77.96
|
71,976
76.57% of 50 DAV
50 DAV is 94,000
|
$78.48
-1.08%
|
11/4/2010
|
$61.79
|
PP = $59.60
|
|
MB = $62.58
|
Most Recent Note - 3/28/2011 3:38:05 PM
G - Gain today has it poised for its second highest close ever. Consolidating in a tight range for the past 3 weeks, extended from any sound base pattern.
>>> The latest Featured Stock Update with an annotated graph appeared on 3/8/2011. Click here.
View all notes |
Alert me of new notes |
CANSLIM.net Company Profile |
SEC |
Zacks Reports |
StockTalk |
News |
Chart |
Request a new note
C
A N
S L
I M
|
OPEN
-
NASDAQ
Opentable Inc
INTERNET - Internet Software and Services
|
$102.92
|
-1.37
-1.31% |
$104.40
|
1,744,398
153.87% of 50 DAV
50 DAV is 1,133,700
|
$106.15
-3.04%
|
3/17/2011
|
$90.71
|
PP = $96.07
|
|
MB = $100.87
|
Most Recent Note - 3/29/2011 1:13:29 PM
G - Pulling back today after a streak of 6 consecutive gains to new all-time highs. It is still above the previously cited "max buy" level, extended from its recently noted new base. Its prior high near $96 defines initial support to watch following its latest technical breakout.
>>> The latest Featured Stock Update with an annotated graph appeared on 3/24/2011. Click here.
View all notes |
Alert me of new notes |
CANSLIM.net Company Profile |
SEC |
Zacks Reports |
StockTalk |
News |
Chart |
Request a new note
C
A N
S L
I M
|
PAY
-
NYSE
Verifone Systems Inc
COMPUTER HARDWARE - Transaction Automation Systems
|
$56.50
|
+1.62
2.95% |
$56.64
|
1,751,260
92.87% of 50 DAV
50 DAV is 1,885,800
|
$56.00
0.89%
|
1/27/2011
|
$41.77
|
PP = $44.97
|
|
MB = $47.22
|
Most Recent Note - 3/29/2011 5:36:13 PM
G - Up again today with below average volume, quietly rising for another new all-time high and closing near the session high. Repeatedly noted - "No resistance remains due to overhead supply, but it is extended from a sound base pattern. Its 50 DMA line defines chart support to watch."
>>> The latest Featured Stock Update with an annotated graph appeared on 3/2/2011. Click here.
View all notes |
Alert me of new notes |
CANSLIM.net Company Profile |
SEC |
Zacks Reports |
StockTalk |
News |
Chart |
Request a new note
C
A N
S L
I M
|
Symbol/Exchange
Company Name
Industry Group |
PRICE |
CHANGE
(%Change) |
Day High |
Volume
(% DAV)
(% 50 day avg vol) |
52 Wk Hi
% From Hi |
Featured
Date |
Price
Featured |
Pivot Featured |
|
Max Buy |
PCLN
-
NASDAQ
Priceline.Com Inc
INTERNET - Internet Software and Services
|
$491.69
|
+7.70
1.59% |
$493.44
|
981,828
83.82% of 50 DAV
50 DAV is 1,171,400
|
$491.36
0.07%
|
1/3/2011
|
$399.55
|
PP = $428.20
|
|
MB = $449.61
|
Most Recent Note - 3/29/2011 5:37:13 PM
G - Rose to a new 52-week high today with below average volume behind its gain, getting extended from any sound base pattern. Its 50 DMA line has defined support.
>>> The latest Featured Stock Update with an annotated graph appeared on 3/21/2011. Click here.
View all notes |
Alert me of new notes |
CANSLIM.net Company Profile |
SEC |
Zacks Reports |
StockTalk |
News |
Chart |
Request a new note
C
A N
S L
I M
|
RAX
-
NYSE
Rackspace Hosting Inc
INTERNET - Internet Software and; Services
|
$39.71
|
+0.91
2.35% |
$40.31
|
2,362,177
132.27% of 50 DAV
50 DAV is 1,785,900
|
$40.62
-2.24%
|
3/16/2011
|
$36.28
|
PP = $40.72
|
|
MB = $42.76
|
Most Recent Note - 3/29/2011 5:38:51 PM
Y - Gain with +32% above average volume today for its second best close ever. Approaching its 52-week high and pivot point on the right side of an orderly 7-week flat base after finding support at its 50 DMA line. This high-ranked leader has strong fundamental and technical characteristics, and a breakout with volume may trigger a buy signal, however the M criteria is still an overriding concern.
>>> The latest Featured Stock Update with an annotated graph appeared on 3/16/2011. Click here.
View all notes |
Alert me of new notes |
CANSLIM.net Company Profile |
SEC |
Zacks Reports |
StockTalk |
News |
Chart |
Request a new note
C
A N
S L
I M
|
TIBX
-
NASDAQ
Tibco Software Inc
COMPUTER SOFTWARE and SERVICES - Business Software and Services
|
$26.27
|
+0.14
0.54% |
$26.99
|
5,317,217
219.75% of 50 DAV
50 DAV is 2,419,700
|
$26.77
-1.87%
|
3/18/2011
|
$23.88
|
PP = $26.04
|
|
MB = $27.34
|
Most Recent Note - 3/29/2011 1:49:48 PM
Y - Touched a new 52-week high today. It is clear of all resistance due to overhead supply. A convincing gain and close above its pivot point with at least the minimum above average volume may trigger a proper technical buy signal. The M criteria remains a concern for disciplined investors, but stronger leadership (stocks hitting new 52 week highs) has recently been a reassuring sign.
>>> The latest Featured Stock Update with an annotated graph appeared on 3/18/2011. Click here.
View all notes |
Alert me of new notes |
CANSLIM.net Company Profile |
SEC |
Zacks Reports |
StockTalk |
News |
Chart |
Request a new note
C
A N
S L
I M
|
UA
-
NYSE
Under Armour Inc Cl A
CONSUMER NON-DURABLES - Textile - Apparel Clothing
|
$68.32
|
+3.21
4.93% |
$68.77
|
1,161,987
144.71% of 50 DAV
50 DAV is 803,000
|
$70.69
-3.35%
|
1/27/2011
|
$58.31
|
PP = $56.99
|
|
MB = $59.84
|
Most Recent Note - 3/29/2011 5:23:20 PM
G - Posted a considerable gain with above average volume, rallying from its 50 DMA line and recent lows defining important chart support. It may be forming a base-on-base pattern, but more damaging losses would hurt its outlook.
>>> The latest Featured Stock Update with an annotated graph appeared on 3/7/2011. Click here.
View all notes |
Alert me of new notes |
CANSLIM.net Company Profile |
SEC |
Zacks Reports |
StockTalk |
News |
Chart |
Request a new note
C
A N
S L
I M
|
ULTA
-
NASDAQ
Ulta Salon Cosm & Frag
SPECIALTY RETAIL - Specialty Retail, Other
|
$47.79
|
-0.15
-0.31% |
$48.14
|
507,978
81.84% of 50 DAV
50 DAV is 620,700
|
$48.67
-1.81%
|
1/6/2011
|
$36.12
|
PP = $37.34
|
|
MB = $39.21
|
Most Recent Note - 3/29/2011 7:21:00 PM
G - Quietly touched a new all-time high on the prior session and pulled back today. It has been stubbornly holding its ground after a spurt of volume-driven gains. See the latest FSU analysis for more details and a new annotated graph.
>>> The latest Featured Stock Update with an annotated graph appeared on 3/29/2011. Click here.
View all notes |
Alert me of new notes |
CANSLIM.net Company Profile |
SEC |
Zacks Reports |
StockTalk |
News |
Chart |
Request a new note
C
A N
S L
I M
|
Symbol/Exchange
Company Name
Industry Group |
PRICE |
CHANGE
(%Change) |
Day High |
Volume
(% DAV)
(% 50 day avg vol) |
52 Wk Hi
% From Hi |
Featured
Date |
Price
Featured |
Pivot Featured |
|
Max Buy |
|
|
|
THESE ARE NOT BUY RECOMMENDATIONS!
Comments contained in the body of this report are technical
opinions only. The material herein has been obtained
from sources believed to be reliable and accurate, however,
its accuracy and completeness cannot be guaranteed.
This site is not an investment advisor, hence it does
not endorse or recommend any securities or other investments.
Any recommendation contained in this report may not
be suitable for all investors and it is not to be deemed
an offer or solicitation on our part with respect to
the purchase or sale of any securities. All trademarks,
service marks and trade names appearing in this report
are the property of their respective owners, and are
likewise used for identification purposes only.
This report is a service available
only to active Paid Premium Members.
You may opt-out of receiving report notifications
at any time. Questions or comments may be submitted
by writing to Premium Membership Services 665 S.E. 10 Street, Suite 201 Deerfield Beach, FL 33441-5634 or by calling 1-800-965-8307
or 954-785-1121.
|
|
|

