You are not logged in.
This means you
CAN ONLY VIEW reports that were published prior to Monday, April 14, 2025.
You
MUST UPGRADE YOUR MEMBERSHIP if you want to see any current reports.
AFTER MARKET UPDATE - WEDNESDAY, MARCH 26TH, 2014
Previous After Market Report Next After Market Report >>>
|
|
|
|
DOW |
-98.89 |
16,268.99 |
-0.60% |
|
Volume |
738,239,040 |
+17% |
|
Volume |
2,291,867,690 |
+8% |
|
NASDAQ |
-60.57 |
4,173.70 |
-1.43% |
|
Advancers |
1,029 |
33% |
|
Advancers |
588 |
20% |
|
S&P 500 |
-13.06 |
1,852.56 |
-0.70% |
|
Decliners |
2,045 |
65% |
|
Decliners |
2,247 |
78% |
|
Russell 2000 |
-22.56 |
1,155.49 |
-1.92% |
|
52 Wk Highs |
91 |
|
|
52 Wk Highs |
52 |
|
|
S&P 600 |
-11.58 |
659.97 |
-1.72% |
|
52 Wk Lows |
29 |
|
|
52 Wk Lows |
33 |
|
|
 |
Major Averages Erased Gains For Losses as Volumes Increased
Kenneth J. Gruneisen - Passed the CAN SLIM® Master's Exam
Stocks erased early gains and finished lower on Wednesday. The volume totals were reported higher on the NYSE and on the Nasdaq exchange, and coupled with the weak finish, the action showed that the institutional crowd was responsible for the selling pressure. Decliners led advancers by a 2-1 margin on the NYSE and by more than 3-1 on the Nasdaq exchange. There were 17 high-ranked companies from the CANSLIM.net Leaders List that made new 52-week highs and appeared on the CANSLIM.net BreakOuts Page, down from the total of 19 stocks on the prior session. The list of stocks hitting new 52-week highs outnumbered new 52-week lows on the Nasdaq exchange and on the NYSE. A gain was posted by only 1 of the 10 high-ranked companies currently included on the Featured Stocks Page. The Market (M criteria) uptrend faced some recent pressure and yet the rally has continued. For any rally to be sustained it is critical for there to be healthy leadership, so it remains crucial for many stocks to continue hitting new 52-week highs.
The Dow fell 99 points to 16,268 after rising as much as 98 points. The S&P 500 gave up an increase of 10 points, closing with a loss of 13 points to 1,852. The NASDAQ declined 60 points to 4,173. Concerns surrounding the situation in Ukraine caused equities to reverse course. President Obama called for greater sanctions against Russia and military preparedness in response to the annexation of Crimea. As a result, a better-than-expected report on durable goods orders was overshadowed despite bookings increasing by 2.2% in February.
Eight of the 10 S&P 500 sectors declined. Materials paced the retreat and Newmont Mining (NEM -3.7%) fell as the price of copper fell from a two-week high. Losses in technology also weighed on the market. Facebook (FB -6.6%) violated its 50-day moving average line with a damaging volume-driven loss as it announced its acquisition of virtual reality company Oculus. The health care sector helped limit losses. Quest Diagnostics (DGX +5.5%) jumped after the House proposed a bill that would provide Medicare reimbursement relief for lab testing.
Treasury prices gained ground and a government auction of five-year notes received better than anticipated demand. The 10-year note gained 17/32 to yield 2.69%. The 30-year bond was up a full point to yield 3.54%.
The CANSLIM.net Featured Stocks Page shows the most action-worthy candidates and their latest notes and a Headline Link directs members to the latest detailed analysis with data-packed graphs annotated by a Certified expert along with links to additional resources. The Premium Member Homepage includes "dynamic archives" to all prior pay reports published. Watch for an announcement via email concerning the next WEBCAST.
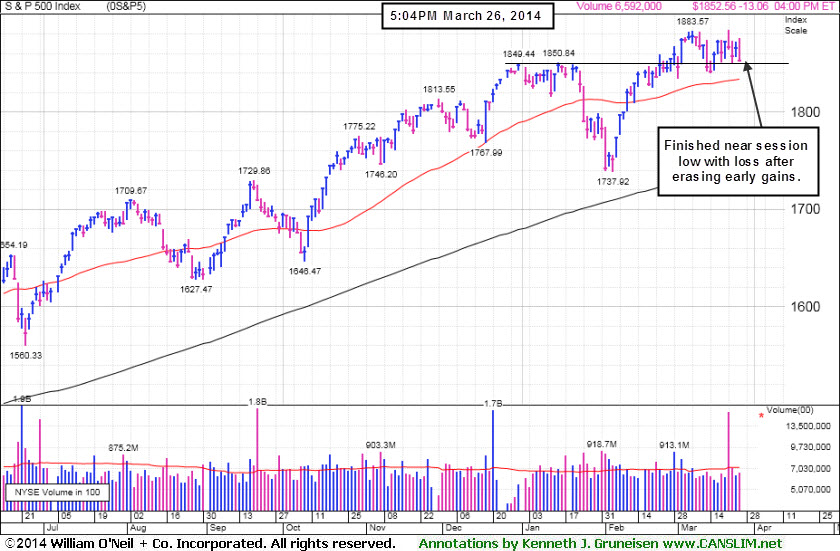
PICTURED: The S&P 500 Index erased early gains and finished near the session low with losses and higher volume totals - action which is typical of a bearish market environment. It is consolidating consolidating only -1.66% off Friday's high when there was a negative reversal. Trading near prior highs and above its 50-day moving average (DMA) line where subsequent deterioration would raise more serious concerns..
|
 Kenneth J. Gruneisen started out as a licensed stockbroker in August 1987, a couple of months prior to the historic stock market crash that took the Dow Jones Industrial Average down -22.6% in a single day. He has published daily fact-based fundamental and technical analysis on high-ranked stocks online for two decades. Through FACTBASEDINVESTING.COM, Kenneth provides educational articles, news, market commentary, and other information regarding proven investment systems that work in good times and bad.
Comments contained in the body of this report are technical opinions only and are not necessarily those of Gruneisen Growth Corp. The material herein has been obtained from sources believed to be reliable and accurate, however, its accuracy and completeness cannot be guaranteed. Our firm, employees, and customers may effect transactions, including transactions contrary to any recommendation herein, or have positions in the securities mentioned herein or options with respect thereto. Any recommendation contained in this report may not be suitable for all investors and it is not to be deemed an offer or solicitation on our part with respect to the purchase or sale of any securities. |
|
 |
Widespread Weakness Weighed on All Groups
Kenneth J. Gruneisen - Passed the CAN SLIM® Master's Exam
Financial shares weighed on the major averages on Wednesday's session as the Broker/Dealer Index ($XBD -1.74%) and the Bank Index ($BKX -0.89%) both fell. The Gold & Silver Index ($XAU -3.91%) was a standout decliner. The tech sector saw unanimous losses as the Biotechnology Index ($BTK -1.91%), Networking Index ($NWX -1.46%), and the Semiconductor Index ($SOX -1.11%) fell. The Retail Index ($RLX -1.25%) also slumped, and weakness in energy-related shares rounded out the mostly negative session as the Oil Services Index ($OSX -0.93%) and the Integrated Oil Index ($XOI -0.25%) fell.
Charts courtesy www.stockcharts.com
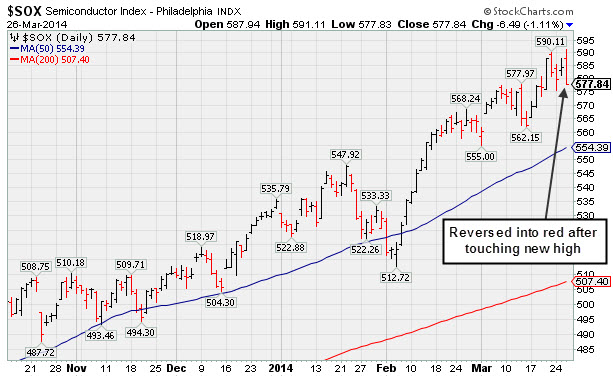
PICTURED: The Semiconductor Index ($SOX -1.11%) reversed into the red after touching a new 52-week high.
| Oil Services |
$OSX |
281.72 |
-2.65 |
-0.93% |
+0.25% |
| Integrated Oil |
$XOI |
1,485.21 |
-3.71 |
-0.25% |
-1.19% |
| Semiconductor |
$SOX |
577.84 |
-6.49 |
-1.11% |
+8.00% |
| Networking |
$NWX |
334.83 |
-4.97 |
-1.46% |
+3.36% |
| Broker/Dealer |
$XBD |
158.78 |
-2.82 |
-1.74% |
-1.11% |
| Retail |
$RLX |
887.18 |
-11.23 |
-1.25% |
-5.60% |
| Gold & Silver |
$XAU |
90.82 |
-3.70 |
-3.91% |
+7.93% |
| Bank |
$BKX |
72.01 |
-0.65 |
-0.89% |
+3.97% |
| Biotech |
$BTK |
2,565.94 |
-49.89 |
-1.91% |
+10.11% |
|
|
|
 |
Technical Deterioration Raised Concerns
Kenneth J. Gruneisen - Passed the CAN SLIM® Master's Exam
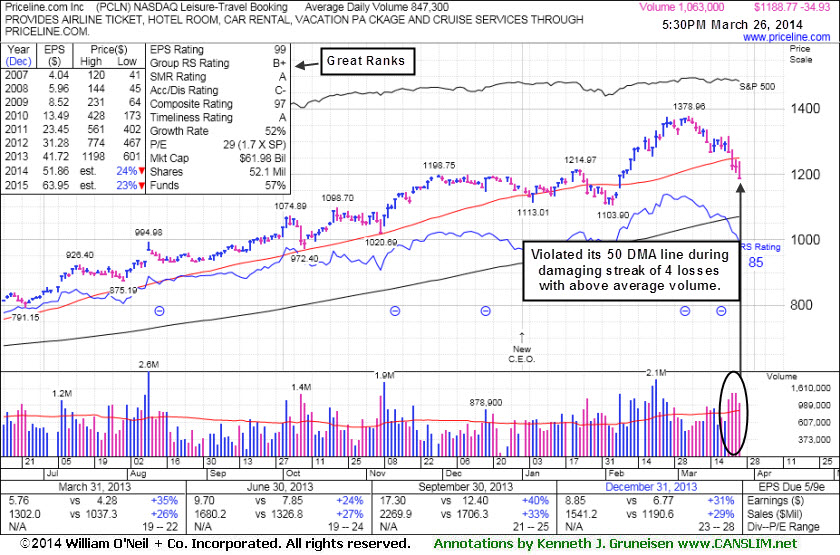
Priceline.com Inc (PCLN -$34.93 or -2.85% to $1,188.77) has seen its technical stance deteriorating quickly as during its streak of 4 consecutive losses with above average volume violated its 50-day moving average (DMA) line. The weak action has been indicative of distributional pressure. Its small supply of only 52.1 million outstanding shares (S criteria) can contribute to price volatility in the event of institutional buying or selling. Disciplined investors avoid chasing extended stocks and always sell if any stock falls more than -7% from their purchase price. PCLN was last shown in this FSU section on 3/10/14 with annotated graphs under the headline, "Perched At Highs With Volume Totals Cooling", while stubbornly holding its ground.
A prompt rebound above the 50 DMA line is needed to help its stance improve. Meanwhile, the stock faces resistance due to overhead supply up through the $1,378 level now if attempting to rebound or ever resume the prior rally. Fresh breakouts make superior buy candidates because they can rally unhindered by overhead supply.
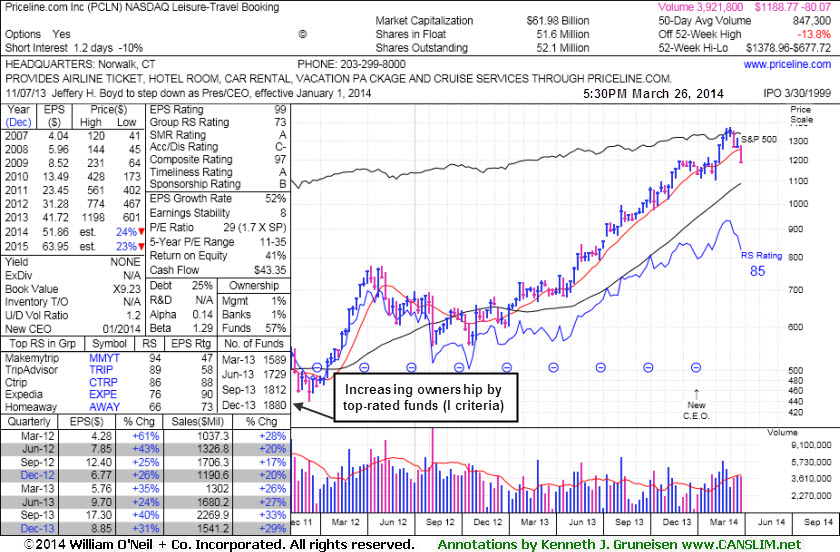
The Leisure - Travel Booking firm has earned great ranks, including the highest possible rating of 99 for earnings Per Share (EPS). Its strong annual earnings history satisfies the A criteria. PCLN reported earnings +31% on +29% sales revenues for the quarter ended December 31, 2013, a 2nd quarterly earnings comparison above the +25% minimum earnings guideline (C criteria) after a slightly sub par Jun '13 report. Keep in mind, the investment system's biggest winning models were typically held by at least a few mutual funds and attracting many others. However, once a stock is very heavily owned by a long list of mutual funds, as is now the case with PCLN, investors should be especially cautious and alert for any technical sell signals or fundamental disappointments which could prompt a rush for the exits. The number of top-rated funds owning its shares rose from 1,594 in Mar '13 to 1,880 in Dec '13, and increasing interest is an encouraging sign concerning the I criteria.
|
|
|
Color Codes Explained :
Y - Better candidates highlighted by our
staff of experts.
G - Previously featured
in past reports as yellow but may no longer be buyable under the
guidelines.
***Last / Change / Volume data in this table is the closing quote data***
Symbol/Exchange
Company Name
Industry Group |
PRICE |
CHANGE
(%Change) |
Day High |
Volume
(% DAV)
(% 50 day avg vol) |
52 Wk Hi
% From Hi |
Featured
Date |
Price
Featured |
Pivot Featured |
|
Max Buy |
EQM
-
NYSE
E Q T Midstream Partners
ENERGY - Oil and Gas Pipelines
|
$68.90
|
+0.50
0.73% |
$69.08
|
116,304
110.77% of 50 DAV
50 DAV is 105,000
|
$69.66
-1.09%
|
12/12/2013
|
$53.17
|
PP = $56.51
|
|
MB = $59.34
|
Most Recent Note - 3/21/2014 7:58:05 PM
G - Posted a gain today for a best-ever close. Held its ground since reporting earnings -2% on +22% sales revenues for the Dec '13 quarter, below the +25% minimum earnings guideline (C criteria), raising fundamental concerns. Its 50 DMA line defines near-term support where a violation may trigger a technical sell signal. See the latest FSU analysis for more details and new annotated graphs.
>>> FEATURED STOCK ARTICLE : Hit New Highs But Fundamental Concerns Remain - 3/21/2014
View all notes |
Set NEW NOTE alert |
CANSLIM.net Company Profile |
SEC
News |
Chart |
Request a new note
C
A N
S L
I M


|
FB
-
NASDAQ
Facebook Inc Cl A
INTERNET
|
$60.39
|
-4.51
-6.94% |
$64.95
|
97,105,226
166.01% of 50 DAV
50 DAV is 58,495,000
|
$72.59
-16.81%
|
12/12/2013
|
$51.40
|
PP = $54.93
|
|
MB = $57.68
|
 Most Recent Note - 3/26/2014 1:51:34 PM
G - Violating its 50 DMA line and undercutting Monday's low today with a damaging loss raising concerns and triggering a technical sell signal. Only a prompt rebound above that important short term average would help its outlook improve.
>>> FEATURED STOCK ARTICLE : Pulling Back After Getting Extended From Prior Base - 3/14/2014
View all notes |
Set NEW NOTE alert |
CANSLIM.net Company Profile |
SEC
News |
Chart |
Request a new note
C
A N
S L
I M
|
FLT
-
NYSE
Fleetcor Technologies
DIVERSIFIED SERVICES - Business/Management Services
|
$114.27
|
-1.11
-0.96% |
$116.99
|
638,902
54.08% of 50 DAV
50 DAV is 1,181,500
|
$132.22
-13.58%
|
3/5/2014
|
$125.40
|
PP = $124.06
|
|
MB = $130.26
|
Most Recent Note - 3/26/2014 5:56:18 PM
G - Failing to find support, it quietly has slumped below its 50 DMA line and its color code is changed to green. Relative Strength rating has slumped to 75, below the 80+ minimum guideline for buy candidates.
>>> FEATURED STOCK ARTICLE : Negated Recent Breakout and Testing Support at 50-Day Average - 3/24/2014
View all notes |
Set NEW NOTE alert |
CANSLIM.net Company Profile |
SEC
News |
Chart |
Request a new note
C
A N
S L
I M
|
GNRC
-
NYSE
Generac Hldgs Inc
Electrical-Power/Equipmt
|
$57.90
|
-1.63
-2.74% |
$60.26
|
521,992
54.95% of 50 DAV
50 DAV is 950,000
|
$62.50
-7.36%
|
2/14/2014
|
$56.50
|
PP = $57.39
|
|
MB = $60.26
|
Most Recent Note - 3/26/2014 5:53:57 PM
Y - Ended near the session low today with a loss on below average volume. Trading near prior highs in the $57 area defining near-term support to watch.
>>> FEATURED STOCK ARTICLE : Bullish Gap Up Followed By Wedging and Stalling Action - 3/11/2014
View all notes |
Set NEW NOTE alert |
CANSLIM.net Company Profile |
SEC
News |
Chart |
Request a new note
C
A N
S L
I M
|
ICON
-
NASDAQ
Iconix Brand Group Inc
CONSUMER NON-DURABLES - Textile - Apparel Footwear
|
$39.59
|
-0.31
-0.78% |
$40.25
|
370,166
58.94% of 50 DAV
50 DAV is 628,000
|
$42.47
-6.77%
|
3/7/2014
|
$41.46
|
PP = $40.88
|
|
MB = $42.92
|
Most Recent Note - 3/25/2014 6:07:38 PM
Y - Ended near the session low today with a loss on higher volume, sputtering near prior highs in the $40 area. More damaging losses and deterioration below recent lows ($39.75 on 3/14/14) would raise greater concerns. See the latest FSU analysis for more details and new annotated graphs.
>>> FEATURED STOCK ARTICLE : Falling Back Under Prior Highs Raises Concerns - 3/25/2014
View all notes |
Set NEW NOTE alert |
CANSLIM.net Company Profile |
SEC
News |
Chart |
Request a new note
C
A N
S L
I M
|
Symbol/Exchange
Company Name
Industry Group |
PRICE |
CHANGE
(%Change) |
Day High |
Volume
(% DAV)
(% 50 day avg vol) |
52 Wk Hi
% From Hi |
Featured
Date |
Price
Featured |
Pivot Featured |
|
Max Buy |
KORS
-
NYSE
Michael Kors Hldgs Ltd
RETAIL - Apparel Stores
|
$92.04
|
-1.40
-1.50% |
$94.28
|
2,539,608
75.07% of 50 DAV
50 DAV is 3,383,000
|
$101.04
-8.91%
|
3/12/2014
|
$98.03
|
PP = $101.14
|
|
MB = $106.20
|
Most Recent Note - 3/26/2014 5:57:54 PM
Y - Down today for a 5th consecutive loss, ending near its 50 DMA line ($91.87) defining support above prior highs in the $84 area.
>>> FEATURED STOCK ARTICLE : Formed Advanced Base Pattern With Volume Totals Cooling - 3/12/2014
View all notes |
Set NEW NOTE alert |
CANSLIM.net Company Profile |
SEC
News |
Chart |
Request a new note
C
A N
S L
I M
|
PCLN
-
NASDAQ
Priceline.com Inc
INTERNET - Internet Software and Services
|
$1,188.77
|
-34.93
-2.85% |
$1,240.00
|
1,060,752
125.24% of 50 DAV
50 DAV is 847,000
|
$1,378.96
-13.79%
|
12/18/2013
|
$1,156.20
|
PP = $1,198.85
|
|
MB = $1,258.79
|
Most Recent Note - 3/26/2014 5:50:54 PM
G - Sank further below its 50 DMA line with today's 4th consecutive loss with above average volume, action indicative of distributional pressure. See the latest FSU analysis for more details and new annotated graphs.
>>> FEATURED STOCK ARTICLE : Technical Deterioration Raised Concerns - 3/26/2014
View all notes |
Set NEW NOTE alert |
CANSLIM.net Company Profile |
SEC
News |
Chart |
Request a new note
C
A N
S L
I M
|
PSIX
-
NASDAQ
Power Solutions Intl Inc
Machinery-Gen Industrial
|
$71.96
|
-3.24
-4.31% |
$75.97
|
82,318
124.72% of 50 DAV
50 DAV is 66,000
|
$87.40
-17.66%
|
2/28/2014
|
$74.65
|
PP = $76.93
|
|
MB = $80.78
|
Most Recent Note - 3/26/2014 5:52:46 PM
Y - Down today for a 4th consecutive loss, sinking further into the prior base and raising concerns while testing support at its 50 DMA line. More damaging losses would raise serious concerns.
>>> FEATURED STOCK ARTICLE : Halted Slide After Undercutting Prior Highs on Pullback - 3/18/2014
View all notes |
Set NEW NOTE alert |
CANSLIM.net Company Profile |
SEC
News |
Chart |
Request a new note
C
A N
S L
I M
|
SILC
-
NASDAQ
Silicom Ltd
COMPUTER HARDWARE - Networking andamp; Communication Dev
|
$58.88
|
-9.79
-14.26% |
$69.23
|
381,663
419.41% of 50 DAV
50 DAV is 91,000
|
$73.44
-19.83%
|
12/23/2013
|
$44.62
|
PP = $46.25
|
|
MB = $48.56
|
Most Recent Note - 3/26/2014 1:17:58 PM
G - Violated its 50 DMA line today with a damaging volume-driven loss raising concerns and triggering a technical sell signal. Only a prompt rebound above that important short-term average would help its outlook improve. Previously noted - "Extended from any sound base."
>>> FEATURED STOCK ARTICLE : Traded Up +64.6% in Under 3 Months Since Featured in Mid-Day Report - 3/20/2014
View all notes |
Set NEW NOTE alert |
CANSLIM.net Company Profile |
SEC
News |
Chart |
Request a new note
C
A N
S L
I M
|
VRX
-
NYSE
Valeant Pharmaceuticals
DRUGS - Drug Manufacturers - Other
|
$129.07
|
-2.46
-1.87% |
$133.47
|
2,473,767
145.43% of 50 DAV
50 DAV is 1,701,000
|
$153.10
-15.70%
|
9/11/2013
|
$100.26
|
PP = $105.50
|
|
MB = $110.78
|
Most Recent Note - 3/26/2014 1:56:35 PM
G- Slumping further below its 50 DMA line and below Monday's lows today. Damaging losses were recently noted as weakness triggered a technical sell signal.
>>> FEATURED STOCK ARTICLE : Finding Support Above 50-Day Moving Average Line - 3/17/2014
View all notes |
Set NEW NOTE alert |
CANSLIM.net Company Profile |
SEC
News |
Chart |
Request a new note
C
A N
S L
I M
|
Symbol/Exchange
Company Name
Industry Group |
PRICE |
CHANGE
(%Change) |
Day High |
Volume
(% DAV)
(% 50 day avg vol) |
52 Wk Hi
% From Hi |
Featured
Date |
Price
Featured |
Pivot Featured |
|
Max Buy |
|
|
|
THESE ARE NOT BUY RECOMMENDATIONS!
Comments contained in the body of this report are technical
opinions only. The material herein has been obtained
from sources believed to be reliable and accurate, however,
its accuracy and completeness cannot be guaranteed.
This site is not an investment advisor, hence it does
not endorse or recommend any securities or other investments.
Any recommendation contained in this report may not
be suitable for all investors and it is not to be deemed
an offer or solicitation on our part with respect to
the purchase or sale of any securities. All trademarks,
service marks and trade names appearing in this report
are the property of their respective owners, and are
likewise used for identification purposes only.
This report is a service available
only to active Paid Premium Members.
You may opt-out of receiving report notifications
at any time. Questions or comments may be submitted
by writing to Premium Membership Services 665 S.E. 10 Street, Suite 201 Deerfield Beach, FL 33441-5634 or by calling 1-800-965-8307
or 954-785-1121.
|
|
|

