***Last / Change / Volume data in this table is the closing quote data***
Symbol/Exchange
Company Name
Industry Group |
PRICE |
CHANGE
(%Change) |
Day High |
Volume
(% DAV)
(% 50 day avg vol) |
52 Wk Hi
% From Hi |
Featured
Date |
Price
Featured |
Pivot Featured |
|
Max Buy |
ACN
-
NYSE
Accenture Plc
DIVERSIFIED SERVICES - Business/Management Services
|
$65.89
|
+1.01
1.56% |
$65.89
|
4,204,875
118.73% of 50 DAV
50 DAV is 3,541,600
|
$64.90
1.53%
|
3/23/2012
|
$64.13
|
PP = $63.76
|
|
MB = $66.95
|
Most Recent Note - 3/23/2012 8:55:59 PM
Y - Featured in yellow in the earlier mid-day report (read here) with a pivot point cited based on its 7/07/11 high plus 10 cents. Its convincing finish with a volume-driven gain above the pivot point was backed by +88% above average volume as it clinched a new (or add-on) technical buy signal. See the latest FSU analysis for more details and a new annotated graph.
>>> The latest Featured Stock Update with an annotated graph appeared on 3/23/2012. Click here.
View all notes |
Alert me of new notes |
CANSLIM.net Company Profile |
SEC |
Zacks Reports |
StockTalk |
News |
Chart |
Request a new note
C
A N
S L
I M


|
ADS
-
NYSE
Alliance Data Sys Corp
COMPUTER SOFTWARE and SERVICES - Information and Delivery Service
|
$126.24
|
+0.26
0.21% |
$127.09
|
394,487
60.49% of 50 DAV
50 DAV is 652,100
|
$126.56
-0.25%
|
1/17/2012
|
$108.24
|
PP = $107.43
|
|
MB = $112.80
|
Most Recent Note - 3/20/2012 4:30:28 PM
G - Perched near its all-time high, extended from any sound base pattern. Fundamental concerns were raised by earnings reported +9%, well below the +25% minimum guideline in the latest quarter ended December 31, 2011.
>>> The latest Featured Stock Update with an annotated graph appeared on 2/29/2012. Click here.
View all notes |
Alert me of new notes |
CANSLIM.net Company Profile |
SEC |
Zacks Reports |
StockTalk |
News |
Chart |
Request a new note
C
A N
S L
I M
|
ALLT
-
NASDAQ
Allot Communications Ltd
COMPUTER SOFTWARE andamp; SERVICES - Technical andamp; System Software
|
$21.95
|
+0.67
3.15% |
$22.04
|
470,503
134.05% of 50 DAV
50 DAV is 351,000
|
$21.72
1.06%
|
3/13/2012
|
$19.72
|
PP = $18.91
|
|
MB = $19.86
|
 Most Recent Note - 3/26/2012 10:26:57 PM
G - Hit another new 52-week high today with a gain on +34% above average volume, getting more extended from its prior base. Disciplined investors do not chase extended stocks and always limit losses if ever any stock falls more than -7% from their purchase price. Prior highs near $18-19 define initial support to watch on pullbacks.
>>> The latest Featured Stock Update with an annotated graph appeared on 3/19/2012. Click here.
View all notes |
Alert me of new notes |
CANSLIM.net Company Profile |
SEC |
Zacks Reports |
StockTalk |
News |
Chart |
Request a new note
C
A N
S L
I M
|
ALXN
-
NASDAQ
Alexion Pharmaceuticals
DRUGS - Drug Manufacturers - Other
|
$94.31
|
+0.49
0.52% |
$95.01
|
1,259,397
101.43% of 50 DAV
50 DAV is 1,241,700
|
$94.90
-0.62%
|
3/12/2012
|
$87.87
|
PP = $87.73
|
|
MB = $92.12
|
Most Recent Note - 3/21/2012 6:19:16 PM
G - Hit another new all-time high with today's gain backed by +37% above average volume and its color code is changed to green after closing above its "max buy" level. Support to watch on pullbacks is its 50 DMA line.
>>> The latest Featured Stock Update with an annotated graph appeared on 2/24/2012. Click here.
View all notes |
Alert me of new notes |
CANSLIM.net Company Profile |
SEC |
Zacks Reports |
StockTalk |
News |
Chart |
Request a new note
C
A N
S L
I M
|
BODY
-
NASDAQ
Body Central Corp
RETAIL - Catalog andamp; Mail Order Houses
|
$27.79
|
+0.96
3.58% |
$28.08
|
96,486
44.69% of 50 DAV
50 DAV is 215,900
|
$29.49
-5.76%
|
1/27/2012
|
$26.69
|
PP = $25.46
|
|
MB = $26.73
|
Most Recent Note - 3/26/2012 10:28:57 PM
G - Posted a 4th consecutive gain today on light volume, rising from support at its 50 DMA line and prior highs in the $26 area. Subsequent damaging losses may trigger a more worrisome technical sell signal.
>>> The latest Featured Stock Update with an annotated graph appeared on 3/13/2012. Click here.
View all notes |
Alert me of new notes |
CANSLIM.net Company Profile |
SEC |
Zacks Reports |
StockTalk |
News |
Chart |
Request a new note
C
A N
S L
I M
|
Symbol/Exchange
Company Name
Industry Group |
PRICE |
CHANGE
(%Change) |
Day High |
Volume
(% DAV)
(% 50 day avg vol) |
52 Wk Hi
% From Hi |
Featured
Date |
Price
Featured |
Pivot Featured |
|
Max Buy |
CATM
-
NASDAQ
Cardtronics Inc
DIVERSIFIED SERVICES - Business/Management Services
|
$26.99
|
-0.08
-0.30% |
$27.60
|
268,754
68.52% of 50 DAV
50 DAV is 392,200
|
$28.74
-6.09%
|
2/24/2012
|
$27.94
|
PP = $28.30
|
|
MB = $29.72
|
Most Recent Note - 3/20/2012 5:27:23 PM
G - Its Relative Strength rating has slumped to 70, below the 80+ guideline for buy candidates, and color code is changed to green while sputtering below its 50 DMA line and under its pivot point cited without triggering a proper technical buy signal. See the latest FSU analysis for more details and a new annotated weekly graph.
>>> The latest Featured Stock Update with an annotated graph appeared on 3/20/2012. Click here.
View all notes |
Alert me of new notes |
CANSLIM.net Company Profile |
SEC |
Zacks Reports |
StockTalk |
News |
Chart |
Request a new note
C
A N
S L
I M
|
CDNS
-
NASDAQ
Cadence Design Systems
COMPUTER SOFTWARE and SERVICES - Technical and System Software
|
$12.13
|
+0.11
0.87% |
$12.19
|
2,155,928
63.02% of 50 DAV
50 DAV is 3,421,000
|
$12.60
-3.77%
|
2/3/2012
|
$11.66
|
PP = $11.15
|
|
MB = $11.71
|
Most Recent Note - 3/19/2012 6:22:01 PM
G - Small gain on lighter volume today for a new 52-week high. Color code was changed to green after getting extended from the most ideal range for accumulating shares under the fact based system following an earlier technical breakout.
>>> The latest Featured Stock Update with an annotated graph appeared on 2/3/2012. Click here.
View all notes |
Alert me of new notes |
CANSLIM.net Company Profile |
SEC |
Zacks Reports |
StockTalk |
News |
Chart |
Request a new note
C
A N
S L
I M
|
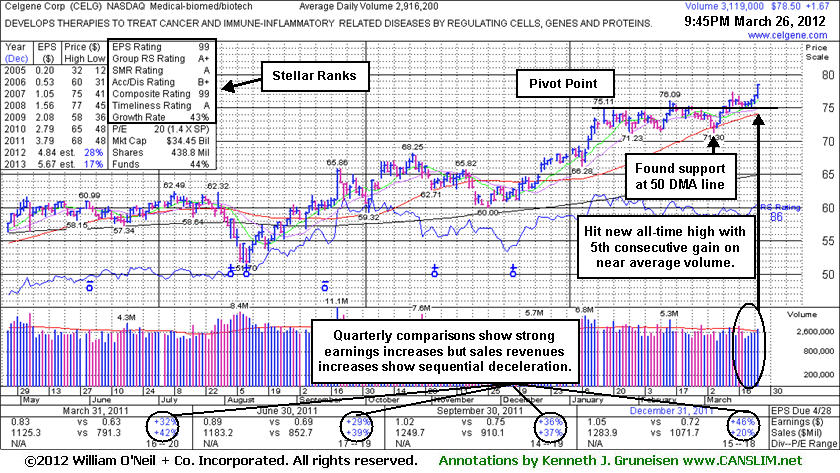
CELG
-
NASDAQ
Celgene Corp
DRUGS - Drug Manufacturers - Major
|
$78.50
|
+1.67
2.17% |
$78.53
|
3,126,940
107.23% of 50 DAV
50 DAV is 2,916,200
|
$77.43
1.38%
|
2/2/2012
|
$74.16
|
PP = $75.21
|
|
MB = $78.97
|
Most Recent Note - 3/26/2012 10:11:25 PM
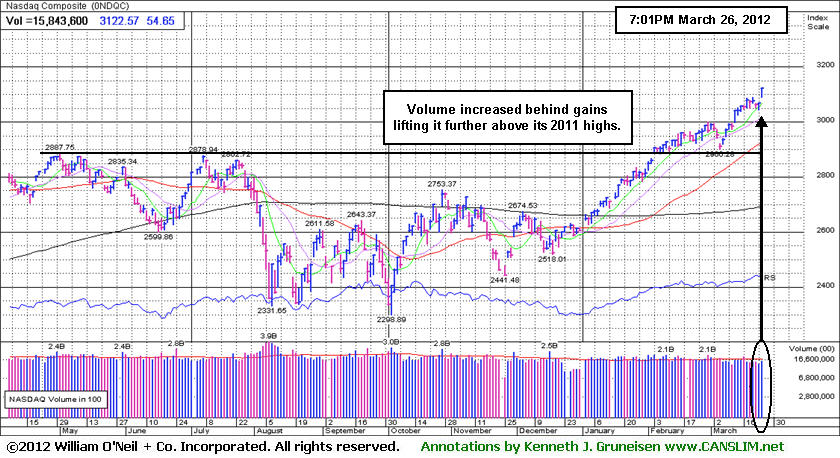
Y - Hit a new 52-week high today and rallied above its all-time high ($77.39 in Aug '08) with a 5th consecutive gain. The winning streak into new high territory is impressive, however to trigger a proper technical buy signal the volume behind a gain must be at least +40-50% above average, preferably greater, as a truly reassuring sign of great institutional demand capable of leading to a sustainable and meaningful price advance. Found support at its 50 DMA line on the last pullback, meanwhile any damaging violation would raise concerns and trigger technical sell signals. See the latest FSU analysis for more details and a new annotated graph.
>>> The latest Featured Stock Update with an annotated graph appeared on 3/26/2012. Click here.
View all notes |
Alert me of new notes |
CANSLIM.net Company Profile |
SEC |
Zacks Reports |
StockTalk |
News |
Chart |
Request a new note
C
A N
S L
I M
|
COO
-
NYSE
Cooper Companies Inc
HEALTH SERVICES - Medical Instruments and Supplies
|
$80.00
|
+1.10
1.39% |
$80.31
|
249,674
64.73% of 50 DAV
50 DAV is 385,700
|
$84.20
-4.98%
|
3/9/2012
|
$83.05
|
PP = $81.02
|
|
MB = $85.07
|
Most Recent Note - 3/19/2012 7:12:45 PM
G - Down today on higher volume, indicating distributional pressure, and its color code is changed to green. Its Relative Strength rating has quickly slumped to a mediocre 60, below the 80+ guideline for buy candidates, while sputtering back below the pivot point. Confirming gains with above average volume for additional new high closes would help its outlook.
>>> The latest Featured Stock Update with an annotated graph appeared on 3/9/2012. Click here.
View all notes |
Alert me of new notes |
CANSLIM.net Company Profile |
SEC |
Zacks Reports |
StockTalk |
News |
Chart |
Request a new note
C
A N
S L
I M
|
DISH
-
NASDAQ
Dish Network Corp Cl A
CONSUMER DURABLES - Electronic Equipment
|
$33.03
|
+0.23
0.70% |
$33.25
|
1,715,319
62.91% of 50 DAV
50 DAV is 2,726,700
|
$35.64
-7.32%
|
3/7/2012
|
$30.83
|
PP = $30.10
|
|
MB = $31.61
|
Most Recent Note - 3/22/2012 12:28:52 PM
G - Trading in the lower half of its intra-day range after a considerable early gain today. Blasted higher with heavy volume following news the FCC is maneuvering its rules in a way viewed as favorable for the company. Quickly getting very extended from its prior base. Prior highs in the $30 area define initial support to watch on pullbacks.
>>> The latest Featured Stock Update with an annotated graph appeared on 3/14/2012. Click here.
View all notes |
Alert me of new notes |
CANSLIM.net Company Profile |
SEC |
Zacks Reports |
StockTalk |
News |
Chart |
Request a new note
C
A N
S L
I M
|
Symbol/Exchange
Company Name
Industry Group |
PRICE |
CHANGE
(%Change) |
Day High |
Volume
(% DAV)
(% 50 day avg vol) |
52 Wk Hi
% From Hi |
Featured
Date |
Price
Featured |
Pivot Featured |
|
Max Buy |
ECHO
-
NASDAQ
Echo Global Logistics
DIVERSIFIED SERVICES - Business/Management Services
|
$16.95
|
-0.08
-0.47% |
$17.40
|
86,634
101.09% of 50 DAV
50 DAV is 85,700
|
$19.38
-12.54%
|
2/22/2012
|
$18.50
|
PP = $18.63
|
|
MB = $19.56
|
Most Recent Note - 3/23/2012 9:06:58 PM
G - Managed a positive reversal after a small gap down today, ending a streak of 5 consecutive losses. Recent technical deterioration raised concerns, and only a prompt rebound above its 50 DMA line would help its outlook improve.
>>> The latest Featured Stock Update with an annotated graph appeared on 2/23/2012. Click here.
View all notes |
Alert me of new notes |
CANSLIM.net Company Profile |
SEC |
Zacks Reports |
StockTalk |
News |
Chart |
Request a new note
C
A N
S L
I M
|
FEIC
-
NASDAQ
F E I Co
ELECTRONICS - Diversified Electronics
|
$49.03
|
+1.86
3.94% |
$49.75
|
564,927
185.10% of 50 DAV
50 DAV is 305,200
|
$48.31
1.49%
|
12/7/2011
|
$41.41
|
PP = $42.35
|
|
MB = $44.47
|
Most Recent Note - 3/26/2012 1:32:46 PM
G - Hitting a new 52-week high today with above average volume behind a 2nd consecutive gain while no resistance remains to hinder its progress. The latest quarterly report showed +21% earnings for the Dec '11 quarter, below the +25% minimum guideline for earnings growth.
>>> The latest Featured Stock Update with an annotated graph appeared on 3/12/2012. Click here.
View all notes |
Alert me of new notes |
CANSLIM.net Company Profile |
SEC |
Zacks Reports |
StockTalk |
News |
Chart |
Request a new note
C
A N
S L
I M
|
GNC
-
NYSE
G N C Holdings Inc
RETAIL - Drug Stores
|
$34.97
|
+0.34
0.98% |
$35.02
|
1,573,011
106.31% of 50 DAV
50 DAV is 1,479,700
|
$34.83
0.40%
|
1/19/2012
|
$28.99
|
PP = $29.60
|
|
MB = $31.08
|
Most Recent Note - 3/19/2012 12:35:06 PM
G - Holding its ground since a considerable gap up gain on 3/13/12 after raising guidance based on stronger same store sales than previously expected. Recent low ($30.75 on 3/07/12) and its 50 DMA line define near-term chart support to watch.
>>> The latest Featured Stock Update with an annotated graph appeared on 3/5/2012. Click here.
View all notes |
Alert me of new notes |
CANSLIM.net Company Profile |
SEC |
Zacks Reports |
StockTalk |
News |
Chart |
Request a new note
C
A N
S L
I M
|
HLF
-
NYSE
Herbalife Ltd
DRUGS - Nutrition and Weight Management
|
$71.21
|
+0.47
0.66% |
$72.11
|
1,404,810
106.43% of 50 DAV
50 DAV is 1,319,900
|
$72.00
-1.10%
|
2/22/2012
|
$65.90
|
PP = $63.50
|
|
MB = $66.68
|
Most Recent Note - 3/19/2012 6:24:29 PM
G - Small gap up gain today on average volume for a new all-time high, getting more extended from its prior base pattern. Prior highs in the $63 area define support to watch on pullbacks.
>>> The latest Featured Stock Update with an annotated graph appeared on 2/22/2012. Click here.
View all notes |
Alert me of new notes |
CANSLIM.net Company Profile |
SEC |
Zacks Reports |
StockTalk |
News |
Chart |
Request a new note
C
A N
S L
I M
|
ISRG
-
NASDAQ
Intuitive Surgical Inc
HEALTH SERVICES - Medical Appliances and Equipment
|
$541.96
|
+8.56
1.60% |
$542.38
|
189,147
56.19% of 50 DAV
50 DAV is 336,600
|
$538.02
0.73%
|
12/20/2011
|
$442.43
|
PP = $449.16
|
|
MB = $471.62
|
Most Recent Note - 3/19/2012 6:31:22 PM
G - ISRG may produce more climactic gains, however it is extended from any sound base pattern, and the December '11 quarterly earnings increased by just below the borderline +25% minimum guideline for ideal buy candidates. Rather than compromise, disciplined investors may sooner consider another Featured Stock when a fresh technical buy signal occurs.
>>> The latest Featured Stock Update with an annotated graph appeared on 3/1/2012. Click here.
View all notes |
Alert me of new notes |
CANSLIM.net Company Profile |
SEC |
Zacks Reports |
StockTalk |
News |
Chart |
Request a new note
C
A N
S L
I M
|
Symbol/Exchange
Company Name
Industry Group |
PRICE |
CHANGE
(%Change) |
Day High |
Volume
(% DAV)
(% 50 day avg vol) |
52 Wk Hi
% From Hi |
Featured
Date |
Price
Featured |
Pivot Featured |
|
Max Buy |
LULU
-
NASDAQ
Lululemon Athletica
MANUFACTURING - Textile Manufacturing
|
$75.23
|
-0.65
-0.86% |
$76.61
|
3,087,542
148.36% of 50 DAV
50 DAV is 2,081,100
|
$76.66
-1.87%
|
1/10/2012
|
$60.97
|
PP = $59.46
|
|
MB = $62.43
|
Most Recent Note - 3/23/2012 1:01:37 PM
G - Reported +59% earnings on +51% sales revenues for the quarter ended January 31, 2012 versus the year ago period. Holding its ground today after another volume-driven gain for a new all-time high. It is extended from any sound base, and its 50 DMA line defines near-term chart support to watch on pullbacks.
>>> The latest Featured Stock Update with an annotated graph appeared on 2/21/2012. Click here.
View all notes |
Alert me of new notes |
CANSLIM.net Company Profile |
SEC |
Zacks Reports |
StockTalk |
News |
Chart |
Request a new note
C
A N
S L
I M
|
MA
-
NYSE
Mastercard Inc Cl A
DIVERSIFIED SERVICES - Business/Management Services
|
$435.68
|
+11.67
2.75% |
$437.56
|
1,045,952
105.56% of 50 DAV
50 DAV is 990,900
|
$428.57
1.66%
|
3/12/2012
|
$419.86
|
PP = $428.67
|
|
MB = $450.10
|
Most Recent Note - 3/26/2012 10:32:35 PM
Y - Volume was near average as its rose above its pivot point today. Volume-driven gains are needed to clinch a proper new (or add-on) technical buy signal. Its 50 DMA line defines near-term support to watch.
>>> The latest Featured Stock Update with an annotated graph appeared on 2/17/2012. Click here.
View all notes |
Alert me of new notes |
CANSLIM.net Company Profile |
SEC |
Zacks Reports |
StockTalk |
News |
Chart |
Request a new note
C
A N
S L
I M
|
MELI
-
NASDAQ
Mercadolibre Inc
INTERNET - Internet Software and; Services
|
$101.76
|
+4.50
4.63% |
$101.85
|
548,871
109.10% of 50 DAV
50 DAV is 503,100
|
$104.50
-2.62%
|
2/6/2012
|
$97.09
|
PP = $95.58
|
|
MB = $100.36
|
Most Recent Note - 3/26/2012 10:22:35 PM
G - Color code is changed to green after rallying back above the previously cited "max buy" level with a considerable gain today with near average volume for its second-best close ever. Recently consolidating and staying above its 50 DMA line and above the recent low ($91.38 on 3/06/12) defining important support areas to watch.
>>> The latest Featured Stock Update with an annotated graph appeared on 2/6/2012. Click here.
View all notes |
Alert me of new notes |
CANSLIM.net Company Profile |
SEC |
Zacks Reports |
StockTalk |
News |
Chart |
Request a new note
C
A N
S L
I M
|
MG
-
NYSE
Mistras Group Inc
DIVERSIFIED SERVICES - Bulding and Faci;ity Management Services
|
$24.43
|
+0.53
2.22% |
$24.65
|
91,271
64.18% of 50 DAV
50 DAV is 142,200
|
$26.24
-6.90%
|
3/22/2012
|
$24.96
|
PP = $26.34
|
|
MB = $27.66
|
Most Recent Note - 3/26/2012 10:35:04 PM
Y - Up today on light volume, remaining below the new pivot point cited in the 3/22/12 mid-day report based on its 52-week high plus 10 cents after a 12-week base. It was previously noted - "Disciplined investors will watch for a volume-driven gain above the pivot to confirm a technical buy signal before taking any action. Found support well above its 200 DMA line and it has now rebounded to within -4.2% of its 52-week high. Fundamentals remain strong since it was dropped from the Featured Stocks list on 1/11/12. The number of top-rated funds owning its shares rose from 128 in Mar '11 to 185 in Dec '11, a reassuring sign concerning the I criteria."

>>> The latest Featured Stock Update with an annotated graph appeared on 1/6/2012. Click here.
View all notes |
Alert me of new notes |
CANSLIM.net Company Profile |
SEC |
Zacks Reports |
StockTalk |
News |
Chart |
Request a new note
C
A N
S L
I M
|
MKTX
-
NASDAQ
Marketaxess Holdings Inc
FINANCIAL SERVICES - Investment Brokerage - Nationa
|
$37.53
|
+0.47
1.27% |
$37.79
|
212,540
79.45% of 50 DAV
50 DAV is 267,500
|
$37.25
0.75%
|
3/8/2012
|
$35.80
|
PP = $35.52
|
|
MB = $37.30
|
Most Recent Note - 3/22/2012 12:53:15 PM
Y - Rallying within close striking distance of its all-time high today and promptly rebounding back above its pivot point. The solid volume-driven gain on 3/16/12 helped clinch a technical buy signal. Its 50 DMA line defines important support to watch.
>>> The latest Featured Stock Update with an annotated graph appeared on 3/8/2012. Click here.
View all notes |
Alert me of new notes |
CANSLIM.net Company Profile |
SEC |
Zacks Reports |
StockTalk |
News |
Chart |
Request a new note
C
A N
S L
I M
|
Symbol/Exchange
Company Name
Industry Group |
PRICE |
CHANGE
(%Change) |
Day High |
Volume
(% DAV)
(% 50 day avg vol) |
52 Wk Hi
% From Hi |
Featured
Date |
Price
Featured |
Pivot Featured |
|
Max Buy |
NTES
-
NASDAQ
Netease.Com Inc Adr
INTERNET - Internet Information Providers
|
$59.92
|
+0.21
0.35% |
$60.15
|
843,628
132.33% of 50 DAV
50 DAV is 637,500
|
$60.00
-0.13%
|
3/19/2012
|
$56.18
|
PP = $55.10
|
|
MB = $57.86
|
Most Recent Note - 3/22/2012 1:06:54 PM
G - Up again today after a gap up and volume-driven gain on the prior session, rallying further above its "max buy" level and getting extended from its prior base. Its old highs in the $55 area define initial support to watch on pullbacks.
>>> The latest Featured Stock Update with an annotated graph appeared on 10/9/2009. Click here.
View all notes |
Alert me of new notes |
CANSLIM.net Company Profile |
SEC |
Zacks Reports |
StockTalk |
News |
Chart |
Request a new note
C
A N
S L
I M
|
RAX
-
NYSE
Rackspace Hosting Inc
INTERNET - Internet Software and; Services
|
$58.33
|
+1.33
2.33% |
$59.00
|
1,288,498
61.92% of 50 DAV
50 DAV is 2,080,800
|
$58.66
-0.56%
|
2/2/2012
|
$46.69
|
PP = $45.55
|
|
MB = $47.83
|
Most Recent Note - 3/22/2012 1:10:31 PM
G - Down today with higher volume, yet it is up from the session's early lows following a gap down after an analyst downgrade. It recently had wedged up to a new 52-week high with gains lacking great volume conviction, and the last consolidation was noted as a little short of the 5-week minimum length for it to be considered a new flat base pattern. Its 50 DMA line coincides with the prior low in the $49 area, defining an important near-term support level to watch.
>>> The latest Featured Stock Update with an annotated graph appeared on 2/16/2012. Click here.
View all notes |
Alert me of new notes |
CANSLIM.net Company Profile |
SEC |
Zacks Reports |
StockTalk |
News |
Chart |
Request a new note
C
A N
S L
I M
|
RGR
-
NYSE
Sturm Ruger & Co Inc
CONSUMER DURABLES - Sporting Goods
|
$50.11
|
+2.04
4.24% |
$50.72
|
514,887
176.88% of 50 DAV
50 DAV is 291,100
|
$48.66
2.98%
|
3/22/2012
|
$46.49
|
PP = $46.78
|
|
MB = $49.12
|
Most Recent Note - 3/26/2012 1:11:01 PM
G - Gapped up today and rose above its "max buy" level. Color code is changed to green after getting extended from its prior base pattern, meanwhile prior highs define initial support to watch on pullbacks toward its 50 DMA line. See the latest FSU analysis for more details and a new annotated graph.
>>> The latest Featured Stock Update with an annotated graph appeared on 3/22/2012. Click here.
View all notes |
Alert me of new notes |
CANSLIM.net Company Profile |
SEC |
Zacks Reports |
StockTalk |
News |
Chart |
Request a new note
C
A N
S L
I M
|
RRTS
-
NYSE
Roadrunner Trans Systems
TRANSPORTATION - Air Delivery and Freight Service
|
$17.97
|
+0.32
1.81% |
$17.99
|
47,880
32.55% of 50 DAV
50 DAV is 147,100
|
$18.59
-3.34%
|
2/10/2012
|
$17.40
|
PP = $17.50
|
|
MB = $18.38
|
Most Recent Note - 3/26/2012 10:42:03 PM
Y - Second consecutive small gain today on light volume. It has been sputtering since a "negative reversal" on 3/16/12 for a loss on above average volume after touching a new 52-week high. A new pivot point was not cited, yet it has built a base-on-base pattern while consolidating above prior highs in the $17 area and above its 50 DMA line defining support to watch on pullbacks.
>>> The latest Featured Stock Update with an annotated graph appeared on 2/13/2012. Click here.
View all notes |
Alert me of new notes |
CANSLIM.net Company Profile |
SEC |
Zacks Reports |
StockTalk |
News |
Chart |
Request a new note
C
A N
S L
I M
|
SHFL
-
NASDAQ
Shuffle Master Inc
MANUFACTURING - Diversified Machinery
|
$17.70
|
+0.34
1.96% |
$17.76
|
678,873
118.19% of 50 DAV
50 DAV is 574,400
|
$18.38
-3.70%
|
3/6/2012
|
$17.07
|
PP = $15.25
|
|
MB = $16.01
|
Most Recent Note - 3/19/2012 7:03:54 PM
G - Hit another new 52-week high today with its 10th gain in the span of 11 sessions. It may produce more climactic gains, but it is extended from any sound base pattern. Its 50 DMA line defines support to watch on pullbacks.
>>> The latest Featured Stock Update with an annotated graph appeared on 3/15/2012. Click here.
View all notes |
Alert me of new notes |
CANSLIM.net Company Profile |
SEC |
Zacks Reports |
StockTalk |
News |
Chart |
Request a new note
C
A N
S L
I M
|
Symbol/Exchange
Company Name
Industry Group |
PRICE |
CHANGE
(%Change) |
Day High |
Volume
(% DAV)
(% 50 day avg vol) |
52 Wk Hi
% From Hi |
Featured
Date |
Price
Featured |
Pivot Featured |
|
Max Buy |
SWI
-
NYSE
Solarwinds Inc
COMPUTER SOFTWARE and SERVICES - Application Software
|
$41.10
|
+2.35
6.06% |
$42.22
|
2,728,644
234.34% of 50 DAV
50 DAV is 1,164,400
|
$40.44
1.63%
|
1/26/2012
|
$32.36
|
PP = $33.78
|
|
MB = $35.47
|
Most Recent Note - 3/26/2012 1:15:00 PM
G - Gapped up for another new all-time high today, getting more extended from its last sound base pattern. Earnings below the +25% guideline for the Dec '11 quarter raised fundamental concerns, yet its bullish technical action has argued for disciplined investors to give it the benefit of the doubt until technical sell signals occur.
>>> The latest Featured Stock Update with an annotated graph appeared on 3/16/2012. Click here.
View all notes |
Alert me of new notes |
CANSLIM.net Company Profile |
SEC |
Zacks Reports |
StockTalk |
News |
Chart |
Request a new note
C
A N
S L
I M
|
SXCI
-
NASDAQ
S X C Health Solutions
COMPUTER SOFTWARE and SERVICES - Healthcare Information Service
|
$72.38
|
+0.17
0.24% |
$73.96
|
344,363
85.92% of 50 DAV
50 DAV is 400,800
|
$76.42
-5.29%
|
2/23/2012
|
$68.24
|
PP = $66.05
|
|
MB = $69.35
|
Most Recent Note - 3/19/2012 6:35:20 PM
G - Hovering in a tight range for the past 3 weeks, and it is extended from its prior base. Prior highs in the $66 area define support to watch on pullbacks.
>>> The latest Featured Stock Update with an annotated graph appeared on 3/6/2012. Click here.
View all notes |
Alert me of new notes |
CANSLIM.net Company Profile |
SEC |
Zacks Reports |
StockTalk |
News |
Chart |
Request a new note
C
A N
S L
I M
|
TDG
-
NYSE
Transdigm Group Inc
AEROSPACE/DEFENSE - Aerospace/Defense Products and; Services
|
$117.09
|
+1.73
1.50% |
$118.21
|
382,335
93.37% of 50 DAV
50 DAV is 409,500
|
$121.48
-3.61%
|
2/29/2012
|
$120.10
|
PP = $118.93
|
|
MB = $124.88
|
Most Recent Note - 3/26/2012 10:40:05 PM
Y - Up today on near average volume, yet it remains below its latest pivot point after encountering distributional pressure. Its recent low ($111.03 on 3/06/12) and its 50 DMA line define important chart support to watch above prior highs in the $102 area.
>>> The latest Featured Stock Update with an annotated graph appeared on 2/10/2012. Click here.
View all notes |
Alert me of new notes |
CANSLIM.net Company Profile |
SEC |
Zacks Reports |
StockTalk |
News |
Chart |
Request a new note
C
A N
S L
I M
|
TNGO
-
NASDAQ
Tangoe Inc
COMPUTER SOFTWARE and SERVICES - Technical and System Software
|
$19.18
|
+0.31
1.64% |
$19.43
|
858,989
219.97% of 50 DAV
50 DAV is 390,500
|
$19.90
-3.62%
|
2/13/2012
|
$15.39
|
PP = $16.51
|
|
MB = $17.34
|
Most Recent Note - 3/23/2012 1:14:43 PM
G - Perched just -4.8% off its 52-week high today and working on a base-on-base type pattern. Consolidating above prior highs in the $16 area and its 50 DMA line defining support to watch.
>>> The latest Featured Stock Update with an annotated graph appeared on 2/14/2012. Click here.
View all notes |
Alert me of new notes |
CANSLIM.net Company Profile |
SEC |
Zacks Reports |
StockTalk |
News |
Chart |
Request a new note
C
A N
S L
I M
|
TSCO
-
NASDAQ
Tractor Supply Co
SPECIALTY RETAIL - Specialty Retail, Other
|
$90.92
|
+4.88
5.67% |
$91.00
|
1,283,487
181.93% of 50 DAV
50 DAV is 705,500
|
$88.97
2.19%
|
1/12/2012
|
$79.12
|
PP = $75.58
|
|
MB = $79.36
|
Most Recent Note - 3/26/2012 1:20:48 PM
G - Volume-driven gain today for a new all-time high. Color code is changed to green after rising further from its previous sound base. Last noted on 3/22/12 that it could be accumulated up to the prior high $88.65 (on 2/28/12) plus another 5%, however - the further one chases any stock above its pivot point the greater the chances are than an ordinary pullback may necessitate selling. Its 50 DMA line defines support to watch on pullbacks.
>>> The latest Featured Stock Update with an annotated graph appeared on 2/27/2012. Click here.
View all notes |
Alert me of new notes |
CANSLIM.net Company Profile |
SEC |
Zacks Reports |
StockTalk |
News |
Chart |
Request a new note
C
A N
S L
I M
|
Symbol/Exchange
Company Name
Industry Group |
PRICE |
CHANGE
(%Change) |
Day High |
Volume
(% DAV)
(% 50 day avg vol) |
52 Wk Hi
% From Hi |
Featured
Date |
Price
Featured |
Pivot Featured |
|
Max Buy |
UA
-
NYSE
Under Armour Inc Cl A
CONSUMER NON-DURABLES - Textile - Apparel Clothing
|
$98.96
|
+1.86
1.92% |
$99.35
|
562,272
44.42% of 50 DAV
50 DAV is 1,265,800
|
$99.10
-0.14%
|
2/15/2012
|
$85.77
|
PP = $84.86
|
|
MB = $89.10
|
Most Recent Note - 3/22/2012 10:35:02 AM
G - It is extended from its last sound base pattern and recent gains above its pivot point did not have volume sufficient to trigger a proper technical buy signal. Pyramiding into a position can help investors avoid chasing stocks too far above their pivot point.
>>> The latest Featured Stock Update with an annotated graph appeared on 2/15/2012. Click here.
View all notes |
Alert me of new notes |
CANSLIM.net Company Profile |
SEC |
Zacks Reports |
StockTalk |
News |
Chart |
Request a new note
C
A N
S L
I M
|
UBNT
-
NASDAQ
Ubiquiti Networks Inc
TELECOMMUNICATIONS - Diversified Communication Serv
|
$32.75
|
+2.37
7.80% |
$33.97
|
880,497
294.78% of 50 DAV
50 DAV is 298,700
|
$31.32
4.57%
|
1/27/2012
|
$22.25
|
PP = $23.14
|
|
MB = $24.30
|
Most Recent Note - 3/26/2012 1:21:51 PM
G - Considerable volume-driven gain again today for another new 52-week high, getting more extended from the previous base. Its 50 DMA line defines important near-term support to watch on pullbacks.
>>> The latest Featured Stock Update with an annotated graph appeared on 3/21/2012. Click here.
View all notes |
Alert me of new notes |
CANSLIM.net Company Profile |
SEC |
Zacks Reports |
StockTalk |
News |
Chart |
Request a new note
C
A N
S L
I M
|
ULTA
-
NASDAQ
Ulta Salon Cosm & Frag
SPECIALTY RETAIL - Specialty Retail, Other
|
$94.51
|
+0.96
1.03% |
$94.73
|
538,067
74.56% of 50 DAV
50 DAV is 721,700
|
$93.88
0.67%
|
1/11/2012
|
$71.97
|
PP = $75.80
|
|
MB = $79.59
|
Most Recent Note - 3/19/2012 6:43:49 PM
G - ULTA may produce more climactic gains, however, while hovering near its all-time high it has been repeatedly noted - "Extended from any sound base pattern, meanwhile its prior highs near $75 and its 50 DMA line define important chart support."
>>> The latest Featured Stock Update with an annotated graph appeared on 2/28/2012. Click here.
View all notes |
Alert me of new notes |
CANSLIM.net Company Profile |
SEC |
Zacks Reports |
StockTalk |
News |
Chart |
Request a new note
C
A N
S L
I M
|
V
-
NYSE
Visa Inc Cl A
DIVERSIFIED SERVICES - Business/Management Services
|
$120.06
|
+1.28
1.08% |
$120.70
|
4,091,643
109.75% of 50 DAV
50 DAV is 3,728,000
|
$119.72
0.28%
|
3/12/2012
|
$116.53
|
PP = $119.46
|
|
MB = $125.43
|
Most Recent Note - 3/19/2012 6:46:14 PM
Y - Touched a new all-time high with a gain on average volume today. Volume-driven gains may trigger a new (or add-on) technical buy signal, meanwhile its 50 DMA line defines support to watch above prior highs in the $103-104 area.
>>> The latest Featured Stock Update with an annotated graph appeared on 3/7/2012. Click here.
View all notes |
Alert me of new notes |
CANSLIM.net Company Profile |
SEC |
Zacks Reports |
StockTalk |
News |
Chart |
Request a new note
C
A N
S L
I M
|