***Last / Change / Volume data in this table is the closing quote data***
Symbol/Exchange
Company Name
Industry Group |
PRICE |
CHANGE
(%Change) |
Day High |
Volume
(% DAV)
(% 50 day avg vol) |
52 Wk Hi
% From Hi |
Featured
Date |
Price
Featured |
Pivot Featured |
|
Max Buy |
ACN
-
NYSE
Accenture Plc
DIVERSIFIED SERVICES - Business/Management Services
|
$64.88
|
+1.36
2.14% |
$64.90
|
6,655,439
188.33% of 50 DAV
50 DAV is 3,533,900
|
$64.27
0.95%
|
3/23/2012
|
$64.13
|
PP = $63.76
|
|
MB = $66.95
|
 Most Recent Note - 3/23/2012 8:55:59 PM
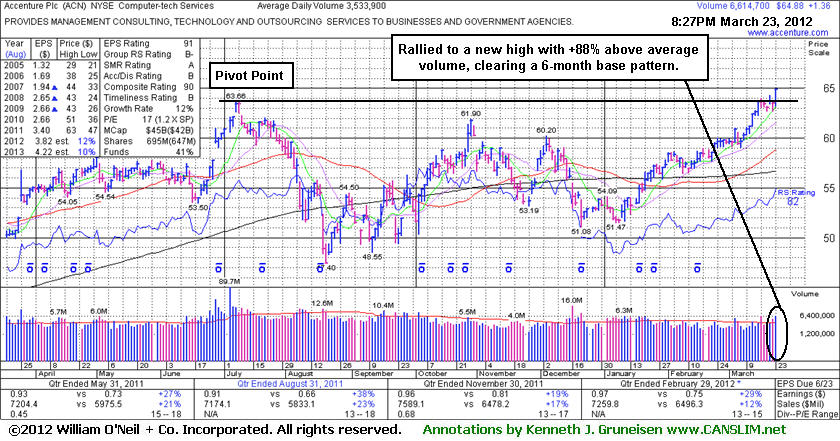
Y - Featured in yellow in the earlier mid-day report (read here) with a pivot point cited based on its 7/07/11 high plus 10 cents. Its convincing finish with a volume-driven gain above the pivot point was backed by +88% above average volume as it clinched a new (or add-on) technical buy signal. See the latest FSU analysis for more details and a new annotated graph.
>>> The latest Featured Stock Update with an annotated graph appeared on 3/23/2012. Click here.
View all notes |
Alert me of new notes |
CANSLIM.net Company Profile |
SEC |
Zacks Reports |
StockTalk |
News |
Chart |
Request a new note
C
A N
S L
I M


|
ADS
-
NYSE
Alliance Data Sys Corp
COMPUTER SOFTWARE and SERVICES - Information and Delivery Service
|
$125.98
|
+0.24
0.19% |
$125.98
|
380,533
57.61% of 50 DAV
50 DAV is 660,500
|
$126.56
-0.46%
|
1/17/2012
|
$108.24
|
PP = $107.43
|
|
MB = $112.80
|
Most Recent Note - 3/20/2012 4:30:28 PM
G - Perched near its all-time high, extended from any sound base pattern. Fundamental concerns were raised by earnings reported +9%, well below the +25% minimum guideline in the latest quarter ended December 31, 2011.
>>> The latest Featured Stock Update with an annotated graph appeared on 2/29/2012. Click here.
View all notes |
Alert me of new notes |
CANSLIM.net Company Profile |
SEC |
Zacks Reports |
StockTalk |
News |
Chart |
Request a new note
C
A N
S L
I M
|
ALLT
-
NASDAQ
Allot Communications Ltd
COMPUTER SOFTWARE andamp; SERVICES - Technical andamp; System Software
|
$21.28
|
-0.13
-0.61% |
$21.57
|
290,128
82.59% of 50 DAV
50 DAV is 351,300
|
$21.72
-2.02%
|
3/13/2012
|
$19.72
|
PP = $18.91
|
|
MB = $19.86
|
Most Recent Note - 3/19/2012 5:33:23 PM
G - Holding its ground near its 52-week high, extended from its prior base. Disciplined investors do not chase extended stocks and always limit losses if ever any stock falls more than -7% from their purchase price. A considerable gain on more than 7 times average volume helped ALLT rise from an orderly 13-week base and trigger a technical buy signal as it was featured in the 3/13/12 mid-day report (read here) with pivot point cited based on its 2/23/12 high plus 10 cents. See the latest FSU analysis for more details and a new annotated weekly graph.
>>> The latest Featured Stock Update with an annotated graph appeared on 3/19/2012. Click here.
View all notes |
Alert me of new notes |
CANSLIM.net Company Profile |
SEC |
Zacks Reports |
StockTalk |
News |
Chart |
Request a new note
C
A N
S L
I M
|
ALXN
-
NASDAQ
Alexion Pharmaceuticals
DRUGS - Drug Manufacturers - Other
|
$93.82
|
-0.20
-0.21% |
$94.90
|
889,364
71.17% of 50 DAV
50 DAV is 1,249,700
|
$94.22
-0.42%
|
3/12/2012
|
$87.87
|
PP = $87.73
|
|
MB = $92.12
|
Most Recent Note - 3/21/2012 6:19:16 PM
G - Hit another new all-time high with today's gain backed by +37% above average volume and its color code is changed to green after closing above its "max buy" level. Support to watch on pullbacks is its 50 DMA line.
>>> The latest Featured Stock Update with an annotated graph appeared on 2/24/2012. Click here.
View all notes |
Alert me of new notes |
CANSLIM.net Company Profile |
SEC |
Zacks Reports |
StockTalk |
News |
Chart |
Request a new note
C
A N
S L
I M
|
BODY
-
NASDAQ
Body Central Corp
RETAIL - Catalog andamp; Mail Order Houses
|
$26.83
|
+0.30
1.13% |
$27.27
|
174,711
81.41% of 50 DAV
50 DAV is 214,600
|
$29.49
-9.02%
|
1/27/2012
|
$26.69
|
PP = $25.46
|
|
MB = $26.73
|
Most Recent Note - 3/19/2012 6:14:14 PM
G - Sputtering near support at its 50 DMA line and prior highs in the $26 area. Subsequent damaging losses may trigger a more worrisome technical sell signal
>>> The latest Featured Stock Update with an annotated graph appeared on 3/13/2012. Click here.
View all notes |
Alert me of new notes |
CANSLIM.net Company Profile |
SEC |
Zacks Reports |
StockTalk |
News |
Chart |
Request a new note
C
A N
S L
I M
|
Symbol/Exchange
Company Name
Industry Group |
PRICE |
CHANGE
(%Change) |
Day High |
Volume
(% DAV)
(% 50 day avg vol) |
52 Wk Hi
% From Hi |
Featured
Date |
Price
Featured |
Pivot Featured |
|
Max Buy |
CATM
-
NASDAQ
Cardtronics Inc
DIVERSIFIED SERVICES - Business/Management Services
|
$27.07
|
+0.27
1.01% |
$27.08
|
138,847
35.03% of 50 DAV
50 DAV is 396,400
|
$28.74
-5.81%
|
2/24/2012
|
$27.94
|
PP = $28.30
|
|
MB = $29.72
|
Most Recent Note - 3/20/2012 5:27:23 PM
G - Its Relative Strength rating has slumped to 70, below the 80+ guideline for buy candidates, and color code is changed to green while sputtering below its 50 DMA line and under its pivot point cited without triggering a proper technical buy signal. See the latest FSU analysis for more details and a new annotated weekly graph.
>>> The latest Featured Stock Update with an annotated graph appeared on 3/20/2012. Click here.
View all notes |
Alert me of new notes |
CANSLIM.net Company Profile |
SEC |
Zacks Reports |
StockTalk |
News |
Chart |
Request a new note
C
A N
S L
I M
|
CDNS
-
NASDAQ
Cadence Design Systems
COMPUTER SOFTWARE and SERVICES - Technical and System Software
|
$12.02
|
-0.10
-0.83% |
$12.15
|
2,434,055
71.42% of 50 DAV
50 DAV is 3,408,100
|
$12.60
-4.60%
|
2/3/2012
|
$11.66
|
PP = $11.15
|
|
MB = $11.71
|
Most Recent Note - 3/19/2012 6:22:01 PM
G - Small gain on lighter volume today for a new 52-week high. Color code was changed to green after getting extended from the most ideal range for accumulating shares under the fact based system following an earlier technical breakout.
>>> The latest Featured Stock Update with an annotated graph appeared on 2/3/2012. Click here.
View all notes |
Alert me of new notes |
CANSLIM.net Company Profile |
SEC |
Zacks Reports |
StockTalk |
News |
Chart |
Request a new note
C
A N
S L
I M
|
CELG
-
NASDAQ
Celgene Corp
DRUGS - Drug Manufacturers - Major
|
$76.83
|
+0.66
0.87% |
$76.92
|
2,417,050
81.82% of 50 DAV
50 DAV is 2,954,000
|
$77.43
-0.77%
|
2/2/2012
|
$74.16
|
PP = $75.21
|
|
MB = $78.97
|
Most Recent Note - 3/22/2012 10:40:20 AM
Y - Still hovering near its 52-week high today, stubbornly holding its ground. Subsequent volume-driven gains would be a welcome and reassuring sign of fresh institutional demand. Found support at its 50 DMA line on the last pullback, meanwhile any damaging violation would raise concerns and trigger technical sell signals. Last week it barely traded above its all-time high ($77.39 in Aug '08).
>>> The latest Featured Stock Update with an annotated graph appeared on 2/2/2012. Click here.
View all notes |
Alert me of new notes |
CANSLIM.net Company Profile |
SEC |
Zacks Reports |
StockTalk |
News |
Chart |
Request a new note
C
A N
S L
I M
|
COO
-
NYSE
Cooper Companies Inc
HEALTH SERVICES - Medical Instruments and Supplies
|
$78.90
|
-0.10
-0.13% |
$79.46
|
187,585
48.00% of 50 DAV
50 DAV is 390,800
|
$84.20
-6.29%
|
3/9/2012
|
$83.05
|
PP = $81.02
|
|
MB = $85.07
|
Most Recent Note - 3/19/2012 7:12:45 PM
G - Down today on higher volume, indicating distributional pressure, and its color code is changed to green. Its Relative Strength rating has quickly slumped to a mediocre 60, below the 80+ guideline for buy candidates, while sputtering back below the pivot point. Confirming gains with above average volume for additional new high closes would help its outlook.
>>> The latest Featured Stock Update with an annotated graph appeared on 3/9/2012. Click here.
View all notes |
Alert me of new notes |
CANSLIM.net Company Profile |
SEC |
Zacks Reports |
StockTalk |
News |
Chart |
Request a new note
C
A N
S L
I M
|
DISH
-
NASDAQ
Dish Network Corp Cl A
CONSUMER DURABLES - Electronic Equipment
|
$32.80
|
-0.10
-0.30% |
$33.34
|
2,665,572
97.11% of 50 DAV
50 DAV is 2,744,900
|
$35.64
-7.97%
|
3/7/2012
|
$30.83
|
PP = $30.10
|
|
MB = $31.61
|
Most Recent Note - 3/22/2012 12:28:52 PM
G - Trading in the lower half of its intra-day range after a considerable early gain today. Blasted higher with heavy volume following news the FCC is maneuvering its rules in a way viewed as favorable for the company. Quickly getting very extended from its prior base. Prior highs in the $30 area define initial support to watch on pullbacks.
>>> The latest Featured Stock Update with an annotated graph appeared on 3/14/2012. Click here.
View all notes |
Alert me of new notes |
CANSLIM.net Company Profile |
SEC |
Zacks Reports |
StockTalk |
News |
Chart |
Request a new note
C
A N
S L
I M
|
Symbol/Exchange
Company Name
Industry Group |
PRICE |
CHANGE
(%Change) |
Day High |
Volume
(% DAV)
(% 50 day avg vol) |
52 Wk Hi
% From Hi |
Featured
Date |
Price
Featured |
Pivot Featured |
|
Max Buy |
ECHO
-
NASDAQ
Echo Global Logistics
DIVERSIFIED SERVICES - Business/Management Services
|
$17.03
|
+0.19
1.13% |
$17.13
|
174,911
209.73% of 50 DAV
50 DAV is 83,400
|
$19.38
-12.13%
|
2/22/2012
|
$18.50
|
PP = $18.63
|
|
MB = $19.56
|
Most Recent Note - 3/23/2012 9:06:58 PM
G - Managed a positive reversal after a small gap down today, ending a streak of 5 consecutive losses. Recent technical deterioration raised concerns, and only a prompt rebound above its 50 DMA line would help its outlook improve.
>>> The latest Featured Stock Update with an annotated graph appeared on 2/23/2012. Click here.
View all notes |
Alert me of new notes |
CANSLIM.net Company Profile |
SEC |
Zacks Reports |
StockTalk |
News |
Chart |
Request a new note
C
A N
S L
I M
|
FEIC
-
NASDAQ
F E I Co
ELECTRONICS - Diversified Electronics
|
$47.17
|
+1.60
3.51% |
$47.23
|
405,760
131.70% of 50 DAV
50 DAV is 308,100
|
$48.31
-2.36%
|
12/7/2011
|
$41.41
|
PP = $42.35
|
|
MB = $44.47
|
Most Recent Note - 3/23/2012 9:00:46 PM
G - Rallied for a best-ever close today with a solid gain backed by +32% above average volume. No resistance remains to hinder its progress. The latest quarterly report showed +21% earnings for the Dec '11 quarter, below the +25% minimum guideline for earnings growth.
>>> The latest Featured Stock Update with an annotated graph appeared on 3/12/2012. Click here.
View all notes |
Alert me of new notes |
CANSLIM.net Company Profile |
SEC |
Zacks Reports |
StockTalk |
News |
Chart |
Request a new note
C
A N
S L
I M
|
GNC
-
NYSE
G N C Holdings Inc
RETAIL - Drug Stores
|
$34.63
|
+0.09
0.26% |
$34.75
|
1,426,618
97.91% of 50 DAV
50 DAV is 1,457,100
|
$34.83
-0.57%
|
1/19/2012
|
$28.99
|
PP = $29.60
|
|
MB = $31.08
|
Most Recent Note - 3/19/2012 12:35:06 PM
G - Holding its ground since a considerable gap up gain on 3/13/12 after raising guidance based on stronger same store sales than previously expected. Recent low ($30.75 on 3/07/12) and its 50 DMA line define near-term chart support to watch.
>>> The latest Featured Stock Update with an annotated graph appeared on 3/5/2012. Click here.
View all notes |
Alert me of new notes |
CANSLIM.net Company Profile |
SEC |
Zacks Reports |
StockTalk |
News |
Chart |
Request a new note
C
A N
S L
I M
|
HLF
-
NYSE
Herbalife Ltd
DRUGS - Nutrition and Weight Management
|
$70.74
|
+0.47
0.67% |
$70.96
|
1,258,582
95.19% of 50 DAV
50 DAV is 1,322,200
|
$72.00
-1.75%
|
2/22/2012
|
$65.90
|
PP = $63.50
|
|
MB = $66.68
|
Most Recent Note - 3/19/2012 6:24:29 PM
G - Small gap up gain today on average volume for a new all-time high, getting more extended from its prior base pattern. Prior highs in the $63 area define support to watch on pullbacks.
>>> The latest Featured Stock Update with an annotated graph appeared on 2/22/2012. Click here.
View all notes |
Alert me of new notes |
CANSLIM.net Company Profile |
SEC |
Zacks Reports |
StockTalk |
News |
Chart |
Request a new note
C
A N
S L
I M
|
ISRG
-
NASDAQ
Intuitive Surgical Inc
HEALTH SERVICES - Medical Appliances and Equipment
|
$533.40
|
-1.41
-0.26% |
$536.70
|
133,342
39.18% of 50 DAV
50 DAV is 340,300
|
$538.02
-0.86%
|
12/20/2011
|
$442.43
|
PP = $449.16
|
|
MB = $471.62
|
Most Recent Note - 3/19/2012 6:31:22 PM
G - ISRG may produce more climactic gains, however it is extended from any sound base pattern, and the December '11 quarterly earnings increased by just below the borderline +25% minimum guideline for ideal buy candidates. Rather than compromise, disciplined investors may sooner consider another Featured Stock when a fresh technical buy signal occurs.
>>> The latest Featured Stock Update with an annotated graph appeared on 3/1/2012. Click here.
View all notes |
Alert me of new notes |
CANSLIM.net Company Profile |
SEC |
Zacks Reports |
StockTalk |
News |
Chart |
Request a new note
C
A N
S L
I M
|
Symbol/Exchange
Company Name
Industry Group |
PRICE |
CHANGE
(%Change) |
Day High |
Volume
(% DAV)
(% 50 day avg vol) |
52 Wk Hi
% From Hi |
Featured
Date |
Price
Featured |
Pivot Featured |
|
Max Buy |
LULU
-
NASDAQ
Lululemon Athletica
MANUFACTURING - Textile Manufacturing
|
$75.88
|
-0.07
-0.09% |
$76.65
|
3,162,495
150.22% of 50 DAV
50 DAV is 2,105,300
|
$76.66
-1.02%
|
1/10/2012
|
$60.97
|
PP = $59.46
|
|
MB = $62.43
|
Most Recent Note - 3/23/2012 1:01:37 PM
G - Reported +59% earnings on +51% sales revenues for the quarter ended January 31, 2012 versus the year ago period. Holding its ground today after another volume-driven gain for a new all-time high. It is extended from any sound base, and its 50 DMA line defines near-term chart support to watch on pullbacks.
>>> The latest Featured Stock Update with an annotated graph appeared on 2/21/2012. Click here.
View all notes |
Alert me of new notes |
CANSLIM.net Company Profile |
SEC |
Zacks Reports |
StockTalk |
News |
Chart |
Request a new note
C
A N
S L
I M
|
MA
-
NYSE
Mastercard Inc Cl A
DIVERSIFIED SERVICES - Business/Management Services
|
$424.01
|
+7.17
1.72% |
$426.36
|
664,332
66.01% of 50 DAV
50 DAV is 1,006,400
|
$428.57
-1.06%
|
3/12/2012
|
$419.86
|
PP = $428.67
|
|
MB = $450.10
|
Most Recent Note - 3/22/2012 10:43:53 AM
Y - Volume totals have been cooling while it is still hovering near its all-time high, stubbornly holding its ground. After forming an advanced "3-weeks tight" base a new pivot point was cited based on its 2/29/12 high plus 10 cents while its color code was changed to yellow. Volume-driven gains may trigger a new (or add-on) technical buy signal, meanwhile its prior highs in the $381-384 area define support to watch on pullbacks along with its 50 DMA line.
>>> The latest Featured Stock Update with an annotated graph appeared on 2/17/2012. Click here.
View all notes |
Alert me of new notes |
CANSLIM.net Company Profile |
SEC |
Zacks Reports |
StockTalk |
News |
Chart |
Request a new note
C
A N
S L
I M
|
MELI
-
NASDAQ
Mercadolibre Inc
INTERNET - Internet Software and; Services
|
$97.26
|
+0.78
0.81% |
$97.64
|
251,649
49.83% of 50 DAV
50 DAV is 505,000
|
$104.50
-6.93%
|
2/6/2012
|
$97.09
|
PP = $95.58
|
|
MB = $100.36
|
Most Recent Note - 3/20/2012 4:28:59 PM
Y - Finished near the session high today with a small loss on light volume. Quietly consolidating, staying above its 50 DMA line and above the recent low ($91.38 on 3/06/12) defining important support areas to watch.
>>> The latest Featured Stock Update with an annotated graph appeared on 2/6/2012. Click here.
View all notes |
Alert me of new notes |
CANSLIM.net Company Profile |
SEC |
Zacks Reports |
StockTalk |
News |
Chart |
Request a new note
C
A N
S L
I M
|
MG
-
NYSE
Mistras Group Inc
DIVERSIFIED SERVICES - Bulding and Faci;ity Management Services
|
$23.90
|
-0.86
-3.47% |
$24.74
|
182,001
126.39% of 50 DAV
50 DAV is 144,000
|
$26.24
-8.92%
|
3/22/2012
|
$24.96
|
PP = $26.34
|
|
MB = $27.66
|
Most Recent Note - 3/23/2012 8:58:38 PM
Y - Finished near the session low today with a loss on lighter but still above average volume. The new pivot point cited in the 3/22/12 mid-day report is based on its 52-week high plus 10 cents after a 12-week base. It was previously noted - "Disciplined investors will watch for a volume-driven gain above the pivot to confirm a technical buy signal before taking any action. Found support well above its 200 DMA line and it has now rebounded to within -4.2% of its 52-week high. Fundamentals remain strong since it was dropped from the Featured Stocks list on 1/11/12. The number of top-rated funds owning its shares rose from 128 in Mar '11 to 185 in Dec '11, a reassuring sign concerning the I criteria."

>>> The latest Featured Stock Update with an annotated graph appeared on 1/6/2012. Click here.
View all notes |
Alert me of new notes |
CANSLIM.net Company Profile |
SEC |
Zacks Reports |
StockTalk |
News |
Chart |
Request a new note
C
A N
S L
I M
|
MKTX
-
NASDAQ
Marketaxess Holdings Inc
FINANCIAL SERVICES - Investment Brokerage - Nationa
|
$37.06
|
+0.74
2.04% |
$37.12
|
233,653
88.17% of 50 DAV
50 DAV is 265,000
|
$37.25
-0.51%
|
3/8/2012
|
$35.80
|
PP = $35.52
|
|
MB = $37.30
|
Most Recent Note - 3/22/2012 12:53:15 PM
Y - Rallying within close striking distance of its all-time high today and promptly rebounding back above its pivot point. The solid volume-driven gain on 3/16/12 helped clinch a technical buy signal. Its 50 DMA line defines important support to watch.
>>> The latest Featured Stock Update with an annotated graph appeared on 3/8/2012. Click here.
View all notes |
Alert me of new notes |
CANSLIM.net Company Profile |
SEC |
Zacks Reports |
StockTalk |
News |
Chart |
Request a new note
C
A N
S L
I M
|
Symbol/Exchange
Company Name
Industry Group |
PRICE |
CHANGE
(%Change) |
Day High |
Volume
(% DAV)
(% 50 day avg vol) |
52 Wk Hi
% From Hi |
Featured
Date |
Price
Featured |
Pivot Featured |
|
Max Buy |
NTES
-
NASDAQ
Netease.Com Inc Adr
INTERNET - Internet Information Providers
|
$59.71
|
+1.34
2.30% |
$60.00
|
674,462
106.20% of 50 DAV
50 DAV is 635,100
|
$59.26
0.76%
|
3/19/2012
|
$56.18
|
PP = $55.10
|
|
MB = $57.86
|
Most Recent Note - 3/22/2012 1:06:54 PM
G - Up again today after a gap up and volume-driven gain on the prior session, rallying further above its "max buy" level and getting extended from its prior base. Its old highs in the $55 area define initial support to watch on pullbacks.
>>> The latest Featured Stock Update with an annotated graph appeared on 10/9/2009. Click here.
View all notes |
Alert me of new notes |
CANSLIM.net Company Profile |
SEC |
Zacks Reports |
StockTalk |
News |
Chart |
Request a new note
C
A N
S L
I M
|
RAX
-
NYSE
Rackspace Hosting Inc
INTERNET - Internet Software and; Services
|
$57.00
|
+1.06
1.89% |
$57.89
|
2,102,722
102.10% of 50 DAV
50 DAV is 2,059,400
|
$58.66
-2.83%
|
2/2/2012
|
$46.69
|
PP = $45.55
|
|
MB = $47.83
|
Most Recent Note - 3/22/2012 1:10:31 PM
G - Down today with higher volume, yet it is up from the session's early lows following a gap down after an analyst downgrade. It recently had wedged up to a new 52-week high with gains lacking great volume conviction, and the last consolidation was noted as a little short of the 5-week minimum length for it to be considered a new flat base pattern. Its 50 DMA line coincides with the prior low in the $49 area, defining an important near-term support level to watch.
>>> The latest Featured Stock Update with an annotated graph appeared on 2/16/2012. Click here.
View all notes |
Alert me of new notes |
CANSLIM.net Company Profile |
SEC |
Zacks Reports |
StockTalk |
News |
Chart |
Request a new note
C
A N
S L
I M
|
RGR
-
NYSE
Sturm Ruger & Co Inc
CONSUMER DURABLES - Sporting Goods
|
$48.07
|
+0.14
0.29% |
$48.66
|
429,816
150.71% of 50 DAV
50 DAV is 285,200
|
$48.24
-0.35%
|
3/22/2012
|
$46.49
|
PP = $46.78
|
|
MB = $49.12
|
Most Recent Note - 3/23/2012 1:09:05 PM
Y - Holding its ground today. Featured in yellow in the prior mid-day report with pivot point cited based on its 52-week high plus 10 cents after a 5-week flat base pattern. It found support above its 50 DMA line while consolidating since hitting its old high on 2/22/12, and its considerable gap up gain with more than 4 times average volume helped it hit a new 52-week high and trigger a technical buy signal. Reported earnings +80% on +45% sales revenues for the quarter ended December 31, 2011 versus the year ago period. Its 3 latest quarterly comparisons showed strong earnings increases well above the +25% minimum guideline while sales revenues showed impressive acceleration. It also has a good annual earnings (A criteria). See the latest FSU analysis for more details and a new annotated graph.
>>> The latest Featured Stock Update with an annotated graph appeared on 3/22/2012. Click here.
View all notes |
Alert me of new notes |
CANSLIM.net Company Profile |
SEC |
Zacks Reports |
StockTalk |
News |
Chart |
Request a new note
C
A N
S L
I M
|
RRTS
-
NYSE
Roadrunner Trans Systems
TRANSPORTATION - Air Delivery and Freight Service
|
$17.65
|
+0.07
0.40% |
$17.79
|
39,062
26.50% of 50 DAV
50 DAV is 147,400
|
$18.59
-5.06%
|
2/10/2012
|
$17.40
|
PP = $17.50
|
|
MB = $18.38
|
Most Recent Note - 3/22/2012 10:48:28 AM
Y - Small gap down today, and it has been sputtering since a "negative reversal" on 3/16/12 for a loss on above average volume after touching a new 52-week high. A new pivot point was not cited, yet it has built a base-on-base pattern while consolidating above prior highs in the $17 area and above its 50 DMA line defining support to watch on pullbacks.
>>> The latest Featured Stock Update with an annotated graph appeared on 2/13/2012. Click here.
View all notes |
Alert me of new notes |
CANSLIM.net Company Profile |
SEC |
Zacks Reports |
StockTalk |
News |
Chart |
Request a new note
C
A N
S L
I M
|
SHFL
-
NASDAQ
Shuffle Master Inc
MANUFACTURING - Diversified Machinery
|
$17.36
|
-0.05
-0.29% |
$17.62
|
504,187
88.61% of 50 DAV
50 DAV is 569,000
|
$18.38
-5.55%
|
3/6/2012
|
$17.07
|
PP = $15.25
|
|
MB = $16.01
|
Most Recent Note - 3/19/2012 7:03:54 PM
G - Hit another new 52-week high today with its 10th gain in the span of 11 sessions. It may produce more climactic gains, but it is extended from any sound base pattern. Its 50 DMA line defines support to watch on pullbacks.
>>> The latest Featured Stock Update with an annotated graph appeared on 3/15/2012. Click here.
View all notes |
Alert me of new notes |
CANSLIM.net Company Profile |
SEC |
Zacks Reports |
StockTalk |
News |
Chart |
Request a new note
C
A N
S L
I M
|
Symbol/Exchange
Company Name
Industry Group |
PRICE |
CHANGE
(%Change) |
Day High |
Volume
(% DAV)
(% 50 day avg vol) |
52 Wk Hi
% From Hi |
Featured
Date |
Price
Featured |
Pivot Featured |
|
Max Buy |
SWI
-
NYSE
Solarwinds Inc
COMPUTER SOFTWARE and SERVICES - Application Software
|
$38.75
|
-0.18
-0.46% |
$39.22
|
966,338
83.38% of 50 DAV
50 DAV is 1,158,900
|
$40.44
-4.18%
|
1/26/2012
|
$32.36
|
PP = $33.78
|
|
MB = $35.47
|
Most Recent Note - 3/21/2012 12:11:27 PM
G - Touched a new all-time high today after a less than 4-week consolidation while remaining well above its 50 DMA line and prior chart highs defining support levels. Earnings below the +25% guideline for the Dec '11 quarter raised fundamental concerns. See the latest FSU analysis for more details and a new annotated graph.
>>> The latest Featured Stock Update with an annotated graph appeared on 3/16/2012. Click here.
View all notes |
Alert me of new notes |
CANSLIM.net Company Profile |
SEC |
Zacks Reports |
StockTalk |
News |
Chart |
Request a new note
C
A N
S L
I M
|
SXCI
-
NASDAQ
S X C Health Solutions
COMPUTER SOFTWARE and SERVICES - Healthcare Information Service
|
$72.21
|
-0.02
-0.03% |
$72.46
|
112,390
27.29% of 50 DAV
50 DAV is 411,800
|
$76.42
-5.51%
|
2/23/2012
|
$68.24
|
PP = $66.05
|
|
MB = $69.35
|
Most Recent Note - 3/19/2012 6:35:20 PM
G - Hovering in a tight range for the past 3 weeks, and it is extended from its prior base. Prior highs in the $66 area define support to watch on pullbacks.
>>> The latest Featured Stock Update with an annotated graph appeared on 3/6/2012. Click here.
View all notes |
Alert me of new notes |
CANSLIM.net Company Profile |
SEC |
Zacks Reports |
StockTalk |
News |
Chart |
Request a new note
C
A N
S L
I M
|
TDG
-
NYSE
Transdigm Group Inc
AEROSPACE/DEFENSE - Aerospace/Defense Products and; Services
|
$115.36
|
-0.10
-0.09% |
$115.52
|
185,495
45.21% of 50 DAV
50 DAV is 410,300
|
$121.48
-5.04%
|
2/29/2012
|
$120.10
|
PP = $118.93
|
|
MB = $124.88
|
Most Recent Note - 3/19/2012 1:28:05 PM
Y - Sputtering since its 3/06/12 gap down, and it remains below its latest pivot point after encountering distributional pressure. Its recent low ($111.03 on 3/06/12) and its 50 DMA line define important chart support to watch above prior highs in the $102 area.
>>> The latest Featured Stock Update with an annotated graph appeared on 2/10/2012. Click here.
View all notes |
Alert me of new notes |
CANSLIM.net Company Profile |
SEC |
Zacks Reports |
StockTalk |
News |
Chart |
Request a new note
C
A N
S L
I M
|
TNGO
-
NASDAQ
Tangoe Inc
COMPUTER SOFTWARE and SERVICES - Technical and System Software
|
$18.87
|
-0.26
-1.36% |
$19.23
|
532,177
139.09% of 50 DAV
50 DAV is 382,600
|
$19.90
-5.18%
|
2/13/2012
|
$15.39
|
PP = $16.51
|
|
MB = $17.34
|
Most Recent Note - 3/23/2012 1:14:43 PM
G - Perched just -4.8% off its 52-week high today and working on a base-on-base type pattern. Consolidating above prior highs in the $16 area and its 50 DMA line defining support to watch.
>>> The latest Featured Stock Update with an annotated graph appeared on 2/14/2012. Click here.
View all notes |
Alert me of new notes |
CANSLIM.net Company Profile |
SEC |
Zacks Reports |
StockTalk |
News |
Chart |
Request a new note
C
A N
S L
I M
|
TSCO
-
NASDAQ
Tractor Supply Co
SPECIALTY RETAIL - Specialty Retail, Other
|
$86.04
|
-1.71
-1.95% |
$87.62
|
560,714
79.41% of 50 DAV
50 DAV is 706,100
|
$88.97
-3.29%
|
1/12/2012
|
$79.12
|
PP = $75.58
|
|
MB = $79.36
|
Most Recent Note - 3/22/2012 10:33:12 AM
Y - Color code is changed to yellow after a brief consolidation in a tight range with mostly light volume. No new pivot point is cited, however they teach in the Certification that a stock may be bought from its first successful test of support at the 10-week moving average (WMA) up to +5% above the latest high following an earlier technical breakout. In this case that could be $88.65 on 2/28/12 plus another 5%, however the further one chases any stock above its pivot point the greater the chances are than an ordinary pullback may necessitate selling - as disciplined investors know to always limit losses if ever any stock falls more than 7% from their purchase price! Its 50 DMA line defines support to watch on pullbacks.
>>> The latest Featured Stock Update with an annotated graph appeared on 2/27/2012. Click here.
View all notes |
Alert me of new notes |
CANSLIM.net Company Profile |
SEC |
Zacks Reports |
StockTalk |
News |
Chart |
Request a new note
C
A N
S L
I M
|
Symbol/Exchange
Company Name
Industry Group |
PRICE |
CHANGE
(%Change) |
Day High |
Volume
(% DAV)
(% 50 day avg vol) |
52 Wk Hi
% From Hi |
Featured
Date |
Price
Featured |
Pivot Featured |
|
Max Buy |
UA
-
NYSE
Under Armour Inc Cl A
CONSUMER NON-DURABLES - Textile - Apparel Clothing
|
$97.10
|
-0.64
-0.65% |
$97.69
|
597,127
47.03% of 50 DAV
50 DAV is 1,269,800
|
$99.10
-2.02%
|
2/15/2012
|
$85.77
|
PP = $84.86
|
|
MB = $89.10
|
Most Recent Note - 3/22/2012 10:35:02 AM
G - It is extended from its last sound base pattern and recent gains above its pivot point did not have volume sufficient to trigger a proper technical buy signal. Pyramiding into a position can help investors avoid chasing stocks too far above their pivot point.
>>> The latest Featured Stock Update with an annotated graph appeared on 2/15/2012. Click here.
View all notes |
Alert me of new notes |
CANSLIM.net Company Profile |
SEC |
Zacks Reports |
StockTalk |
News |
Chart |
Request a new note
C
A N
S L
I M
|
UBNT
-
NASDAQ
Ubiquiti Networks Inc
TELECOMMUNICATIONS - Diversified Communication Serv
|
$30.38
|
+1.66
5.78% |
$31.32
|
708,160
237.24% of 50 DAV
50 DAV is 298,500
|
$29.33
3.58%
|
1/27/2012
|
$22.25
|
PP = $23.14
|
|
MB = $24.30
|
Most Recent Note - 3/23/2012 9:04:37 PM
G - Rallied for a new 52-week high today with a solid gain backed by more than twice its daily average volume, getting more extended from the previous base. Its 50 DMA line defines important near-term support to watch on pullbacks.
>>> The latest Featured Stock Update with an annotated graph appeared on 3/21/2012. Click here.
View all notes |
Alert me of new notes |
CANSLIM.net Company Profile |
SEC |
Zacks Reports |
StockTalk |
News |
Chart |
Request a new note
C
A N
S L
I M
|
ULTA
-
NASDAQ
Ulta Salon Cosm & Frag
SPECIALTY RETAIL - Specialty Retail, Other
|
$93.55
|
-0.04
-0.04% |
$93.78
|
738,743
101.48% of 50 DAV
50 DAV is 728,000
|
$93.88
-0.35%
|
1/11/2012
|
$71.97
|
PP = $75.80
|
|
MB = $79.59
|
Most Recent Note - 3/19/2012 6:43:49 PM
G - ULTA may produce more climactic gains, however, while hovering near its all-time high it has been repeatedly noted - "Extended from any sound base pattern, meanwhile its prior highs near $75 and its 50 DMA line define important chart support."
>>> The latest Featured Stock Update with an annotated graph appeared on 2/28/2012. Click here.
View all notes |
Alert me of new notes |
CANSLIM.net Company Profile |
SEC |
Zacks Reports |
StockTalk |
News |
Chart |
Request a new note
C
A N
S L
I M
|
V
-
NYSE
Visa Inc Cl A
DIVERSIFIED SERVICES - Business/Management Services
|
$118.78
|
+1.50
1.28% |
$119.00
|
2,538,836
67.30% of 50 DAV
50 DAV is 3,772,400
|
$119.72
-0.79%
|
3/12/2012
|
$116.53
|
PP = $119.46
|
|
MB = $125.43
|
Most Recent Note - 3/19/2012 6:46:14 PM
Y - Touched a new all-time high with a gain on average volume today. Volume-driven gains may trigger a new (or add-on) technical buy signal, meanwhile its 50 DMA line defines support to watch above prior highs in the $103-104 area.
>>> The latest Featured Stock Update with an annotated graph appeared on 3/7/2012. Click here.
View all notes |
Alert me of new notes |
CANSLIM.net Company Profile |
SEC |
Zacks Reports |
StockTalk |
News |
Chart |
Request a new note
C
A N
S L
I M
|