You are not logged in.
This means you
CAN ONLY VIEW reports that were published prior to Monday, April 14, 2025.
You
MUST UPGRADE YOUR MEMBERSHIP if you want to see any current reports.
AFTER MARKET UPDATE - WEDNESDAY, MARCH 24TH, 2010
Previous After Market Report Next After Market Report >>>
|
|
|
|
DOW |
-52.68 |
10,836.15 |
-0.48% |
|
Volume |
1,022,760,830 |
+4% |
|
Volume |
2,332,368,080 |
+0% |
|
NASDAQ |
-16.48 |
2,398.76 |
-0.68% |
|
Advancers |
1,025 |
33% |
|
Advancers |
805 |
29% |
|
S&P 500 |
-6.45 |
1,167.72 |
-0.55% |
|
Decliners |
2,003 |
64% |
|
Decliners |
1,894 |
67% |
|
Russell 2000 |
-6.62 |
683.68 |
-0.96% |
|
52 Wk Highs |
270 |
|
|
52 Wk Highs |
124 |
|
|
S&P 600 |
-4.21 |
363.79 |
-1.14% |
|
52 Wk Lows |
4 |
|
|
52 Wk Lows |
8 |
|
|
 |
Major Averages Pull Back From Recovery Highs
Adam Sarhan, Contributing Writer,
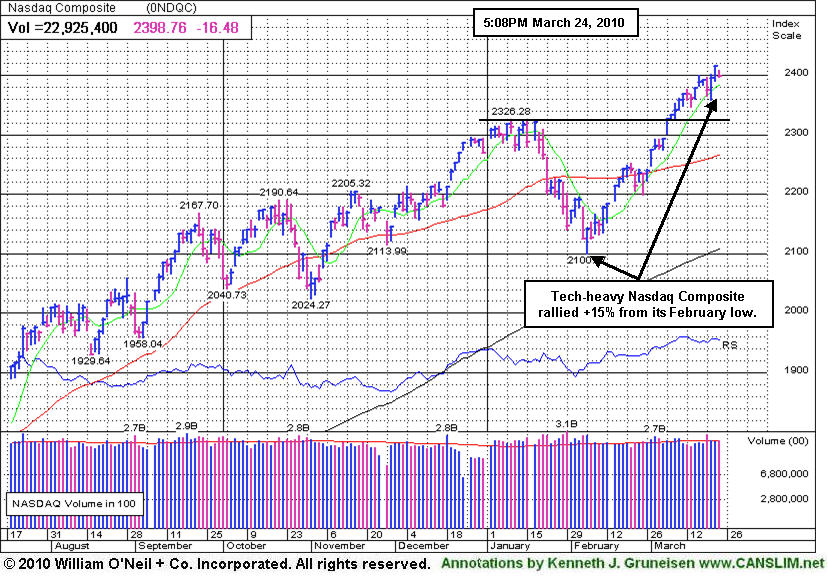
The major averages, US Treasuries, the euro and a slew of commodities pulled back as the US dollar advanced after Portugal's debt was downgraded by Fitch. The volume totals on the NYSE and on the Nasdaq exchange were reported slightly higher compared to Monday's totals. Decliners led advancers by a 2-to-1 ratio on the NYSE and on the Nasdaq exchange. There were 29 high-ranked companies from the CANSLIM.net Leaders List that made a new 52-week high and appeared on the CANSLIM.net BreakOuts Page, lower than the 77 issues that appeared on the prior session. New 52-week highs again overwhelmingly trumped new lows on both exchanges.
Overnight, Fitch Ratings downgraded Portugal due to its ballooning debt. This coupled with the fact that France and Germany are close to reaching a deal with the IMF to rescue Greece sent the euro plunging. Investors are concerned that more European countries will need to be bailed out as they struggle to deal with their mounting debt. The euro fell against 12 of its 16 peers and hit a new 10-month low against the greenback. The US dollar's rally put pressure on US stocks and commodities. The Reuters/Jefferies CRB Index of commodities slid to a five-week low, dragged lower by oil, gold, lead, and copper.
Economic data was mixed on Wednesday: durable goods were up while new home sales fell. Durable goods topped estimates and rose for a third consecutive month which was a healthy sign for the economic recovery. Meanwhile, new home sales fell -2.2% to a 308,000 annual rate. Overseas, Europe received some healthy economic data: European services and manufacturing grew at the fastest pace since August 2007 and German business confidence rose.
The fact that there has only been one distribution day since the follow-though-day (FTD) bodes well for this nascent rally. It is also a welcome sign to see the market continue to improve as investors digest the latest round of stronger than expected economic and earnings data. Remember that now that a new rally has been confirmed, the window is open to proactively be buying high quality breakouts meeting the investment system guidelines. Trade accordingly.
Professional Money Management Services - A Winning System - Inquire today!
Our skilled team of portfolio managers knows how to follow the rules of this fact-based investment system. We do not follow opinion or the "conviction list" of some large Wall Street institution which would have us fully invested even during horrific bear markets. Instead, we remain fluid and only buy the best stocks when they are triggering proper technical buy signals. If you are not completely satisfied with the way your portfolio is being managed, Click here to get connected with one of our portfolio managers. *Accounts over $250,000 please. ** Serious inquires only, please
PICTURED: The tech-heavy Nasdaq Composite rallied +15% from its February low.
|
|
|
 |
Gold and Silver Index Dives Below 50 and 200 Day Average Lines
Kenneth J. Gruneisen - Passed the CAN SLIM® Master's Exam
Financial shares were mixed as the Broker/Dealer Index ($XBD -0.61%) ended slightly lower and the Bank Index ($BKX +0.42%) posted a small gain. Meanwhile most other groups fell on Wednesday, and the Retail Index ($RLX -1.13%) was among the many negative influences on the major averages. The Semiconductor Index ($SOX -1.91%) led the tech sector lower, followed by smaller losses for the Networking Index ($NWX -0.91%), Biotechnology Index ($BTK -0.71%), and Internet Index ($IIX -0.40%). Defensive areas also suffered losses as the Healthcare Index ($HMO -1.27%) fell and the Oil Services Index ($OSX -0.85%) and Integrated Oil Index ($XOI -0.80%) lost ground.
Charts courtesy www.stockcharts.com
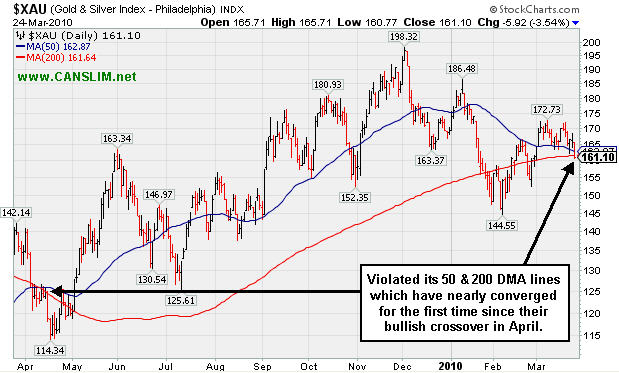
PICTURED: The Gold & Silver Index ($XAU -3.54%) violated its 50-day and 200-day moving average lines which have nearly converged for the first time since their bullish crossover in April. A bearish crossover would not bode well for gold bugs, as it could signal further downside for the near term.
| Oil Services |
$OSX |
203.14 |
-1.75 |
-0.85% |
+4.22% |
| Healthcare |
$HMO |
1,580.40 |
-20.37 |
-1.27% |
+7.30% |
| Integrated Oil |
$XOI |
1,070.49 |
-8.60 |
-0.80% |
+0.21% |
| Semiconductor |
$SOX |
365.37 |
-7.10 |
-1.91% |
+1.52% |
| Networking |
$NWX |
256.17 |
-2.34 |
-0.91% |
+10.87% |
| Internet |
$IIX |
246.95 |
-0.99 |
-0.40% |
+5.60% |
| Broker/Dealer |
$XBD |
117.52 |
-0.72 |
-0.61% |
+2.15% |
| Retail |
$RLX |
446.25 |
-5.12 |
-1.13% |
+8.54% |
| Gold & Silver |
$XAU |
161.10 |
-5.92 |
-3.54% |
-4.25% |
| Bank |
$BKX |
52.34 |
+0.22 |
+0.42% |
+22.55% |
| Biotech |
$BTK |
1,244.67 |
-8.90 |
-0.71% |
+32.11% |
|
|
|
 |
Upward Trendline Defines Initial Chart Support Level
Kevin Thomas
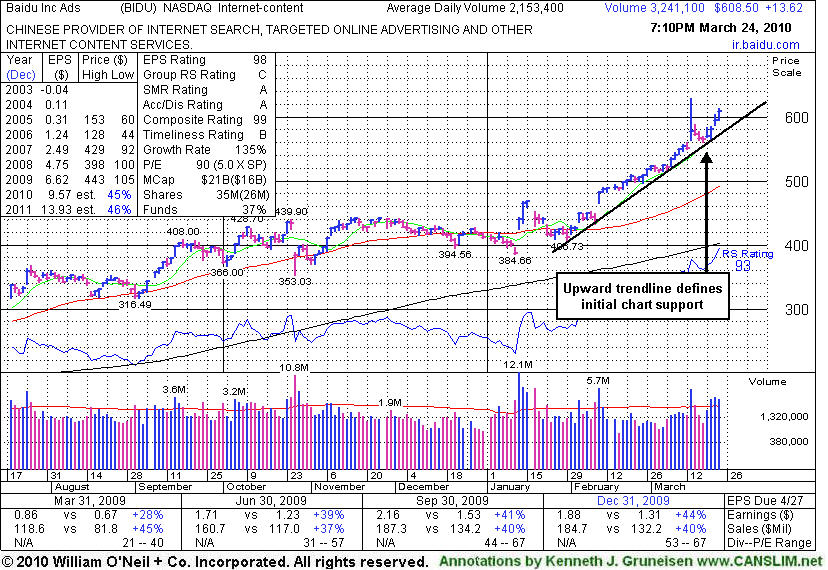
Baidu.com, Inc. (BIDU +$13.62 or +2.29% to $608.50) traded up today for a 4th consecutive gain and yet another new high close. It is extended from any sound base now. An upward trendline connecting its January-March lows is an initial chart support level to watch, where a subsequent violation may prompt investors to lock in gains. It has marched steadily higher since reporting earnings and raising guidance on 2/10/10 when its considerable gain was backed by volume more than 3 times average. No overhead supply exists to hinder its progress, but it is too extended from any sound base to be bought within the guidelines now. It has risen from $357 when appearing in this FSU section on 9/08/09 under the headline Baidu Near Multi-Year Highs, But Decelerating Growth Is A Concern.
Compelling proof that institutional investors are accumulating the high-ranked Internet- Content firm's shares is that the number of top-rated funds owning BIDU's shares rose from 103 in Dec '08 to 207 in Dec '09. That is solid evidence its shares were being accumulated by the institutional (I criteria) crowd. It has a stellar sales and earnings history that satisfies the C & A criteria. However it has not formed any recent sound base and is extended from an earlier "double bottom" base pattern that was identified based upon its December low and January's lower low. Technically it triggered a technical buy signal and was featured in yellow on 1/13/10 as it cleared the 12/29/09 high mentioned in the 1/12/10 note. (See the "view all notes" links to review prior analysis on any stock.)
|
|
|
Color Codes Explained :
Y - Better candidates highlighted by our
staff of experts.
G - Previously featured
in past reports as yellow but may no longer be buyable under the
guidelines.
***Last / Change / Volume quote data in this table corresponds with the timestamp on the note***
Symbol/Exchange
Company Name
Industry Group |
Last |
Chg. |
Vol
% DAV |
Date Featured |
Price Featured |
Latest Pivot Point
Featured |
Status |
| Latest Max Buy Price |
ARUN
- NASDAQ
Aruba Networks Inc
COMPUTER HARDWARE - Networking & Communication Dev
|
$12.55
|
-0.38
|
770,834
51% DAV
1,504,400
|
2/19/2010
(Date
Featured) |
$12.71
(Price
Featured) |
PP = $11.94 |
G |
| MB = $12.54 |
Most Recent Note - 3/24/2010 4:51:40 PM
G - Loss today on light volume, consolidating after recent gains on heavy volume. Support to watch is defined by prior chart highs and its 50 DMA line in the upper $11 area.
>>> The latest Featured Stock Update with an annotated graph appeared on 3/11/2010. click here.
|
|
C
A
S
I |
News |
Chart |
SEC
View all notes Alert
me of new notes
Company
Profile
|
BIDU
- NASDAQ
Baidu Inc Ads
INTERNET - Internet Information Providers
|
$608.50
|
+13.62
|
3,249,851
154% DAV
2,113,400
|
1/13/2010
(Date
Featured) |
$431.25
(Price
Featured) |
PP = $426.75 |
G |
| MB = $448.09 |
Most Recent Note - 3/24/2010 4:52:43 PM
G - Up today for a 4th consecutive session and yet another new high close. It is extended from any sound base now. An upward trendline connecting its January-March lows is an initial chart support level to watch, where a subsequent violation may prompt investors to lock in gains.
>>> The latest Featured Stock Update with an annotated graph appeared on 3/24/2010. click here.
|
|
C
A
S
I |
News |
Chart |
SEC
View all notes Alert
me of new notes
Company
Profile
|
BRLI
- NASDAQ
Bio Reference Labs Inc
HEALTH SERVICES - Medical Laboratories & Researc
|
$43.28
|
-0.89
|
87,343
91% DAV
95,500
|
2/12/2010
(Date
Featured) |
$39.02
(Price
Featured) |
PP = $40.97 |
G |
| MB = $43.02 |
Most Recent Note - 3/24/2010 4:54:13 PM
G - Loss today with average volume. Consolidating very near its 52-week high since its negative reversal on 3/12/10. It is slightly extended from its prior base. Prior chart highs and its 50 DMA line coincide in the $40 area, defining important support to watch.
>>> The latest Featured Stock Update with an annotated graph appeared on 3/22/2010. click here.
|
|
C
A
S
I |
News |
Chart |
SEC
View all notes Alert
me of new notes
Company
Profile
|
CISG
- NASDAQ
Cninsure Inc Ads
INSURANCE - Insurance Brokers
|
$26.78
|
-0.46
|
267,665
122% DAV
219,000
|
3/3/2010
(Date
Featured) |
$24.38
(Price
Featured) |
PP = $23.10 |
G |
| MB = $24.26 |
Most Recent Note - 3/24/2010 4:58:00 PM
G - Loss today on average volume after a considerable gain on 3/23/10 with 3 times average volume for a new 52-week high. Extended from a sound base, yet no overhead supply remains to act as resistance. It rose from a 20-week double bottom base with 8 times average volume as it was featured in the 3/03/10 mid-day report (read here).
>>> The latest Featured Stock Update with an annotated graph appeared on 3/23/2010. click here.
|
|
C
A
S
I |
News |
Chart |
SEC
View all notes Alert
me of new notes
Company
Profile
|
CRM
- NYSE
Salesforce.com Inc
INTERNET - Internet Software & Services
|
$76.16
|
-0.94
|
1,183,353
59% DAV
2,020,900
|
3/5/2010
(Date
Featured) |
$72.28
(Price
Featured) |
PP = $75.53 |
Y |
| MB = $79.31 |
Most Recent Note - 3/24/2010 5:01:09 PM
Y - Second consecutive small loss today on light volume, consolidating above prior chart highs in the $75 area. It recently wedged higher, rising from a 9-week base without the required volume to trigger a proper technical buy signal.
>>> The latest Featured Stock Update with an annotated graph appeared on 3/5/2010. click here.
|
|
C
A
S
I |
News |
Chart |
SEC
View all notes Alert
me of new notes
Company
Profile
|
CTRP
- NASDAQ
Ctrip.com Intl Ltd Adr
LEISURE - Resorts & Casinos
|
$39.26
|
+1.62
|
2,718,599
125% DAV
2,178,200
|
3/1/2010
(Date
Featured) |
$38.23
(Price
Featured) |
PP = $38.50 |
Y |
| MB = $40.43 |
Most Recent Note - 3/24/2010 5:05:47 PM
Y - Gain on slightly above average volume today, closing 14 cents below its best ever close. Found prompt support near its 50 DMA line this week. Color code is changed to yellow based on its resilience, however a gain above its pivot point or its most recent chart highs with +50% above average volume or more is still needed to confirm a fresh technical buy signal. Completed an offering of additional shares on 3/03/10, shortly after featured in the March 2010 issue of CANSLIM.net News (read here).
>>> The latest Featured Stock Update with an annotated graph appeared on 3/18/2010. click here.
|
|
C
A
S
I |
News |
Chart |
SEC
View all notes Alert
me of new notes
Company
Profile
|
EZPW
- NASDAQ
Ezcorp Inc Cl A
SPECIALTY RETAIL - Specialty Retail, Other
|
$21.09
|
+0.42
|
742,698
138% DAV
538,900
|
2/19/2010
(Date
Featured) |
$19.03
(Price
Featured) |
PP = $18.80 |
G |
| MB = $19.74 |
Most Recent Note - 3/24/2010 5:16:14 PM
G - Gain today with above average volume, consolidating above its 50 DMA line and recent chart lows that define important support to watch. Its positive reversal on 3/16/10 was a reassuring sign of support after its 3/15/10 a loss with volume nearly 4 times average volume indicated distributional pressure.
>>> The latest Featured Stock Update with an annotated graph appeared on 3/8/2010. click here.
|
|
C
A
S
I |
News |
Chart |
SEC
View all notes Alert
me of new notes
Company
Profile
|
GMCR
- NASDAQ
Green Mtn Coffee Roastrs
FOOD & BEVERAGE - Processed & Packaged Goods
|
$95.13
|
-0.34
|
738,086
57% DAV
1,294,400
|
2/26/2010
(Date
Featured) |
$84.39
(Price
Featured) |
PP = $88.75 |
G |
| MB = $93.19 |
Most Recent Note - 3/24/2010 6:03:28 PM
G - Second consecutive small loss on below average volume, still consolidating near all-time highs. Its high volume gain on 3/08/10 triggered a new technical buy signal. It is slightly extended from its latest sound base, and initial support to watch is prior chart highs in the $86-88 area.
>>> The latest Featured Stock Update with an annotated graph appeared on 3/12/2010. click here.
|
|
C
A
S
I |
News |
Chart |
SEC
View all notes Alert
me of new notes
Company
Profile
|
ISRG
- NASDAQ
Intuitive Surgical Inc
HEALTH SERVICES - Medical Appliances & Equipment
|
$346.12
|
-2.85
|
457,028
87% DAV
524,500
|
1/22/2010
(Date
Featured) |
$340.40
(Price
Featured) |
PP = $314.00 |
G |
| MB = $329.70 |
Most Recent Note - 3/24/2010 6:17:15 PM
G - Loss today on near average volume. Consolidating near prior chart highs ($346) and just above its 50 DMA line (now $338), important support levels to watch. As recently noted, it did not trigger a technical buy signal in recent weeks.
>>> The latest Featured Stock Update with an annotated graph appeared on 3/16/2010. click here.
|
|
C
A
S
I |
News |
Chart |
SEC
View all notes Alert
me of new notes
Company
Profile
|
PCLN
- NASDAQ
Priceline.com Inc
INTERNET - Internet Software & Services
|
$399.55
|
-4.72
|
584,812
N/A
|
11/1/2002
(Date
Featured) |
$399.55
(Price
Featured) |
PP = $428.20 |
Y |
| MB = $449.61 |
Most Recent Note - 1/2/2011
Y - Returns to Featured Stocks list with its appearance in the January 2011 CANSLIM.net News including detailed analysis and annotated daily and weekly graphs.
>>> The latest Featured Stock Update with an annotated graph appeared on 3/10/2010. click here.
|
|
C
A
S
I |
News |
Chart |
SEC
View all notes Alert
me of new notes
Company
Profile
|
PEGA
- NASDAQ
Pegasystems Inc
COMPUTER SOFTWARE & SERVICES - Business Software & Services
|
$38.38
|
-0.73
|
94,317
43% DAV
220,600
|
2/26/2010
(Date
Featured) |
$36.00
(Price
Featured) |
PP = $38.55 |
Y |
| MB = $40.48 |
Most Recent Note - 3/24/2010 6:24:03 PM
Y - Hit a new all-time high while trading up briefly today, then negatively reversed and closed near its pivot point and at the session low with a loss on light volume. Consolidating in a tight range near all-time highs since a considerable gap up gain on 3/15/10 triggered a technical buy signal. Prior chart highs near $37-38 are initial chart support above its 50 DMA line.
>>> The latest Featured Stock Update with an annotated graph appeared on 3/15/2010. click here.
|
|
C
A
S
I |
News |
Chart |
SEC
View all notes Alert
me of new notes
Company
Profile
|
ROVI
- NASDAQ
Rovi Corp
COMPUTER SOFTWARE & SERVICES - Security Software & Services
|
$37.96
|
-0.37
|
740,077
54% DAV
1,363,200
|
2/25/2010
(Date
Featured) |
$33.54
(Price
Featured) |
PP = $34.87 |
G |
| MB = $36.61 |
Most Recent Note - 3/24/2010 6:25:40 PM
G - Small loss today on light volume, still hovering within -1.4% of its all-time high. It remains extended from its latest base, while prior chart highs in the $34 area define an important support level to watch on pullbacks.
>>> The latest Featured Stock Update with an annotated graph appeared on 3/17/2010. click here.
|
|
C
A
S
I |
News |
Chart |
SEC
View all notes Alert
me of new notes
Company
Profile
|
SIRO
- NASDAQ
Sirona Dental Systems
HEALTH SERVICES - Medical Instruments & Supplies
|
$37.76
|
+0.13
|
658,477
113% DAV
582,000
|
2/16/2010
(Date
Featured) |
$36.43
(Price
Featured) |
PP = $36.15 |
Y |
| MB = $37.96 |
Most Recent Note - 3/24/2010 6:27:14 PM
Y - Small gain today on average volume, finishing 4 cents below its best ever close. Trading in a very tight range for the past few weeks, perched very near its max buy level. Prior chart highs and its 50 DMA line in the $35-36 area define important support to watch.
>>> The latest Featured Stock Update with an annotated graph appeared on 3/9/2010. click here.
|
|
C
A
S
I |
News |
Chart |
SEC
View all notes Alert
me of new notes
Company
Profile
|
ULTA
- NASDAQ
Ulta Salon Cosm & Frag
SPECIALTY RETAIL - Specialty Retail, Other
|
$21.97
|
-0.24
|
288,710
78% DAV
371,800
|
3/12/2010
(Date
Featured) |
$22.81
(Price
Featured) |
PP = $21.72 |
Y |
| MB = $22.81 |
Most Recent Note - 3/24/2010 6:29:50 PM
Y - Closed in the upper third of its intra-day range today with a small loss on lighter than average volume. Consolidating just above its pivot point, prior chart highs in the $21 area now define a very important technical support level. A detailed Stock Bulletin with annotated graph was published soon after it was featured in the 3/12/10 mid-day report.
>>> The latest Featured Stock Update with an annotated graph appeared on 3/12/2010. click here.
|
|
C
A
S
I |
News |
Chart |
SEC
View all notes Alert
me of new notes
Company
Profile
|
VPRT
- NASDAQ
Vistaprint Nv
DIVERSIFIED SERVICES - Business/Management Services
|
$61.46
|
-0.46
|
199,446
43% DAV
462,000
|
3/1/2010
(Date
Featured) |
$57.72
(Price
Featured) |
PP = $59.70 |
Y |
| MB = $62.69 |
Most Recent Note - 3/24/2010 6:30:55 PM
Y - Small loss today on very light volume, closing only -2.1% from its 3/09/10 all-time high. It did not trigger a technical buy signal since it was featured in the March 2010 CANSLIM.net News monthly newsletter (read here). As previously noted, "Its gain on 3/02/10 was below the volume guidelines for buyable breakouts under the investment system."
>>> The latest Featured Stock Update with an annotated graph appeared on 3/19/2010. click here.
|
|
C
A
S
I |
News |
Chart |
SEC
View all notes Alert
me of new notes
Company
Profile
|
|
|
|
THESE ARE NOT BUY RECOMMENDATIONS!
Comments contained in the body of this report are technical
opinions only. The material herein has been obtained
from sources believed to be reliable and accurate, however,
its accuracy and completeness cannot be guaranteed.
This site is not an investment advisor, hence it does
not endorse or recommend any securities or other investments.
Any recommendation contained in this report may not
be suitable for all investors and it is not to be deemed
an offer or solicitation on our part with respect to
the purchase or sale of any securities. All trademarks,
service marks and trade names appearing in this report
are the property of their respective owners, and are
likewise used for identification purposes only.
This report is a service available
only to active Paid Premium Members.
You may opt-out of receiving report notifications
at any time. Questions or comments may be submitted
by writing to Premium Membership Services 665 S.E. 10 Street, Suite 201 Deerfield Beach, FL 33441-5634 or by calling 1-800-965-8307
or 954-785-1121.
|
|
|


