You are not logged in.
This means you
CAN ONLY VIEW reports that were published prior to Monday, April 14, 2025.
You
MUST UPGRADE YOUR MEMBERSHIP if you want to see any current reports.
AFTER MARKET UPDATE - TUESDAY, MARCH 23RD, 2010
Previous After Market Report Next After Market Report >>>
|
|
|
|
DOW |
+102.94 |
10,888.83 |
+0.95% |
|
Volume |
983,776,260 |
+3% |
|
Volume |
2,329,997,860 |
-1% |
|
NASDAQ |
+19.84 |
2,415.24 |
+0.83% |
|
Advancers |
2,190 |
70% |
|
Advancers |
1,806 |
64% |
|
S&P 500 |
+8.36 |
1,174.17 |
+0.72% |
|
Decliners |
817 |
26% |
|
Decliners |
875 |
31% |
|
Russell 2000 |
+7.39 |
690.30 |
+1.08% |
|
52 Wk Highs |
356 |
|
|
52 Wk Highs |
249 |
|
|
S&P 600 |
+3.61 |
368.00 |
+0.99% |
|
52 Wk Lows |
6 |
|
|
52 Wk Lows |
11 |
|
|
 |
Major Averages Continue Marching To New Recovery Highs
Adam Sarhan, Contributing Writer,
The major averages ended higher after stronger-than-expected data was released from the ailing housing market. The volume total on the NYSE was slightly higher compared to Monday's totals, while volume was reported slightly lower on the Nasdaq exchange. Advancers led decliners by more than a 2-to-1 ratio on the NYSE and on the Nasdaq exchange. There were 77 high-ranked companies from the CANSLIM.net Leaders List that made a new 52-week high and appeared on the CANSLIM.net BreakOuts Page, higher than the 45 issues that appeared on the prior session. New 52-week highs again overwhelmingly trumped new lows on both exchanges.
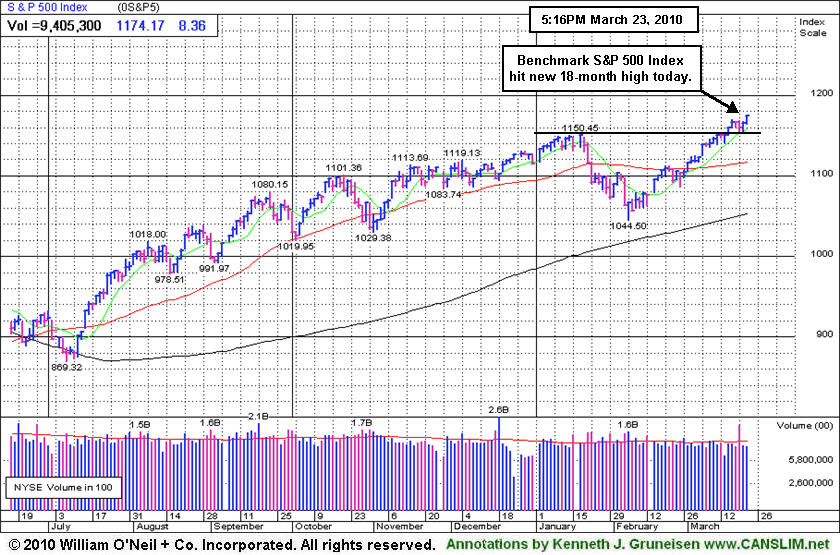
The benchmark S&P 500 Index and all other major averages rallied to new recovery highs after the National Association of Realtors said existing US home sales slowed to 0.6% last month which topped estimates. February's reading was also higher from January's -7.2% decline. Elsewhere, KB Home (KBH -1.66%) gapped down on above average volume after the company released its latest earnings report. Fundamentally, housing stocks continue to woefully underperform but their technicals are quietly improving.
The fact that there has only been one distribution day since the follow-though-day (FTD) bodes well for this nascent rally. It is also a welcome sign to see the market continue to improve as investors digest the latest round of stronger than expected economic and earnings data. Remember that now that a new rally has been confirmed, the window is open to proactively be buying high quality breakouts meeting the investment system guidelines. Trade accordingly.
Professional Money Management Services - A Winning System - Inquire today!
Our skilled team of portfolio managers knows how to follow the rules of this fact-based investment system. We do not follow opinion or the "conviction list" of some large Wall Street institution which would have us fully invested even during horrific bear markets. Instead, we remain fluid and only buy the best stocks when they are triggering proper technical buy signals. If you are not completely satisfied with the way your portfolio is being managed, Click here to get connected with one of our portfolio managers. *Accounts over $250,000 please. ** Serious inquires only, please
PICTURED: The S&P 500 Index rallied to a new 18-month high today.
|
|
|
 |
SOX Rallies to New Recovery High
Kenneth J. Gruneisen - Passed the CAN SLIM® Master's Exam
A solid gain helped the Semiconductor Index ($SOX +2.26%) blast to a new recovery high, leading the tech sector. The Biotechnology Index ($BTK +1.69%) posted a solid gain, followed by smaller gains from the Networking Index ($NWX +0.34%) and Internet Index ($IIX +0.39%). The Bank Index ($BKX +0.79%) also had a positive influence on the major averages while the Broker/Dealer Index ($XBD +0.22%) and Retail Index ($RLX +0.08%) posted smaller gains. Commodity-linked groups edged higher as the Gold & Silver Index ($XAU +0.32%), Oil Services Index ($OSX +0.47%), and Integrated Oil Index ($XOI +0.53%) posted small gains. The Healthcare Index ($HMO -0.26%) ended slightly lower, lagging other groups on Tuesday's mostly positive session.
Charts courtesy www.stockcharts.com
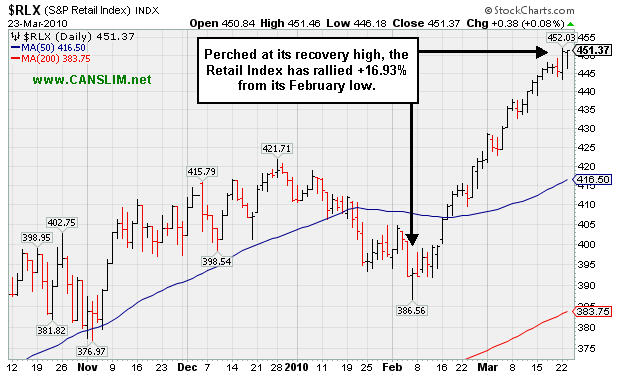
PICTURED: Perched at its recovery high, the Retail Index has rallied +16.93% from its February low.
| Oil Services |
$OSX |
204.89 |
+0.96 |
+0.47% |
+5.11% |
| Healthcare |
$HMO |
1,600.77 |
-4.25 |
-0.26% |
+8.68% |
| Integrated Oil |
$XOI |
1,079.09 |
+5.66 |
+0.53% |
+1.02% |
| Semiconductor |
$SOX |
372.47 |
+8.22 |
+2.26% |
+3.49% |
| Networking |
$NWX |
258.51 |
+0.88 |
+0.34% |
+11.88% |
| Internet |
$IIX |
247.94 |
+0.97 |
+0.39% |
+6.02% |
| Broker/Dealer |
$XBD |
118.24 |
+0.26 |
+0.22% |
+2.77% |
| Retail |
$RLX |
451.37 |
+0.38 |
+0.08% |
+9.79% |
| Gold & Silver |
$XAU |
167.02 |
+0.53 |
+0.32% |
-0.73% |
| Bank |
$BKX |
52.12 |
+0.41 |
+0.79% |
+22.03% |
| Biotech |
$BTK |
1,253.57 |
+20.81 |
+1.69% |
+33.06% |
|
|
|
 |
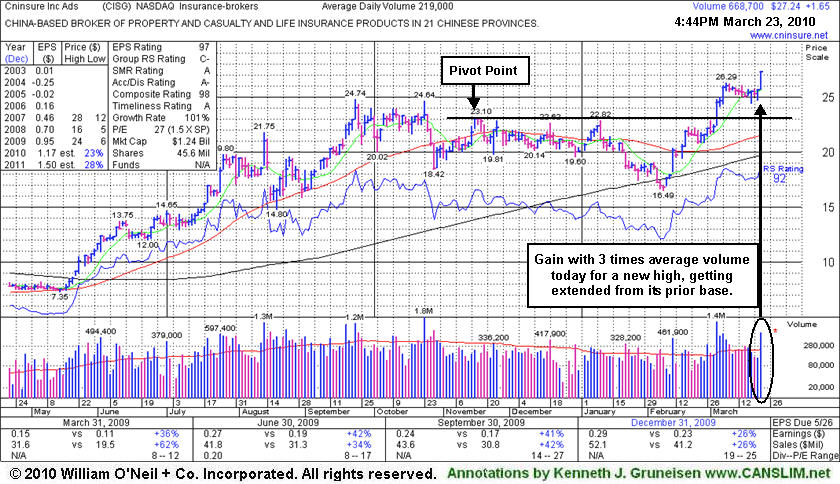
More Extended After Gain Today With Three Times Average Volume
Kenneth J. Gruneisen - Passed the CAN SLIM® Master's Exam
Cninsure Inc (CISG +$1.65 or +6.45% to $27.24) posted a considerable gain today with three times average volume for a new 52-week high. It is getting more extended from its previous sound base, now rising after a brief 2-week consolidation. Its weekly chart resembles a "3-weeks tight" pattern, yet that type of advanced chart pattern normally is considered valid only after a stock has distanced itself more substantially from its prior chart highs. For now, prior chart highs in the $24 area are now an important support level to watch. No overhead supply remains to act as resistance, however, and it could easily get more extended. Patience did not yet allow any opportunity to accumulate shares under its "max buy" level since its last appearance in this Featured Stock Update section on 3/03/10 with an annotated graph under the headline, "Volume Eight Times Average Behind Breakout Gain." Disciplined investors will wait for another ideal entry point without chasing it beyond the investment system guidelines.
It rose from a 20-week double bottom base with 8 times average volume as it was featured in the 3/03/10 mid-day report (read here) color coded yellow with pivot point cited based on its 11/18/09 high. This China-based insurance broker has shown strong earnings and sales growth above the +25% guideline but generally decelerating over the course of recent years. The lack of leadership in the Insurance-Brokers industry group also remains a concern with respect to the investment system's L criteria.
|
|
|
Color Codes Explained :
Y - Better candidates highlighted by our
staff of experts.
G - Previously featured
in past reports as yellow but may no longer be buyable under the
guidelines.
***Last / Change / Volume quote data in this table corresponds with the timestamp on the note***
Symbol/Exchange
Company Name
Industry Group |
Last |
Chg. |
Vol
% DAV |
Date Featured |
Price Featured |
Latest Pivot Point
Featured |
Status |
| Latest Max Buy Price |
ARUN
- NASDAQ
Aruba Networks Inc
COMPUTER HARDWARE - Networking & Communication Dev
|
$12.93
|
+0.41
|
1,389,126
92% DAV
1,504,400
|
2/19/2010
(Date
Featured) |
$12.71
(Price
Featured) |
PP = $11.94 |
G |
| MB = $12.54 |
Most Recent Note - 3/23/2010 5:07:46 PM
G - Today's gain ended a streak of 4 consecutive losses while consolidating after recent gains on heavy volume. Consolidating above support defined by prior chart highs and its 50 DMA line.
>>> The latest Featured Stock Update with an annotated graph appeared on 3/11/2010. click here.
|
|
C
A
S
I |
News |
Chart |
SEC
View all notes Alert
me of new notes
Company
Profile
|
BIDU
- NASDAQ
Baidu Inc Ads
INTERNET - Internet Information Providers
|
$594.88
|
+15.16
|
3,655,090
173% DAV
2,113,400
|
1/13/2010
(Date
Featured) |
$431.25
(Price
Featured) |
PP = $426.75 |
G |
| MB = $448.09 |
Most Recent Note - 3/23/2010 5:08:56 PM
G - Gapped up today, rallying with above average volume for a considerable gain and another new high close. Held its ground following its 3/15/10 considerable gap up gain with heavy volume. It is extended from any sound base now.
>>> The latest Featured Stock Update with an annotated graph appeared on 3/4/2010. click here.
|
|
C
A
S
I |
News |
Chart |
SEC
View all notes Alert
me of new notes
Company
Profile
|
BRLI
- NASDAQ
Bio Reference Labs Inc
HEALTH SERVICES - Medical Laboratories & Researc
|
$44.17
|
-0.20
|
59,121
62% DAV
95,500
|
2/12/2010
(Date
Featured) |
$39.02
(Price
Featured) |
PP = $40.97 |
G |
| MB = $43.02 |
Most Recent Note - 3/23/2010 5:11:06 PM
G - Small loss today with light volume. Consolidating very near its 52-week high since its negative reversal on 3/12/10. It is slightly extended from its prior base, and prior chart highs and its 50 DMA line now coincide in the $40 area defining important support to watch.
>>> The latest Featured Stock Update with an annotated graph appeared on 3/22/2010. click here.
|
|
C
A
S
I |
News |
Chart |
SEC
View all notes Alert
me of new notes
Company
Profile
|
CISG
- NASDAQ
Cninsure Inc Ads
INSURANCE - Insurance Brokers
|
$27.24
|
+1.65
|
669,232
306% DAV
219,000
|
3/3/2010
(Date
Featured) |
$24.38
(Price
Featured) |
PP = $23.10 |
G |
| MB = $24.26 |
Most Recent Note - 3/23/2010 5:12:22 PM
G - Considerable gain today with 3 times average volume for a new 52-week high, getting more extended from a sound base. No overhead supply remains to act as resistance. It rose from a 20-week double bottom base with 8 times average volume as it was featured in the 3/03/10 mid-day report (read here).
>>> The latest Featured Stock Update with an annotated graph appeared on 3/23/2010. click here.
|
|
C
A
S
I |
News |
Chart |
SEC
View all notes Alert
me of new notes
Company
Profile
|
CRM
- NYSE
Salesforce.com Inc
INTERNET - Internet Software & Services
|
$77.10
|
-0.41
|
1,233,448
61% DAV
2,020,900
|
3/5/2010
(Date
Featured) |
$72.28
(Price
Featured) |
PP = $75.53 |
Y |
| MB = $79.31 |
Most Recent Note - 3/23/2010 5:22:26 PM
Y - Small loss today on light volume. It recently wedged higher, rising from a 9-week base without the required volume to trigger a proper technical buy signal. Its 50 DMA line and recent chart low ($64.77 on 2/25/10) define important support.
>>> The latest Featured Stock Update with an annotated graph appeared on 3/5/2010. click here.
|
|
C
A
S
I |
News |
Chart |
SEC
View all notes Alert
me of new notes
Company
Profile
|
CTRP
- NASDAQ
Ctrip.com Intl Ltd Adr
LEISURE - Resorts & Casinos
|
$37.64
|
+0.87
|
1,332,461
61% DAV
2,178,200
|
3/1/2010
(Date
Featured) |
$38.23
(Price
Featured) |
PP = $38.50 |
G |
| MB = $40.43 |
Most Recent Note - 3/23/2010 5:29:42 PM
G - Small gain on lighter volume today after a positive reversal on 3/22/10 for a gain with above average volume, rebounding after early losses tested its 50 DMA line. Color code was changed to green based on recent weakness. A gain above its pivot point or its most recent chart highs with +50% above average volume or more is still needed to confirm a fresh technical buy signal. Completed an offering of additional shares on 3/03/10, shortly after featured in the March 2010 issue of CANSLIM.net News (read here).
>>> The latest Featured Stock Update with an annotated graph appeared on 3/18/2010. click here.
|
|
C
A
S
I |
News |
Chart |
SEC
View all notes Alert
me of new notes
Company
Profile
|
EZPW
- NASDAQ
Ezcorp Inc Cl A
SPECIALTY RETAIL - Specialty Retail, Other
|
$20.67
|
-0.10
|
410,081
76% DAV
538,900
|
2/19/2010
(Date
Featured) |
$19.03
(Price
Featured) |
PP = $18.80 |
G |
| MB = $19.74 |
Most Recent Note - 3/23/2010 5:31:18 PM
G - Small loss today with below average volume, consolidating well above its 50 DMA line - important support to watch. Its positive reversal on 3/16/10 was a reassuring sign of support after its 3/15/10 a loss with volume nearly 4 times average volume indicated distributional pressure.
>>> The latest Featured Stock Update with an annotated graph appeared on 3/8/2010. click here.
|
|
C
A
S
I |
News |
Chart |
SEC
View all notes Alert
me of new notes
Company
Profile
|
GMCR
- NASDAQ
Green Mtn Coffee Roastrs
FOOD & BEVERAGE - Processed & Packaged Goods
|
$95.47
|
-0.32
|
560,742
43% DAV
1,294,400
|
2/26/2010
(Date
Featured) |
$84.39
(Price
Featured) |
PP = $88.75 |
G |
| MB = $93.19 |
Most Recent Note - 3/23/2010 5:32:22 PM
G - Small loss today on below average volume, still consolidating near all-time highs. Its high volume gain on 3/08/10 triggered a new technical buy signal. It is slightly extended from its latest sound base, and initial support to watch is prior chart highs in the $86-88 area.
>>> The latest Featured Stock Update with an annotated graph appeared on 3/12/2010. click here.
|
|
C
A
S
I |
News |
Chart |
SEC
View all notes Alert
me of new notes
Company
Profile
|
ISRG
- NASDAQ
Intuitive Surgical Inc
HEALTH SERVICES - Medical Appliances & Equipment
|
$348.97
|
+1.17
|
443,604
85% DAV
524,500
|
1/22/2010
(Date
Featured) |
$340.40
(Price
Featured) |
PP = $314.00 |
G |
| MB = $329.70 |
Most Recent Note - 3/23/2010 5:33:30 PM
G - Held its ground and posted a small gain on light volume today. On the prior session it briefly undercut prior chart highs near $346 and nearly tested its 50 DMA line - important support levels to watch. As recently noted, it did not trigger a technical buy signal in recent weeks.
>>> The latest Featured Stock Update with an annotated graph appeared on 3/16/2010. click here.
|
|
C
A
S
I |
News |
Chart |
SEC
View all notes Alert
me of new notes
Company
Profile
|
PCLN
- NASDAQ
Priceline.com Inc
INTERNET - Internet Software & Services
|
$399.55
|
-4.72
|
584,812
N/A
|
11/1/2002
(Date
Featured) |
$399.55
(Price
Featured) |
PP = $428.20 |
Y |
| MB = $449.61 |
Most Recent Note - 1/2/2011
Y - Returns to Featured Stocks list with its appearance in the January 2011 CANSLIM.net News including detailed analysis and annotated daily and weekly graphs.
>>> The latest Featured Stock Update with an annotated graph appeared on 3/10/2010. click here.
|
|
C
A
S
I |
News |
Chart |
SEC
View all notes Alert
me of new notes
Company
Profile
|
PEGA
- NASDAQ
Pegasystems Inc
COMPUTER SOFTWARE & SERVICES - Business Software & Services
|
$39.11
|
+0.14
|
130,450
59% DAV
220,600
|
2/26/2010
(Date
Featured) |
$36.00
(Price
Featured) |
PP = $38.55 |
Y |
| MB = $40.48 |
Most Recent Note - 3/23/2010 5:39:06 PM
Y - Small gain today on below average volume, ending 19 cents off its best close ever. Consolidating in a tight range near all-time highs since a considerable gap up gain on 3/15/10 triggered a technical buy signal. Recently found support at its 50 DMA line, while prior chart lows in the $32 area are the next support level.
>>> The latest Featured Stock Update with an annotated graph appeared on 3/15/2010. click here.
|
|
C
A
S
I |
News |
Chart |
SEC
View all notes Alert
me of new notes
Company
Profile
|
ROVI
- NASDAQ
Rovi Corp
COMPUTER SOFTWARE & SERVICES - Security Software & Services
|
$38.33
|
+0.81
|
942,204
69% DAV
1,363,200
|
2/25/2010
(Date
Featured) |
$33.54
(Price
Featured) |
PP = $34.87 |
G |
| MB = $36.61 |
Most Recent Note - 3/23/2010 5:41:15 PM
G - Small gain today on below average volume for its best close ever, finishing only 17 cents from its all-time high. It remains extended from its latest base, while prior chart highs in the $34 area define an important support level to watch on pullbacks.
>>> The latest Featured Stock Update with an annotated graph appeared on 3/17/2010. click here.
|
|
C
A
S
I |
News |
Chart |
SEC
View all notes Alert
me of new notes
Company
Profile
|
SIRO
- NASDAQ
Sirona Dental Systems
HEALTH SERVICES - Medical Instruments & Supplies
|
$37.63
|
+0.13
|
343,156
59% DAV
582,000
|
2/16/2010
(Date
Featured) |
$36.43
(Price
Featured) |
PP = $36.15 |
Y |
| MB = $37.96 |
Most Recent Note - 3/23/2010 5:42:24 PM
Y - Small gain today on below average volume. Trading in a very tight range for the past few weeks, perched very near its max buy level. Prior chart highs and its 50 DMA line in the $35-36 area define important support to watch.
>>> The latest Featured Stock Update with an annotated graph appeared on 3/9/2010. click here.
|
|
C
A
S
I |
News |
Chart |
SEC
View all notes Alert
me of new notes
Company
Profile
|
ULTA
- NASDAQ
Ulta Salon Cosm & Frag
SPECIALTY RETAIL - Specialty Retail, Other
|
$22.21
|
+0.14
|
290,161
78% DAV
371,800
|
3/12/2010
(Date
Featured) |
$22.81
(Price
Featured) |
PP = $21.72 |
Y |
| MB = $22.81 |
Most Recent Note - 3/23/2010 5:44:22 PM
Y - Small gain today on lighter than average volume. Consolidating just above its pivot point yet below its "max buy" level. It found prompt support following a loss on 3/15/10 after an analyst downgrade. Prior chart highs in the $21 area now define a very important technical support level. A detailed Stock Bulletin with annotated graph was published soon after it was featured in the 3/12/10 mid-day report.
>>> The latest Featured Stock Update with an annotated graph appeared on 3/12/2010. click here.
|
|
C
A
S
I |
News |
Chart |
SEC
View all notes Alert
me of new notes
Company
Profile
|
VPRT
- NASDAQ
Vistaprint Nv
DIVERSIFIED SERVICES - Business/Management Services
|
$61.92
|
+0.31
|
160,744
35% DAV
462,000
|
3/1/2010
(Date
Featured) |
$57.72
(Price
Featured) |
PP = $59.70 |
Y |
| MB = $62.69 |
Most Recent Note - 3/23/2010 5:45:51 PM
Y - Gain today on very light volume, closing only -1.4% from its 3/09/10 all-time high. It did not trigger a technical buy signal since it was featured in the March 2010 CANSLIM.net News monthly newsletter (read here). As previously noted, "Its gain on 3/02/10 was below the volume guidelines for buyable breakouts under the investment system."
>>> The latest Featured Stock Update with an annotated graph appeared on 3/19/2010. click here.
|
|
C
A
S
I |
News |
Chart |
SEC
View all notes Alert
me of new notes
Company
Profile
|
|
|
|
THESE ARE NOT BUY RECOMMENDATIONS!
Comments contained in the body of this report are technical
opinions only. The material herein has been obtained
from sources believed to be reliable and accurate, however,
its accuracy and completeness cannot be guaranteed.
This site is not an investment advisor, hence it does
not endorse or recommend any securities or other investments.
Any recommendation contained in this report may not
be suitable for all investors and it is not to be deemed
an offer or solicitation on our part with respect to
the purchase or sale of any securities. All trademarks,
service marks and trade names appearing in this report
are the property of their respective owners, and are
likewise used for identification purposes only.
This report is a service available
only to active Paid Premium Members.
You may opt-out of receiving report notifications
at any time. Questions or comments may be submitted
by writing to Premium Membership Services 665 S.E. 10 Street, Suite 201 Deerfield Beach, FL 33441-5634 or by calling 1-800-965-8307
or 954-785-1121.
|
|
|


