You are not logged in.
This means you
CAN ONLY VIEW reports that were published prior to Monday, April 14, 2025.
You
MUST UPGRADE YOUR MEMBERSHIP if you want to see any current reports.
AFTER MARKET UPDATE - THURSDAY, MARCH 20TH, 2014
Previous After Market Report Next After Market Report >>>
|
|
|
|
DOW |
+108.88 |
16,331.05 |
+0.67% |
|
Volume |
620,532,570 |
-5% |
|
Volume |
1,720,214,180 |
-8% |
|
NASDAQ |
+11.69 |
4,319.29 |
+0.27% |
|
Advancers |
1,481 |
47% |
|
Advancers |
1,430 |
52% |
|
S&P 500 |
+11.24 |
1,872.01 |
+0.60% |
|
Decliners |
1,556 |
50% |
|
Decliners |
1,248 |
45% |
|
Russell 2000 |
+3.31 |
1,198.97 |
+0.28% |
|
52 Wk Highs |
96 |
|
|
52 Wk Highs |
133 |
|
|
S&P 600 |
+2.26 |
680.08 |
+0.33% |
|
52 Wk Lows |
30 |
|
|
52 Wk Lows |
19 |
|
|
 |
Major Averages Rose With Lighter Volume Totals
Kenneth J. Gruneisen - Passed the CAN SLIM® Master's Exam
On Thursday the major averages ended higher. Volume totals were reported lighter on the NYSE and on the Nasdaq exchange, a sign of timid buying coming from the institutional crowd. Advancers and decliners were evenly mixed on the NYSE and on the Nasdaq exchange. There were 41 high-ranked companies from the CANSLIM.net Leaders List that made new 52-week highs and appeared on the CANSLIM.net BreakOuts Page, down a notch from the total of 42 stocks on the prior session. The list of stocks hitting new 52-week highs easily outnumbered new 52-week lows on the Nasdaq exchange and on the NYSE. There were gains for 5 of the 11 high-ranked companies currently included on the Featured Stocks Page. The Market (M criteria) uptrend faced some recent pressure and yet the rally has continued. For any rally to be sustained it is critical for there to be healthy leadership, so it remains crucial for many stocks to continue hitting new 52-week highs.
The Dow Jones Industrial Average was up 108 points to 16,331, the S&P 500 added 11 points to 1,872 and the NASDAQ advanced 11 points with the index closing at 4,319. Despite early weakness, stocks managed to hold their gains into the closing bell. A batch of positive economic reports helped investors shake off concerns that the Federal Reserve may look to raise interest rates as early as next year.
Most sectors on the S&P ended higher, led by gains in financial stocks including Bank of America (BAC +2.7%). On the earnings front, ConAgra Foods (CAG +1.3%) edged higher after the company posted quarterly results ahead of analysts' expectations. In other news, shares of Microsoft (MSFT +2.7%) rose on reports that offering its software for use on Apple products could increase sales by over $1 billion per year.
Turning to fixed income markets, Treasuries ended modestly lower along the curve. The benchmark 10-year note was down 1/32 to yield 2.77% and the 30-year bond fell 3/32 to yield 3.66%.
The CANSLIM.net Featured Stocks Page shows the most action-worthy candidates and their latest notes and a Headline Link directs members to the latest detailed analysis with data-packed graphs annotated by a Certified expert along with links to additional resources. The Premium Member Homepage includes "dynamic archives" to all prior pay reports published. Watch for an announcement via email concerning the next WEBCAST.
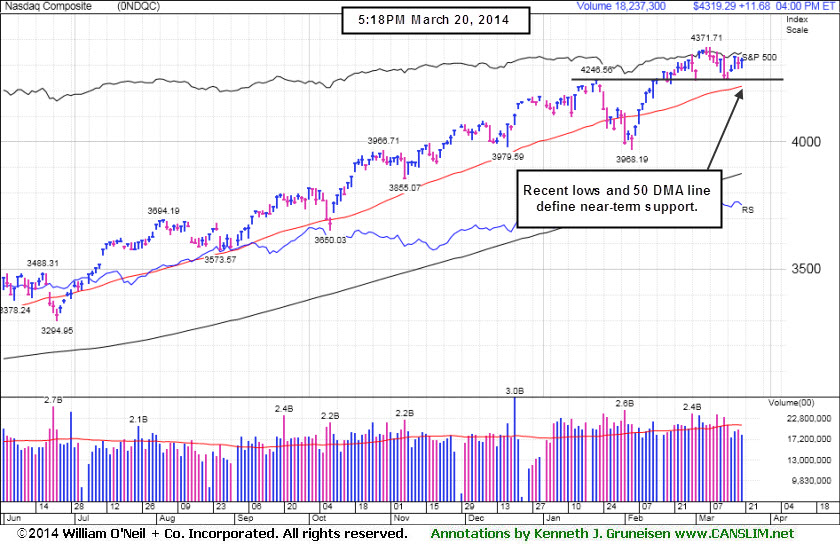
PICTURED: The Nasdaq Composite Index has seen volume totals cooling while consolidating above its 50-day moving average (DMA) line after recently encountering distributional pressure. Recent lows also help define near-term support to watch.
|
 Kenneth J. Gruneisen started out as a licensed stockbroker in August 1987, a couple of months prior to the historic stock market crash that took the Dow Jones Industrial Average down -22.6% in a single day. He has published daily fact-based fundamental and technical analysis on high-ranked stocks online for two decades. Through FACTBASEDINVESTING.COM, Kenneth provides educational articles, news, market commentary, and other information regarding proven investment systems that work in good times and bad.
Comments contained in the body of this report are technical opinions only and are not necessarily those of Gruneisen Growth Corp. The material herein has been obtained from sources believed to be reliable and accurate, however, its accuracy and completeness cannot be guaranteed. Our firm, employees, and customers may effect transactions, including transactions contrary to any recommendation herein, or have positions in the securities mentioned herein or options with respect thereto. Any recommendation contained in this report may not be suitable for all investors and it is not to be deemed an offer or solicitation on our part with respect to the purchase or sale of any securities. |
|
 |
Financial and Tech Indices Led Group Gainers
Kenneth J. Gruneisen - Passed the CAN SLIM® Master's Exam
The Broker/Dealer Index ($XBD +1.80%) and the Bank Index ($BKX +2.23%) both posted solid gains which underpinned the major averages' rally on Thursday. The Semiconductor Index ($SOX +1.90%) and the Networking Index ($NWX +1.03%) ratcheted higher while the Biotechnology Index ($BTK -0.38%) ended with a small loss and the Retail Index ($RLX -0.07%) finished flat. Commodity-linked groups had a slightly positive bias as the Oil Services Index ($OSX +0.63%), Integrated Oil Index ($XOI +0.18%), and the Gold & Silver Index ($XAU +0.27%) posted small gains.
Charts courtesy www.stockcharts.com
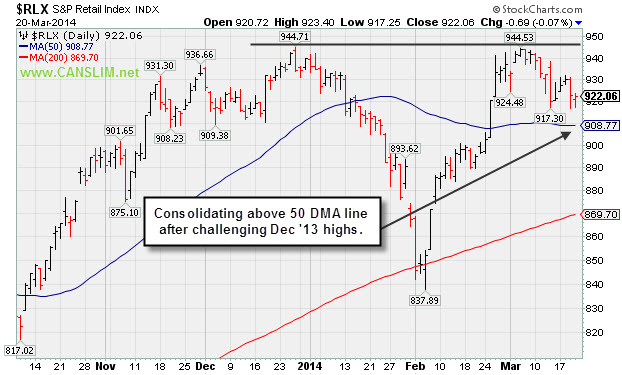
PICTURED: The Retail Index ($RLX -0.07%) is consolidating above its 50-day moving average (DMA) line after recently challenging its Dec '13 highs.
| Oil Services |
$OSX |
281.52 |
+1.76 |
+0.63% |
+0.17% |
| Integrated Oil |
$XOI |
1,477.56 |
+2.69 |
+0.18% |
-1.70% |
| Semiconductor |
$SOX |
587.63 |
+10.94 |
+1.90% |
+9.83% |
| Networking |
$NWX |
345.56 |
+3.53 |
+1.03% |
+6.67% |
| Broker/Dealer |
$XBD |
164.66 |
+2.91 |
+1.80% |
+2.56% |
| Retail |
$RLX |
922.06 |
-0.69 |
-0.07% |
-1.89% |
| Gold & Silver |
$XAU |
98.55 |
+0.27 |
+0.27% |
+17.11% |
| Bank |
$BKX |
72.91 |
+1.59 |
+2.23% |
+5.27% |
| Biotech |
$BTK |
2,795.99 |
-10.62 |
-0.38% |
+19.98% |
|
|
|
 |
Traded Up +64.6% in Under 3 Months Since Featured in Mid-Day Report
Kenneth J. Gruneisen - Passed the CAN SLIM® Master's Exam
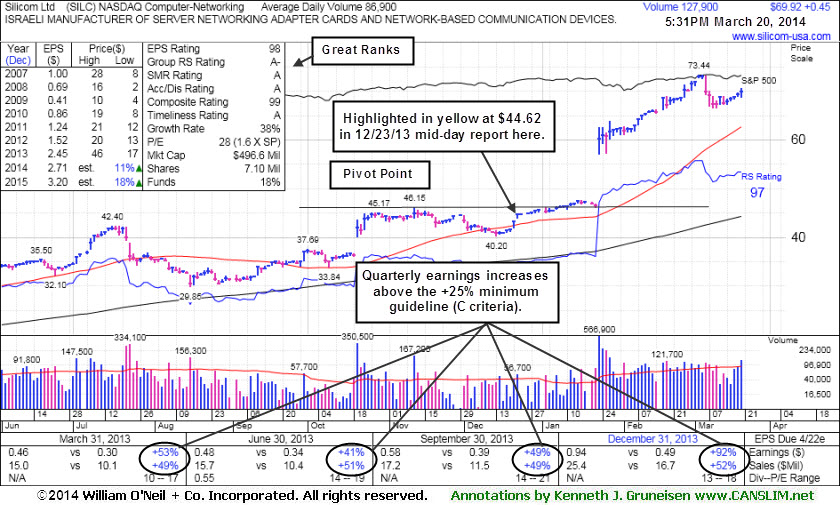
Silicom Ltd (SILC +$0.45 or +0.65% to $69.92) posted a 5th consecutive small gain today with increasing volume. Now in its 3rd week of consolidation, it recently has been noted - "Extended from any sound base. Patient investors may watch for a new base or secondary buy point to possibly develop and be noted in the weeks ahead." It has stubbornly held its ground since its last appearance in this FSU section on 3/06/14 with annotated graphs under the headline, "Very Extended From Prior Base After 11 Straight Weekly Gains". It traded up as much as +64.6% in the two and a half months since first featured in yellow at $44.62 in the 12/23/13 mid-day report (read here).
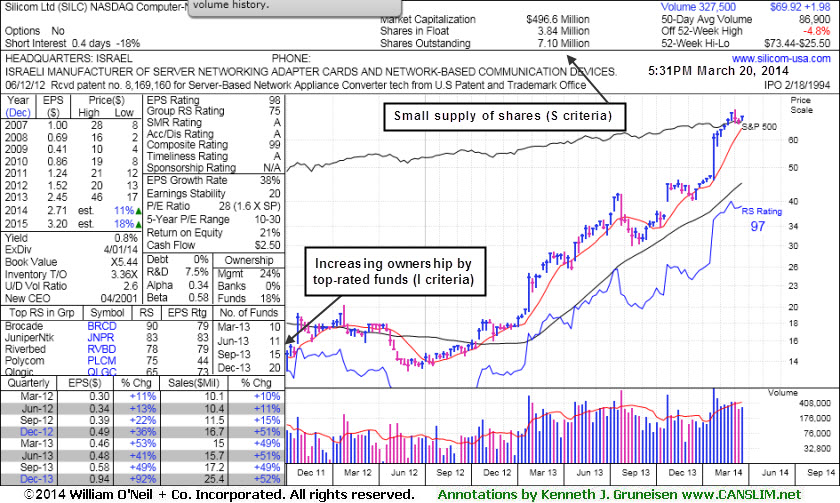
There was a considerable "breakaway gap" up on 1/23/14 after reporting earnings +92% on +52% sales for the Dec '13 quarter, beating consensus estimates and continuing its streak of strong quarterly earnings increases satisfying the C criteria. After a downturn in FY '08 and '09 earnings its annual earnings (A criteria) history has shown strong and steady growth. Its small supply (S criteria) of only 3.84 million shares in the public float can contribute to greater price volatility in the event of institutional buying or selling. The number of top-rated funds owning its shares rose from 7 in Dec '12 to 20 in Dec '13, a reassuring sign concerning the I criteria. Its current Up/Down Volume Ratio of 2.6 is also an unbiased indication its shares have been under accumulation over the past 50 days.
|
|
|
Color Codes Explained :
Y - Better candidates highlighted by our
staff of experts.
G - Previously featured
in past reports as yellow but may no longer be buyable under the
guidelines.
***Last / Change / Volume data in this table is the closing quote data***
Symbol/Exchange
Company Name
Industry Group |
PRICE |
CHANGE
(%Change) |
Day High |
Volume
(% DAV)
(% 50 day avg vol) |
52 Wk Hi
% From Hi |
Featured
Date |
Price
Featured |
Pivot Featured |
|
Max Buy |
EQM
-
NYSE
E Q T Midstream Partners
ENERGY - Oil and Gas Pipelines
|
$66.10
|
-0.08
-0.12% |
$66.35
|
99,746
97.79% of 50 DAV
50 DAV is 102,000
|
$67.80
-2.51%
|
12/12/2013
|
$53.17
|
PP = $56.51
|
|
MB = $59.34
|
Most Recent Note - 3/17/2014 6:45:35 PM
G - Posted a gain today, finding support above its 50 DMA line. Still stubbornly holding its ground since reporting earnings -2% on +22% sales revenues for the Dec '13 quarter, below the +25% minimum earnings guideline (C criteria), raising fundamental concerns. Its 50 DMA line ($63.49 now) defines near-term support where a violation may trigger a technical sell signal.
>>> FEATURED STOCK ARTICLE : Resilient Despite Fundamental Concerns - 3/3/2014
View all notes |
Set NEW NOTE alert |
CANSLIM.net Company Profile |
SEC
News |
Chart |
Request a new note
C
A N
S L
I M


|
FB
-
NASDAQ
Facebook Inc Cl A
INTERNET
|
$66.97
|
-1.27
-1.86% |
$68.23
|
44,306,852
75.49% of 50 DAV
50 DAV is 58,696,000
|
$72.59
-7.74%
|
12/12/2013
|
$51.40
|
PP = $54.93
|
|
MB = $57.68
|
Most Recent Note - 3/14/2014 5:36:57 PM
G - Pulling back after getting extended from any sound base. Its 50 DMA line ($63 now) defines near-term support to watch. See the latest FSU analysis for more details and new annotated graphs.
>>> FEATURED STOCK ARTICLE : Pulling Back After Getting Extended From Prior Base - 3/14/2014
View all notes |
Set NEW NOTE alert |
CANSLIM.net Company Profile |
SEC
News |
Chart |
Request a new note
C
A N
S L
I M
|
FLT
-
NYSE
Fleetcor Technologies
DIVERSIFIED SERVICES - Business/Management Services
|
$119.79
|
+1.47
1.24% |
$120.01
|
441,472
38.27% of 50 DAV
50 DAV is 1,153,600
|
$132.22
-9.40%
|
3/5/2014
|
$125.40
|
PP = $124.06
|
|
MB = $130.26
|
Most Recent Note - 3/17/2014 6:50:43 PM
Y - Recent slump below its old high close ($122.70 on 12/02/13) raised concerns as it completely negated the recent breakout. Still consolidating above its 50 DMA line, but its Relative Strength rating has slumped to 78, below the 80+ minimum guideline for buy candidates.
>>> FEATURED STOCK ARTICLE : Consolidating Following Recent Breakout to New High Territory - 3/5/2014
View all notes |
Set NEW NOTE alert |
CANSLIM.net Company Profile |
SEC
News |
Chart |
Request a new note
C
A N
S L
I M
|
GNRC
-
NYSE
Generac Hldgs Inc
Electrical-Power/Equipmt
|
$60.71
|
+0.14
0.23% |
$60.98
|
252,346
25.88% of 50 DAV
50 DAV is 975,000
|
$62.50
-2.86%
|
2/14/2014
|
$56.50
|
PP = $57.39
|
|
MB = $60.26
|
Most Recent Note - 3/14/2014 5:43:54 PM
G - Color code is changed to green after finishing near the session high and above its "max buy" level with a solid gain today backed by +31% above average volume.
>>> FEATURED STOCK ARTICLE : Bullish Gap Up Followed By Wedging and Stalling Action - 3/11/2014
View all notes |
Set NEW NOTE alert |
CANSLIM.net Company Profile |
SEC
News |
Chart |
Request a new note
C
A N
S L
I M
|
ICON
-
NASDAQ
Iconix Brand Group Inc
CONSUMER NON-DURABLES - Textile - Apparel Footwear
|
$40.18
|
-0.24
-0.59% |
$40.48
|
365,143
57.14% of 50 DAV
50 DAV is 639,000
|
$42.47
-5.38%
|
3/7/2014
|
$41.46
|
PP = $40.88
|
|
MB = $42.92
|
Most Recent Note - 3/17/2014 12:10:11 PM
Y - Halting its 4-session losing streak with a gain today. Prior highs in the $40 area define near-term support. Highlighted in yellow with pivot point cited based on its 12/02/13 high plus 10 cents in the 3/07/14 mid-day report (read here) and covered in greater detail with annotated graphs in that evening's report.
>>> FEATURED STOCK ARTICLE : Encountered Distributional Pressure Following Recent Breakout - 3/7/2014
View all notes |
Set NEW NOTE alert |
CANSLIM.net Company Profile |
SEC
News |
Chart |
Request a new note
C
A N
S L
I M
|
Symbol/Exchange
Company Name
Industry Group |
PRICE |
CHANGE
(%Change) |
Day High |
Volume
(% DAV)
(% 50 day avg vol) |
52 Wk Hi
% From Hi |
Featured
Date |
Price
Featured |
Pivot Featured |
|
Max Buy |
KORS
-
NYSE
Michael Kors Hldgs Ltd
RETAIL - Apparel Stores
|
$97.67
|
-1.04
-1.05% |
$98.44
|
1,932,592
53.70% of 50 DAV
50 DAV is 3,599,000
|
$101.04
-3.34%
|
3/12/2014
|
$98.03
|
PP = $101.14
|
|
MB = $106.20
|
Most Recent Note - 3/19/2014 6:07:36 PM
Y - Still stubbornly holding its ground in a very tight range near its 52-week high. Its 50 DMA line ($90) defines the nearest support above prior highs in the $84 area.
>>> FEATURED STOCK ARTICLE : Formed Advanced Base Pattern With Volume Totals Cooling - 3/12/2014
View all notes |
Set NEW NOTE alert |
CANSLIM.net Company Profile |
SEC
News |
Chart |
Request a new note
C
A N
S L
I M
|
PCLN
-
NASDAQ
Priceline.com Inc
INTERNET - Internet Software and Services
|
$1,292.39
|
+5.16
0.40% |
$1,300.00
|
635,272
79.81% of 50 DAV
50 DAV is 796,000
|
$1,378.96
-6.28%
|
12/18/2013
|
$1,156.20
|
PP = $1,198.85
|
|
MB = $1,258.79
|
Most Recent Note - 3/17/2014 12:14:38 PM
G - Halting its slide today after 2 consecutive big losses and closes near the session lows. Near-term support to watch is its 50 DMA line ($1,235).
>>> FEATURED STOCK ARTICLE : Perched At Highs With Volume Totals Cooling - 3/10/2014
View all notes |
Set NEW NOTE alert |
CANSLIM.net Company Profile |
SEC
News |
Chart |
Request a new note
C
A N
S L
I M
|
PSIX
-
NASDAQ
Power Solutions Intl Inc
Machinery-Gen Industrial
|
$83.64
|
+2.54
3.13% |
$84.40
|
38,863
60.72% of 50 DAV
50 DAV is 64,000
|
$87.40
-4.30%
|
2/28/2014
|
$74.65
|
PP = $76.93
|
|
MB = $80.78
|
 Most Recent Note - 3/20/2014 5:59:00 PM
G - Rallied back above its "max buy" level again and its color code is changed to green. Prior highs in the $78 area acted as support.
>>> FEATURED STOCK ARTICLE : Halted Slide After Undercutting Prior Highs on Pullback - 3/18/2014
View all notes |
Set NEW NOTE alert |
CANSLIM.net Company Profile |
SEC
News |
Chart |
Request a new note
C
A N
S L
I M
|
SILC
-
NASDAQ
Silicom Ltd
COMPUTER HARDWARE - Networking andamp; Communication Dev
|
$69.92
|
+0.45
0.65% |
$70.60
|
127,952
148.78% of 50 DAV
50 DAV is 86,000
|
$73.44
-4.79%
|
12/23/2013
|
$44.62
|
PP = $46.25
|
|
MB = $48.56
|
Most Recent Note - 3/20/2014 5:57:12 PM
G - Posted a 5th consecutive small gain today with increasing volume. See the latest FSU analysis for more details and new annotated graphs. Previously noted - "Extended from any sound base. Patient investors may watch for a new base or secondary buy point to possibly develop and be noted in the weeks ahead."
>>> FEATURED STOCK ARTICLE : Traded Up +64.6% in Under 3 Months Since Featured in Mid-Day Report - 3/20/2014
View all notes |
Set NEW NOTE alert |
CANSLIM.net Company Profile |
SEC
News |
Chart |
Request a new note
C
A N
S L
I M
|
ULTI
-
NASDAQ
Ultimate Software Group
INTERNET - Internet Software and Services
|
$154.55
|
-1.14
-0.73% |
$157.91
|
107,583
50.46% of 50 DAV
50 DAV is 213,200
|
$171.96
-10.12%
|
1/27/2014
|
$153.75
|
PP = $162.98
|
|
MB = $171.13
|
Most Recent Note - 3/19/2014 6:05:37 PM
G - Remains below its 50 DMA line after damaging losses. A rebound above that important short-term average would help its outlook improve. Its Relative Strength rating has slumped to 76, below the 80+ minimum guideline. See the latest FSU analysis for more details and new annotated graphs.
>>> FEATURED STOCK ARTICLE : Following Violation 50-Day Moving Average Acted as Resistance - 3/19/2014
View all notes |
Set NEW NOTE alert |
CANSLIM.net Company Profile |
SEC
News |
Chart |
Request a new note
C
A N
S L
I M
|
Symbol/Exchange
Company Name
Industry Group |
PRICE |
CHANGE
(%Change) |
Day High |
Volume
(% DAV)
(% 50 day avg vol) |
52 Wk Hi
% From Hi |
Featured
Date |
Price
Featured |
Pivot Featured |
|
Max Buy |
VRX
-
NYSE
Valeant Pharmaceuticals
DRUGS - Drug Manufacturers - Other
|
$140.40
|
-0.39
-0.28% |
$141.97
|
991,331
57.27% of 50 DAV
50 DAV is 1,731,000
|
$153.10
-8.30%
|
9/11/2013
|
$100.26
|
PP = $105.50
|
|
MB = $110.78
|
Most Recent Note - 3/17/2014 6:44:14 PM
G - Consolidating just above its 50 DMA line ($137.66) which defines near-term support. A more damaging violation may raise serious concerns and trigger a more worrisome technical sell signal. See the latest FSU analysis for more details and new annotated graphs.
>>> FEATURED STOCK ARTICLE : Finding Support Above 50-Day Moving Average Line - 3/17/2014
View all notes |
Set NEW NOTE alert |
CANSLIM.net Company Profile |
SEC
News |
Chart |
Request a new note
C
A N
S L
I M
|
|
|
|
THESE ARE NOT BUY RECOMMENDATIONS!
Comments contained in the body of this report are technical
opinions only. The material herein has been obtained
from sources believed to be reliable and accurate, however,
its accuracy and completeness cannot be guaranteed.
This site is not an investment advisor, hence it does
not endorse or recommend any securities or other investments.
Any recommendation contained in this report may not
be suitable for all investors and it is not to be deemed
an offer or solicitation on our part with respect to
the purchase or sale of any securities. All trademarks,
service marks and trade names appearing in this report
are the property of their respective owners, and are
likewise used for identification purposes only.
This report is a service available
only to active Paid Premium Members.
You may opt-out of receiving report notifications
at any time. Questions or comments may be submitted
by writing to Premium Membership Services 665 S.E. 10 Street, Suite 201 Deerfield Beach, FL 33441-5634 or by calling 1-800-965-8307
or 954-785-1121.
|
|
|

