You are not logged in.
This means you
CAN ONLY VIEW reports that were published prior to Monday, April 14, 2025.
You
MUST UPGRADE YOUR MEMBERSHIP if you want to see any current reports.
AFTER MARKET UPDATE - TUESDAY, MARCH 18TH, 2014
Previous After Market Report Next After Market Report >>>
|
|
|
|
DOW |
+88.97 |
16,336.19 |
+0.55% |
|
Volume |
573,754,380 |
-3% |
|
Volume |
1,821,428,650 |
+7% |
|
NASDAQ |
+53.36 |
4,333.31 |
+1.25% |
|
Advancers |
2,368 |
75% |
|
Advancers |
2,056 |
74% |
|
S&P 500 |
+13.42 |
1,872.25 |
+0.72% |
|
Decliners |
706 |
22% |
|
Decliners |
629 |
23% |
|
Russell 2000 |
+16.81 |
1,205.04 |
+1.41% |
|
52 Wk Highs |
137 |
|
|
52 Wk Highs |
119 |
|
|
S&P 600 |
+8.87 |
682.91 |
+1.32% |
|
52 Wk Lows |
11 |
|
|
52 Wk Lows |
16 |
|
|
 |
Breadth Positive as Major Averages Rose
Kenneth J. Gruneisen - Passed the CAN SLIM® Master's Exam
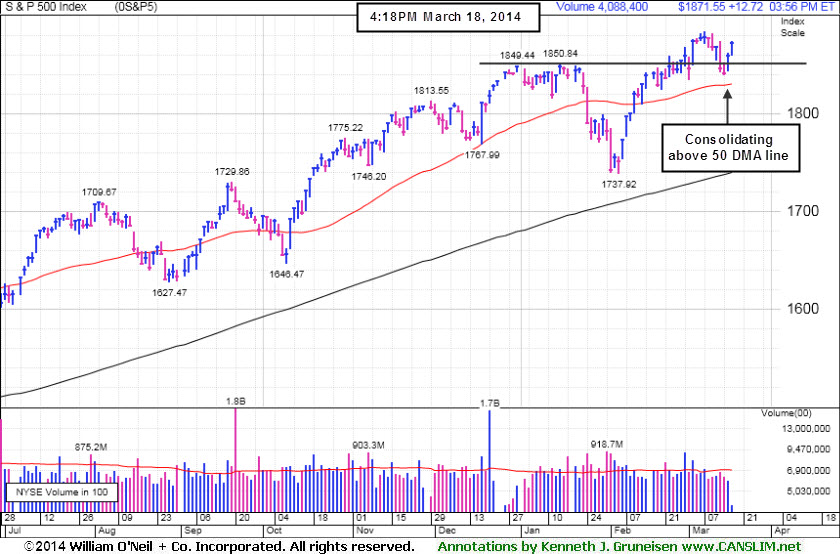
The major averages posted gains on Tuesday's session. Volume totals were reported mixed, slightly lower on the NYSE and yet higher on the Nasdaq exchange. Advancers led decliners by more than a 3-1 margin on the NYSE and on the Nasdaq exchange. There were 48 high-ranked companies from the CANSLIM.net Leaders List that made new 52-week highs and appeared on the CANSLIM.net BreakOuts Page, up from the total of 42 stocks on the prior session. The list of stocks hitting new 52-week highs easily outnumbered new 52-week lows on the Nasdaq exchange and on the NYSE. There were gains for 10 of the 12 high-ranked companies currently included on the Featured Stocks Page. The Market (M criteria) uptrend faced some recent pressure and yet the rally has continued. For any rally to be sustained it is critical for there to be healthy leadership, so it remains crucial for many stocks to continue hitting new 52-week highs.
The major averages advanced for a second day following comments by Vladimir Putin. The Russian President said that while he supports Crimea becoming part of Russia, he does not want to further divide Ukraine.
The latest economic data also provided a tailwind for stocks. Before the open, a report showed housing starts dipped -0.2% in February, suggesting the real estate market is stabilizing from the impact of the winter weather on construction. A separate release showed inflation remained tame with consumer prices increasing +0.1% last month.
Nine of 10 sectors were up on the session. Tech and health care were the best performing groups. Microsoft (MSFT +3.94%) rallied on reports it may release a version of Office for Apple Inc's (AAPL +0.88%) iPad. Gilead Sciences (GILD +3.07%) was up to pace gains in biotech. Utilities were the lone sector lower with Duke Energy (DUK -1.21%) down on the day. GameStop (GME -3.42%) was a notable decliner after Wal-Mart (WMT +0.12%) announced a program for customers to trade in video games for store credit.
Treasuries rose with the 10-year note up 5/32 to yield 2.67%.
The CANSLIM.net Featured Stocks Page shows the most action-worthy candidates and their latest notes and a Headline Link directs members to the latest detailed analysis with data-packed graphs annotated by a Certified expert along with links to additional resources. The Premium Member Homepage includes "dynamic archives" to all prior pay reports published. Watch for an announcement via email concerning the next WEBCAST.
PICTURED: The S&P 500 Index is consolidating above prior highs and well above its 50-day moving average (DMA) line
|
 Kenneth J. Gruneisen started out as a licensed stockbroker in August 1987, a couple of months prior to the historic stock market crash that took the Dow Jones Industrial Average down -22.6% in a single day. He has published daily fact-based fundamental and technical analysis on high-ranked stocks online for two decades. Through FACTBASEDINVESTING.COM, Kenneth provides educational articles, news, market commentary, and other information regarding proven investment systems that work in good times and bad.
Comments contained in the body of this report are technical opinions only and are not necessarily those of Gruneisen Growth Corp. The material herein has been obtained from sources believed to be reliable and accurate, however, its accuracy and completeness cannot be guaranteed. Our firm, employees, and customers may effect transactions, including transactions contrary to any recommendation herein, or have positions in the securities mentioned herein or options with respect thereto. Any recommendation contained in this report may not be suitable for all investors and it is not to be deemed an offer or solicitation on our part with respect to the purchase or sale of any securities. |
|
 |
Tech, Energy, and Financial Groups Led Gainers
Kenneth J. Gruneisen - Passed the CAN SLIM® Master's Exam
The tech sector led the market higher as the Networking Index ($NWX +1.30%), Semiconductor Index ($SOX +1.35%), and the Biotechnology Index ($BTK +3.26%) posted solid gains. Energy-related shares had a positive bias as the Integrated Oil Index ($XOI +0.93%) and the Oil Services Index ($OSX +1.20%) rose. Financial shares also helped underpin the major averages as the Bank Index ($BKX +0.51%) and the Broker/Dealer Index ($XBD +0.51%) edged higher, and the Retail Index ($RLX +0.28%) also posted a small gain. The Gold & Silver Index ($XAU -0.81%) was a laggard as it pulled back.
Charts courtesy www.stockcharts.com
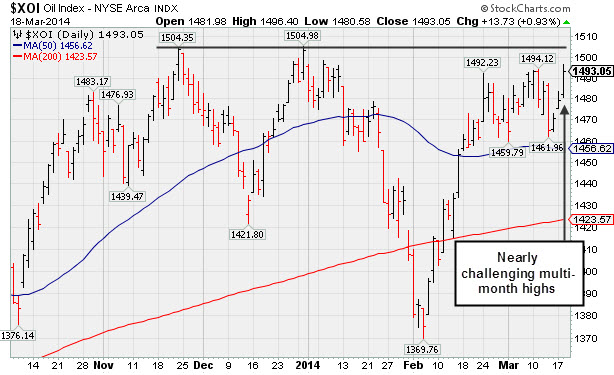
PICTURED: The Integrated Oil Index ($XOI +0.93%) is nearly challenging multi-month highs after tallying a 3rd consecutive gain.
| Oil Services |
$OSX |
280.54 |
+3.34 |
+1.20% |
-0.17% |
| Integrated Oil |
$XOI |
1,493.05 |
+13.73 |
+0.93% |
-0.67% |
| Semiconductor |
$SOX |
577.19 |
+7.69 |
+1.35% |
+7.88% |
| Networking |
$NWX |
343.12 |
+4.42 |
+1.30% |
+5.92% |
| Broker/Dealer |
$XBD |
161.71 |
+0.83 |
+0.51% |
+0.72% |
| Retail |
$RLX |
929.86 |
+2.60 |
+0.28% |
-1.06% |
| Gold & Silver |
$XAU |
102.08 |
-0.83 |
-0.81% |
+21.31% |
| Bank |
$BKX |
70.77 |
+0.36 |
+0.51% |
+2.18% |
| Biotech |
$BTK |
2,837.68 |
+89.60 |
+3.26% |
+21.77% |
|
|
|
 |
Halted Slide After Undercutting Prior Highs on Pullback
Kenneth J. Gruneisen - Passed the CAN SLIM® Master's Exam
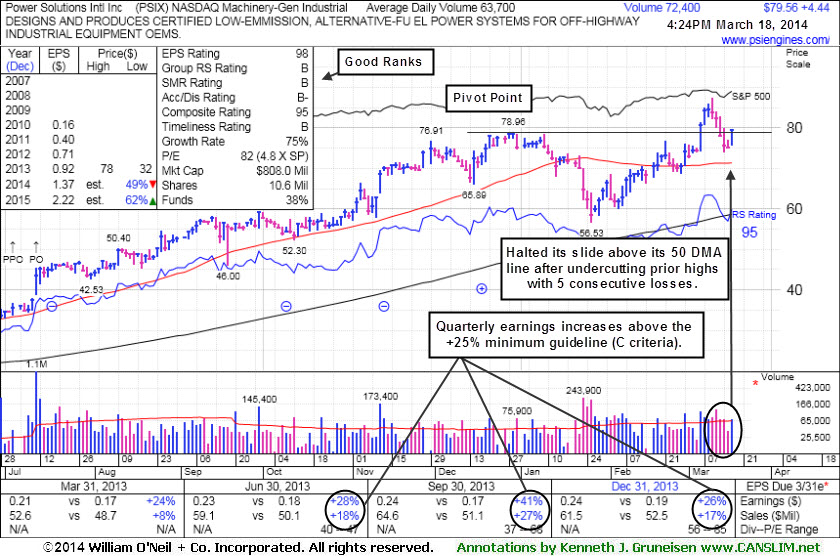
Power Solutions Int'l Inc (PSIX +$4.43 or +5.90% to $79.55) halted its slide above its 50-day moving average (DMA) line and finished near the session high with a solid gain today following 5 consecutive losses. It briefly undercut prior highs in the $78 area raising concerns, yet appears to have found prompt support. Disciplined investors avoid chasing stocks more than +5% above prior highs and always sell if any stock falls more than -7% from their purchase price.
The high-ranked firm from the Machinery - General Industrial group was last shown in this FSU section on 2/28/14 with annotated graphs under the headline, "Earnings Solid and Forming a Cup-With-Handle", after highlighted in yellow with a pivot point cited based on its 2/21/14 high in the earlier mid-day report (read here). It reported earnings +26% on +17% sales revenues for the Dec '13 quarter, its 3rd consecutive quarter with earnings above the +25% minimum guideline (C criteria).
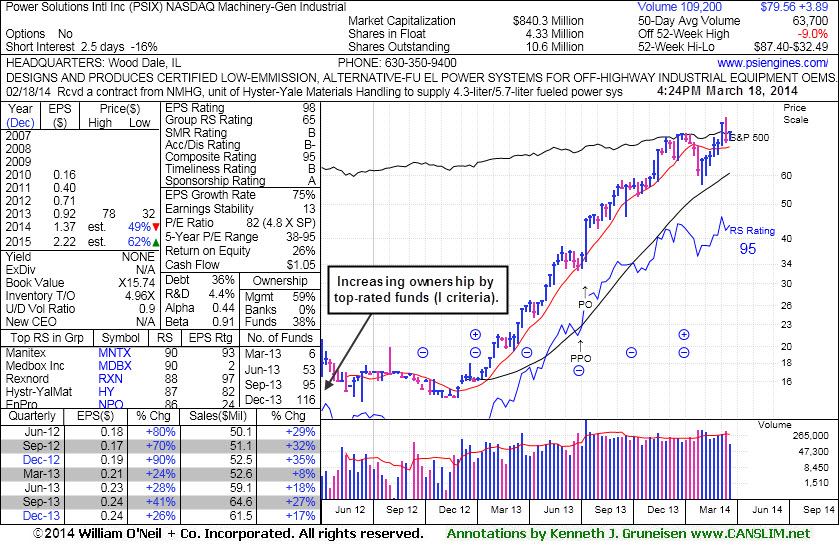
The number of top-rated funds owning its shares rose from 6 in Mar '13 to 116 in Dec '13, a reassuring trend concerning the I criteria. The small supply of only 4.33 million shares (S criteria) can contribute to greater price volatility in the event of institutional buying or selling. Additional leadership in the Machinery - General Industrial group (L criteria) is reassuring.
|
|
|
Color Codes Explained :
Y - Better candidates highlighted by our
staff of experts.
G - Previously featured
in past reports as yellow but may no longer be buyable under the
guidelines.
***Last / Change / Volume data in this table is the closing quote data***
Symbol/Exchange
Company Name
Industry Group |
PRICE |
CHANGE
(%Change) |
Day High |
Volume
(% DAV)
(% 50 day avg vol) |
52 Wk Hi
% From Hi |
Featured
Date |
Price
Featured |
Pivot Featured |
|
Max Buy |
EQM
-
NYSE
E Q T Midstream Partners
ENERGY - Oil and Gas Pipelines
|
$66.96
|
+1.01
1.53% |
$67.53
|
91,920
86.72% of 50 DAV
50 DAV is 106,000
|
$67.80
-1.24%
|
12/12/2013
|
$53.17
|
PP = $56.51
|
|
MB = $59.34
|
Most Recent Note - 3/17/2014 6:45:35 PM
G - Posted a gain today, finding support above its 50 DMA line. Still stubbornly holding its ground since reporting earnings -2% on +22% sales revenues for the Dec '13 quarter, below the +25% minimum earnings guideline (C criteria), raising fundamental concerns. Its 50 DMA line ($63.49 now) defines near-term support where a violation may trigger a technical sell signal.
>>> FEATURED STOCK ARTICLE : Resilient Despite Fundamental Concerns - 3/3/2014
View all notes |
Set NEW NOTE alert |
CANSLIM.net Company Profile |
SEC
News |
Chart |
Request a new note
C
A N
S L
I M


|
FB
-
NASDAQ
Facebook Inc Cl A
INTERNET
|
$69.19
|
+0.45
0.65% |
$69.60
|
40,689,000
68.80% of 50 DAV
50 DAV is 59,145,000
|
$72.59
-4.68%
|
12/12/2013
|
$51.40
|
PP = $54.93
|
|
MB = $57.68
|
Most Recent Note - 3/14/2014 5:36:57 PM
G - Pulling back after getting extended from any sound base. Its 50 DMA line ($63 now) defines near-term support to watch. See the latest FSU analysis for more details and new annotated graphs.
>>> FEATURED STOCK ARTICLE : Pulling Back After Getting Extended From Prior Base - 3/14/2014
View all notes |
Set NEW NOTE alert |
CANSLIM.net Company Profile |
SEC
News |
Chart |
Request a new note
C
A N
S L
I M
|
FLT
-
NYSE
Fleetcor Technologies
DIVERSIFIED SERVICES - Business/Management Services
|
$120.48
|
+1.79
1.51% |
$120.59
|
545,563
47.40% of 50 DAV
50 DAV is 1,151,000
|
$132.22
-8.88%
|
3/5/2014
|
$125.40
|
PP = $124.06
|
|
MB = $130.26
|
Most Recent Note - 3/17/2014 6:50:43 PM
Y - Recent slump below its old high close ($122.70 on 12/02/13) raised concerns as it completely negated the recent breakout. Still consolidating above its 50 DMA line, but its Relative Strength rating has slumped to 78, below the 80+ minimum guideline for buy candidates.
>>> FEATURED STOCK ARTICLE : Consolidating Following Recent Breakout to New High Territory - 3/5/2014
View all notes |
Set NEW NOTE alert |
CANSLIM.net Company Profile |
SEC
News |
Chart |
Request a new note
C
A N
S L
I M
|
GNRC
-
NYSE
Generac Hldgs Inc
Electrical-Power/Equipmt
|
$60.67
|
-0.50
-0.82% |
$61.61
|
647,378
66.40% of 50 DAV
50 DAV is 975,000
|
$62.50
-2.93%
|
2/14/2014
|
$56.50
|
PP = $57.39
|
|
MB = $60.26
|
Most Recent Note - 3/14/2014 5:43:54 PM
G - Color code is changed to green after finishing near the session high and above its "max buy" level with a solid gain today backed by +31% above average volume.
>>> FEATURED STOCK ARTICLE : Bullish Gap Up Followed By Wedging and Stalling Action - 3/11/2014
View all notes |
Set NEW NOTE alert |
CANSLIM.net Company Profile |
SEC
News |
Chart |
Request a new note
C
A N
S L
I M
|
ICON
-
NASDAQ
Iconix Brand Group Inc
CONSUMER NON-DURABLES - Textile - Apparel Footwear
|
$40.87
|
+0.26
0.64% |
$41.00
|
383,944
59.90% of 50 DAV
50 DAV is 641,000
|
$42.47
-3.76%
|
3/7/2014
|
$41.46
|
PP = $40.88
|
|
MB = $42.92
|
Most Recent Note - 3/17/2014 12:10:11 PM
Y - Halting its 4-session losing streak with a gain today. Prior highs in the $40 area define near-term support. Highlighted in yellow with pivot point cited based on its 12/02/13 high plus 10 cents in the 3/07/14 mid-day report (read here) and covered in greater detail with annotated graphs in that evening's report.
>>> FEATURED STOCK ARTICLE : Encountered Distributional Pressure Following Recent Breakout - 3/7/2014
View all notes |
Set NEW NOTE alert |
CANSLIM.net Company Profile |
SEC
News |
Chart |
Request a new note
C
A N
S L
I M
|
Symbol/Exchange
Company Name
Industry Group |
PRICE |
CHANGE
(%Change) |
Day High |
Volume
(% DAV)
(% 50 day avg vol) |
52 Wk Hi
% From Hi |
Featured
Date |
Price
Featured |
Pivot Featured |
|
Max Buy |
KORS
-
NYSE
Michael Kors Hldgs Ltd
RETAIL - Apparel Stores
|
$96.77
|
-1.79
-1.82% |
$97.41
|
3,004,232
84.55% of 50 DAV
50 DAV is 3,553,000
|
$101.04
-4.23%
|
3/12/2014
|
$98.03
|
PP = $101.14
|
|
MB = $106.20
|
Most Recent Note - 3/12/2014 5:35:29 PM
Y - Color code is changed to yellow with new pivot point cited based on its 2/25/14 high plus 10 cents. While stubbornly holding its ground in a tight range near its 52-week high, volume totals cooling in recent weeks indicates that few investors have headed for the exit. Its 50 DMA line ($88) defines the nearest support above prior highs in the $84 area. See the latest FSU analysis for more details and new annotated graphs.
>>> FEATURED STOCK ARTICLE : Formed Advanced Base Pattern With Volume Totals Cooling - 3/12/2014
View all notes |
Set NEW NOTE alert |
CANSLIM.net Company Profile |
SEC
News |
Chart |
Request a new note
C
A N
S L
I M
|
LEAF
-
NYSE
Springleaf Holdings Inc
Finance-Consumer Loans
|
$25.84
|
+0.74
2.95% |
$25.84
|
404,333
124.30% of 50 DAV
50 DAV is 325,300
|
$29.50
-12.41%
|
2/24/2014
|
$28.60
|
PP = $27.44
|
|
MB = $28.81
|
 Most Recent Note - 3/18/2014 4:12:43 PM
Halted its slide and posted 2 gains on lighter volume after a streak of damaging losses with higher volume totals led to a 50 DMA line violation and technical sell signal. A prompt rebound above the 50 DMA line is needed for its outlook to improve. Its Relative Strength rating has slumped to 77, below the 80+ minimum guideline for buy candidates. It will be dropped from the Featured Stocks list tonight.
>>> FEATURED STOCK ARTICLE : Fourth Loss on Above Average Volume Testing 50-Day Average - 3/13/2014
View all notes |
Set NEW NOTE alert |
CANSLIM.net Company Profile |
SEC
News |
Chart |
Request a new note
C
A N
S L
I M
|
PCLN
-
NASDAQ
Priceline.com Inc
INTERNET - Internet Software and Services
|
$1,304.43
|
+16.47
1.28% |
$1,305.39
|
567,131
71.16% of 50 DAV
50 DAV is 797,000
|
$1,378.96
-5.40%
|
12/18/2013
|
$1,156.20
|
PP = $1,198.85
|
|
MB = $1,258.79
|
Most Recent Note - 3/17/2014 12:14:38 PM
G - Halting its slide today after 2 consecutive big losses and closes near the session lows. Near-term support to watch is its 50 DMA line ($1,235).
>>> FEATURED STOCK ARTICLE : Perched At Highs With Volume Totals Cooling - 3/10/2014
View all notes |
Set NEW NOTE alert |
CANSLIM.net Company Profile |
SEC
News |
Chart |
Request a new note
C
A N
S L
I M
|
PSIX
-
NASDAQ
Power Solutions Intl Inc
Machinery-Gen Industrial
|
$79.56
|
+4.44
5.91% |
$79.70
|
72,557
115.17% of 50 DAV
50 DAV is 63,000
|
$87.40
-8.97%
|
2/28/2014
|
$74.65
|
PP = $76.93
|
|
MB = $80.78
|
Most Recent Note - 3/18/2014 5:08:56 PM
Y - Halted its slide with a solid gain today following 5 consecutive losses. Prior highs in the $78 area may act as support. See the latest FSU analysis for more details and new annotated graphs.
>>> FEATURED STOCK ARTICLE : Halted Slide After Undercutting Prior Highs on Pullback - 3/18/2014
View all notes |
Set NEW NOTE alert |
CANSLIM.net Company Profile |
SEC
News |
Chart |
Request a new note
C
A N
S L
I M
|
SILC
-
NASDAQ
Silicom Ltd
COMPUTER HARDWARE - Networking andamp; Communication Dev
|
$68.90
|
+0.41
0.60% |
$69.09
|
77,021
91.69% of 50 DAV
50 DAV is 84,000
|
$73.44
-6.18%
|
12/23/2013
|
$44.62
|
PP = $46.25
|
|
MB = $48.56
|
Most Recent Note - 3/12/2014 5:41:23 PM
G - Posted a gain today on lighter volume after retreating from all-time highs with 4 consecutive losses. Extended from any sound base. Patient investors may watch for a new base or secondary buy point to possibly develop and be noted in the weeks ahead.
>>> FEATURED STOCK ARTICLE : Very Extended From Prior Base After 11 Straight Weekly Gains - 3/6/2014
View all notes |
Set NEW NOTE alert |
CANSLIM.net Company Profile |
SEC
News |
Chart |
Request a new note
C
A N
S L
I M
|
Symbol/Exchange
Company Name
Industry Group |
PRICE |
CHANGE
(%Change) |
Day High |
Volume
(% DAV)
(% 50 day avg vol) |
52 Wk Hi
% From Hi |
Featured
Date |
Price
Featured |
Pivot Featured |
|
Max Buy |
ULTI
-
NASDAQ
Ultimate Software Group
INTERNET - Internet Software and Services
|
$158.68
|
+2.02
1.29% |
$160.17
|
151,782
71.60% of 50 DAV
50 DAV is 212,000
|
$171.96
-7.72%
|
1/27/2014
|
$153.75
|
PP = $162.98
|
|
MB = $171.13
|
Most Recent Note - 3/17/2014 6:47:37 PM
G - Volume was below average behind today's 2nd consecutive small gain. Remains below its 50 DMA line after damaging losses, and only a prompt rebound above that important short-term average would help its outlook improve.
>>> FEATURED STOCK ARTICLE : Near 52--Week High Following Another Volume-Driven Gain - 3/4/2014
View all notes |
Set NEW NOTE alert |
CANSLIM.net Company Profile |
SEC
News |
Chart |
Request a new note
C
A N
S L
I M
|
VRX
-
NYSE
Valeant Pharmaceuticals
DRUGS - Drug Manufacturers - Other
|
$144.18
|
+3.28
2.33% |
$147.00
|
1,321,478
76.12% of 50 DAV
50 DAV is 1,736,000
|
$153.10
-5.83%
|
9/11/2013
|
$100.26
|
PP = $105.50
|
|
MB = $110.78
|
Most Recent Note - 3/17/2014 6:44:14 PM
G - Consolidating just above its 50 DMA line ($137.66) which defines near-term support. A more damaging violation may raise serious concerns and trigger a more worrisome technical sell signal. See the latest FSU analysis for more details and new annotated graphs.
>>> FEATURED STOCK ARTICLE : Finding Support Above 50-Day Moving Average Line - 3/17/2014
View all notes |
Set NEW NOTE alert |
CANSLIM.net Company Profile |
SEC
News |
Chart |
Request a new note
C
A N
S L
I M
|
|
|
|
THESE ARE NOT BUY RECOMMENDATIONS!
Comments contained in the body of this report are technical
opinions only. The material herein has been obtained
from sources believed to be reliable and accurate, however,
its accuracy and completeness cannot be guaranteed.
This site is not an investment advisor, hence it does
not endorse or recommend any securities or other investments.
Any recommendation contained in this report may not
be suitable for all investors and it is not to be deemed
an offer or solicitation on our part with respect to
the purchase or sale of any securities. All trademarks,
service marks and trade names appearing in this report
are the property of their respective owners, and are
likewise used for identification purposes only.
This report is a service available
only to active Paid Premium Members.
You may opt-out of receiving report notifications
at any time. Questions or comments may be submitted
by writing to Premium Membership Services 665 S.E. 10 Street, Suite 201 Deerfield Beach, FL 33441-5634 or by calling 1-800-965-8307
or 954-785-1121.
|
|
|

