You are not logged in.
This means you
CAN ONLY VIEW reports that were published prior to Tuesday, April 15, 2025.
You
MUST UPGRADE YOUR MEMBERSHIP if you want to see any current reports.
AFTER MARKET UPDATE - MONDAY, MARCH 17TH, 2014
Previous After Market Report Next After Market Report >>>
|
|
|
|
DOW |
+181.55 |
16,247.22 |
+1.13% |
|
Volume |
593,197,950 |
-6% |
|
Volume |
1,695,098,140 |
-18% |
|
NASDAQ |
+34.55 |
4,279.95 |
+0.81% |
|
Advancers |
2,203 |
70% |
|
Advancers |
1,782 |
63% |
|
S&P 500 |
+17.70 |
1,858.83 |
+0.96% |
|
Decliners |
817 |
26% |
|
Decliners |
945 |
33% |
|
Russell 2000 |
+6.82 |
1,188.23 |
+0.58% |
|
52 Wk Highs |
116 |
|
|
52 Wk Highs |
116 |
|
|
S&P 600 |
+4.41 |
674.04 |
+0.66% |
|
52 Wk Lows |
16 |
|
|
52 Wk Lows |
15 |
|
|
 |
Major Averages Posted Big Gains But With Less Volume Conviction
Kenneth J. Gruneisen - Passed the CAN SLIM® Master's Exam
The major averages rallied on Monday's session. Volume totals were reported lighter on the NYSE and on the Nasdaq exchange, revealing a lack of institutional buying conviction. Advancers led decliners by an 11-4 margin on the NYSE and about 2-1 on the Nasdaq exchange. There were 42 high-ranked companies from the CANSLIM.net Leaders List that made new 52-week highs and appeared on the CANSLIM.net BreakOuts Page, more than doubling the total of 20 stocks on the prior session. The list of stocks hitting new 52-week highs easily outnumbered new 52-week lows on the Nasdaq exchange and on the NYSE. There were gains for 11 of the 12 high-ranked companies currently included on the Featured Stocks Page. The Market (M criteria) uptrend has come under pressure recently and investors should be watchful for individual issues flashing technical sell signals. For any rally to be sustained it is critical for there to be healthy leadership, so it remains crucial for many stocks to continue hitting new 52-week highs.
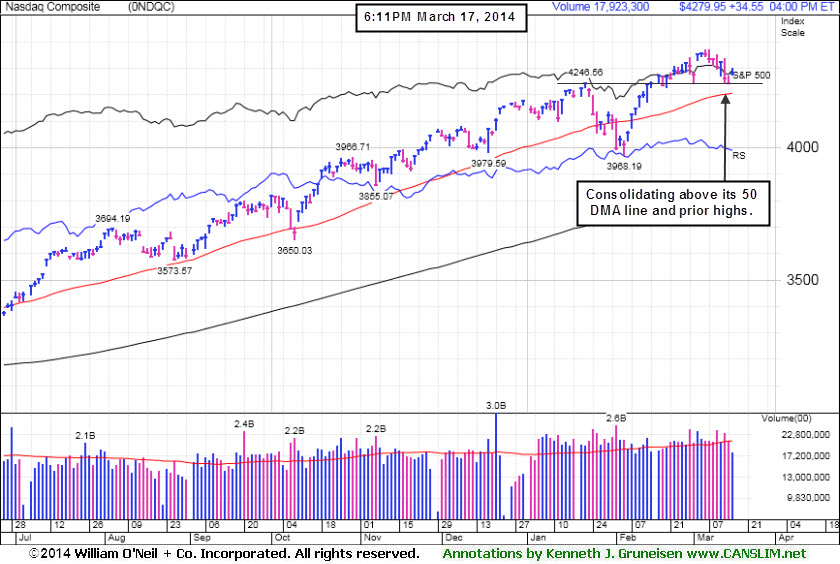
The Dow rose 181 points to 16,247. The S&P 500 climbed from a three-week low as it gained 17 points to 1,858. The NASDAQ advanced 34 points to 4,279.
Stocks rebounded from last week's drop as industrial production unexpectedly increased in February by the most in six months. Other economic data was mixed. Manufacturing in the New York area did not improve as much as anticipated this month, while home builder confidence edged up slightly. The crisis in Ukraine also garnered attention. Crimea voted to break away from Ukraine and rejoin Russia, prompting the U.S. and EU to condemn the referendum as illegal and announce sanctions against Russia.
Overall, every sector finished in positive territory. Technology and industrials paced the advance as Qualcomm Inc (QCOM +3.05%) and General Electric (GE +1.27%) rose. Health care stocks also helped lift the market as Biogen Idec Inc (BIIB +3.94%) rose following news that the company will be added to the S&P 100 Index.
Treasury prices declined for a second day. The 10-year note fell 10/32 to yield 2.69%. The 30-year bond lost half of a point to yield 3.63%.
The CANSLIM.net Featured Stocks Page shows the most action-worthy candidates and their latest notes and a Headline Link directs members to the latest detailed analysis with data-packed graphs annotated by a Certified expert along with links to additional resources. The Premium Member Homepage includes "dynamic archives" to all prior pay reports published. Watch for an announcement via email concerning the next WEBCAST.
PICTURED: The Nasdaq Composite Index is consolidating above prior highs and well above its 50-day moving average (DMA) line.
|
 Kenneth J. Gruneisen started out as a licensed stockbroker in August 1987, a couple of months prior to the historic stock market crash that took the Dow Jones Industrial Average down -22.6% in a single day. He has published daily fact-based fundamental and technical analysis on high-ranked stocks online for two decades. Through FACTBASEDINVESTING.COM, Kenneth provides educational articles, news, market commentary, and other information regarding proven investment systems that work in good times and bad.
Comments contained in the body of this report are technical opinions only and are not necessarily those of Gruneisen Growth Corp. The material herein has been obtained from sources believed to be reliable and accurate, however, its accuracy and completeness cannot be guaranteed. Our firm, employees, and customers may effect transactions, including transactions contrary to any recommendation herein, or have positions in the securities mentioned herein or options with respect thereto. Any recommendation contained in this report may not be suitable for all investors and it is not to be deemed an offer or solicitation on our part with respect to the purchase or sale of any securities. |
|
 |
Financial, Tech, Retail, and Energy-Related Groups Rose
Kenneth J. Gruneisen - Passed the CAN SLIM® Master's Exam
The Semiconductor Index ($SOX +1.25%) led the tech sector higher while the Networking Index ($NWX +0.43%) and the Biotechnology Index ($BTK +0.44%) posted smaller gains. The financial groups were a positive influence on the major averages as the Bank Index ($BKX +1.25%) and the Broker/Dealer Index ($XBD +1.26%) both rose. The Retail Index ($RLX +0.67%) posted a modest gain. Energy-related shares rounded out the mostly positive session as the Oil Services Index ($OSX +1.23%) and the Integrated Oil Index ($XOI +0.60%) both rose. Meanwhile, the Gold & Silver Index ($XAU -3.10%) was down considerably, leading decliners.
Charts courtesy www.stockcharts.com

PICTURED: The Bank Index ($BKX +1.25%) halted its slide after 4 consecutive losses while consolidating above its 50-day moving average (DMA) line.
| Oil Services |
$OSX |
277.20 |
+3.38 |
+1.23% |
-1.36% |
| Integrated Oil |
$XOI |
1,479.32 |
+8.82 |
+0.60% |
-1.58% |
| Semiconductor |
$SOX |
569.50 |
+7.02 |
+1.25% |
+6.44% |
| Networking |
$NWX |
338.70 |
+1.46 |
+0.43% |
+4.56% |
| Broker/Dealer |
$XBD |
160.88 |
+2.00 |
+1.26% |
+0.20% |
| Retail |
$RLX |
927.26 |
+6.19 |
+0.67% |
-1.33% |
| Gold & Silver |
$XAU |
102.91 |
-3.29 |
-3.10% |
+22.29% |
| Bank |
$BKX |
70.41 |
+0.87 |
+1.25% |
+1.66% |
| Biotech |
$BTK |
2,748.08 |
+11.97 |
+0.44% |
+17.92% |
|
|
|
 |
Finding Support Above 50-Day Moving Average Line
Kenneth J. Gruneisen - Passed the CAN SLIM® Master's Exam
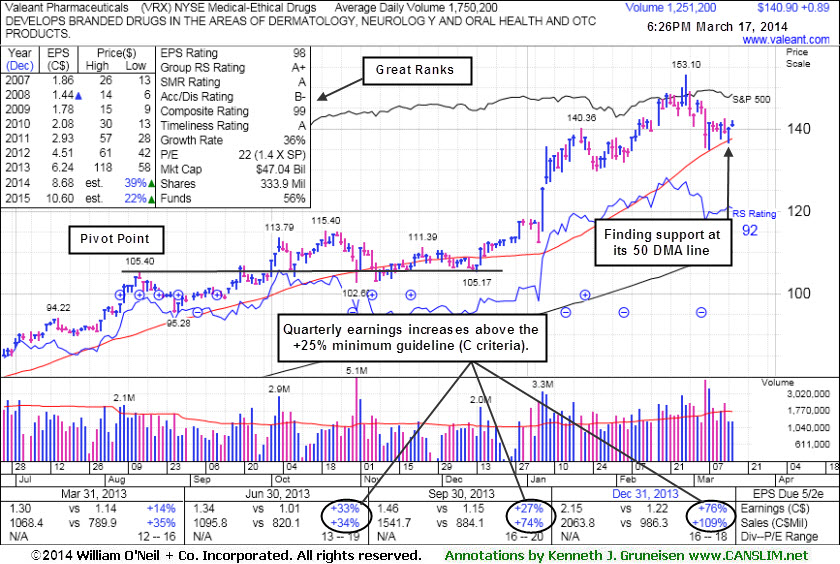
Valeant Pharmaceuticals International, Inc (VRX +$0.89 or +0.64% to $140.90) is consolidating just above its 50-day moving average (DMA) line ($136) which defines important near-term support. A more damaging violation of that important short-term average may raise serious concerns and trigger a more worrisome technical sell signal. It is extended from any sound base. Patient investors may watch for a new sound base to possibly develop and be noted in the future.
VRX was last shown in this FSU section on 2/27/14 with annotated daily and weekly graphs under the headline, "Strong Earnings Report; On Track for 9th Weekly Gain in 10 Weeks". It reported better than expected Dec '13 quarterly results with earnings +76% on +109% sales revenues, an improvement from the Sep '13 quarter which was a notch below the +25% minimum guideline (C criteria). A downturn in FY '07 and '08 earnings (A criteria) was been followed by a strong earnings rebound in recent years.
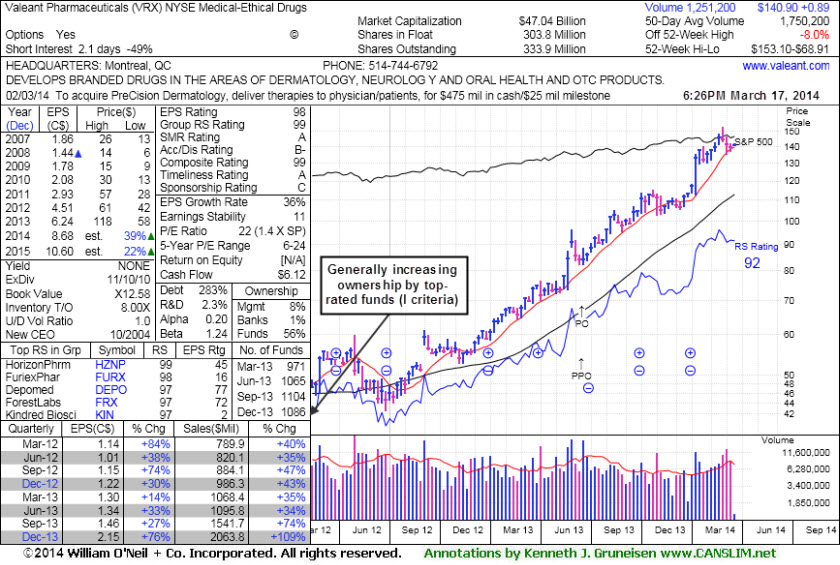
The number of top-rated funds owning its shares rose from 818 in Mar '12 in to 1,086 in Dec '13, a reassuring trend concerning the I criteria. The high-ranked Medical - Ethical Drugs firm completed Public Offering on 6/18/13. The upshot of Public Offerings is that when completed the end result is typically an increase in the total number of institutional owners. Institutional owners are often supportive of their existing positions and will even accumulate more shares when they consolidate near classic support levels like the 50-day and 200-day moving average (DMA) lines, if they are still believers in the company. If too many become pessimistic and decide to unload, this is what ends up sending the stocks slicing through support.
|
|
|
Color Codes Explained :
Y - Better candidates highlighted by our
staff of experts.
G - Previously featured
in past reports as yellow but may no longer be buyable under the
guidelines.
***Last / Change / Volume data in this table is the closing quote data***
Symbol/Exchange
Company Name
Industry Group |
PRICE |
CHANGE
(%Change) |
Day High |
Volume
(% DAV)
(% 50 day avg vol) |
52 Wk Hi
% From Hi |
Featured
Date |
Price
Featured |
Pivot Featured |
|
Max Buy |
EQM
-
NYSE
E Q T Midstream Partners
ENERGY - Oil and Gas Pipelines
|
$65.95
|
+1.47
2.28% |
$66.42
|
86,830
79.66% of 50 DAV
50 DAV is 109,000
|
$67.80
-2.73%
|
12/12/2013
|
$53.17
|
PP = $56.51
|
|
MB = $59.34
|
 Most Recent Note - 3/17/2014 6:45:35 PM
G - Posted a gain today, finding support above its 50 DMA line. Still stubbornly holding its ground since reporting earnings -2% on +22% sales revenues for the Dec '13 quarter, below the +25% minimum earnings guideline (C criteria), raising fundamental concerns. Its 50 DMA line ($63.49 now) defines near-term support where a violation may trigger a technical sell signal.
>>> FEATURED STOCK ARTICLE : Resilient Despite Fundamental Concerns - 3/3/2014
View all notes |
Set NEW NOTE alert |
CANSLIM.net Company Profile |
SEC
News |
Chart |
Request a new note
C
A N
S L
I M


|
FB
-
NASDAQ
Facebook Inc Cl A
INTERNET
|
$68.74
|
+1.02
1.51% |
$68.95
|
52,166,617
88.47% of 50 DAV
50 DAV is 58,966,000
|
$72.59
-5.30%
|
12/12/2013
|
$51.40
|
PP = $54.93
|
|
MB = $57.68
|
Most Recent Note - 3/14/2014 5:36:57 PM
G - Pulling back after getting extended from any sound base. Its 50 DMA line ($63 now) defines near-term support to watch. See the latest FSU analysis for more details and new annotated graphs.
>>> FEATURED STOCK ARTICLE : Pulling Back After Getting Extended From Prior Base - 3/14/2014
View all notes |
Set NEW NOTE alert |
CANSLIM.net Company Profile |
SEC
News |
Chart |
Request a new note
C
A N
S L
I M
|
FLT
-
NYSE
Fleetcor Technologies
DIVERSIFIED SERVICES - Business/Management Services
|
$118.69
|
+0.64
0.54% |
$119.59
|
796,448
68.50% of 50 DAV
50 DAV is 1,162,700
|
$132.22
-10.23%
|
3/5/2014
|
$125.40
|
PP = $124.06
|
|
MB = $130.26
|
Most Recent Note - 3/17/2014 6:50:43 PM
Y - Recent slump below its old high close ($122.70 on 12/02/13) raised concerns as it completely negated the recent breakout. Still consolidating above its 50 DMA line, but its Relative Strength rating has slumped to 78, below the 80+ minimum guideline for buy candidates.
>>> FEATURED STOCK ARTICLE : Consolidating Following Recent Breakout to New High Territory - 3/5/2014
View all notes |
Set NEW NOTE alert |
CANSLIM.net Company Profile |
SEC
News |
Chart |
Request a new note
C
A N
S L
I M
|
GNRC
-
NYSE
Generac Hldgs Inc
Electrical-Power/Equipmt
|
$61.17
|
+0.70
1.16% |
$62.50
|
967,933
99.99% of 50 DAV
50 DAV is 968,000
|
$60.67
0.82%
|
2/14/2014
|
$56.50
|
PP = $57.39
|
|
MB = $60.26
|
Most Recent Note - 3/14/2014 5:43:54 PM
G - Color code is changed to green after finishing near the session high and above its "max buy" level with a solid gain today backed by +31% above average volume.
>>> FEATURED STOCK ARTICLE : Bullish Gap Up Followed By Wedging and Stalling Action - 3/11/2014
View all notes |
Set NEW NOTE alert |
CANSLIM.net Company Profile |
SEC
News |
Chart |
Request a new note
C
A N
S L
I M
|
ICON
-
NASDAQ
Iconix Brand Group Inc
CONSUMER NON-DURABLES - Textile - Apparel Footwear
|
$40.61
|
+0.71
1.78% |
$41.07
|
897,490
142.08% of 50 DAV
50 DAV is 631,700
|
$42.47
-4.37%
|
3/7/2014
|
$41.46
|
PP = $40.88
|
|
MB = $42.92
|
Most Recent Note - 3/17/2014 12:10:11 PM
Y - Halting its 4-session losing streak with a gain today. Prior highs in the $40 area define near-term support. Highlighted in yellow with pivot point cited based on its 12/02/13 high plus 10 cents in the 3/07/14 mid-day report (read here) and covered in greater detail with annotated graphs in that evening's report.
>>> FEATURED STOCK ARTICLE : Encountered Distributional Pressure Following Recent Breakout - 3/7/2014
View all notes |
Set NEW NOTE alert |
CANSLIM.net Company Profile |
SEC
News |
Chart |
Request a new note
C
A N
S L
I M
|
Symbol/Exchange
Company Name
Industry Group |
PRICE |
CHANGE
(%Change) |
Day High |
Volume
(% DAV)
(% 50 day avg vol) |
52 Wk Hi
% From Hi |
Featured
Date |
Price
Featured |
Pivot Featured |
|
Max Buy |
KORS
-
NYSE
Michael Kors Hldgs Ltd
RETAIL - Apparel Stores
|
$98.56
|
+0.44
0.45% |
$99.01
|
1,540,800
42.93% of 50 DAV
50 DAV is 3,589,000
|
$101.04
-2.45%
|
3/12/2014
|
$98.03
|
PP = $101.14
|
|
MB = $106.20
|
Most Recent Note - 3/12/2014 5:35:29 PM
Y - Color code is changed to yellow with new pivot point cited based on its 2/25/14 high plus 10 cents. While stubbornly holding its ground in a tight range near its 52-week high, volume totals cooling in recent weeks indicates that few investors have headed for the exit. Its 50 DMA line ($88) defines the nearest support above prior highs in the $84 area. See the latest FSU analysis for more details and new annotated graphs.
>>> FEATURED STOCK ARTICLE : Formed Advanced Base Pattern With Volume Totals Cooling - 3/12/2014
View all notes |
Set NEW NOTE alert |
CANSLIM.net Company Profile |
SEC
News |
Chart |
Request a new note
C
A N
S L
I M
|
LEAF
-
NYSE
Springleaf Holdings Inc
Finance-Consumer Loans
|
$25.10
|
+0.62
2.53% |
$25.34
|
390,963
118.55% of 50 DAV
50 DAV is 329,800
|
$29.50
-14.92%
|
2/24/2014
|
$28.60
|
PP = $27.44
|
|
MB = $28.81
|
Most Recent Note - 3/17/2014 6:52:57 PM
G - Halted its slide and posted a gain today on above average but lighter volume after a streak of damaging losses led to a 50 DMA line violation and technical sell signal. Disciplined investors avoid chasing extended stocks more than +5% above prior highs and always limit losses by selling any stock that falls more than -7% from their purchase price.
>>> FEATURED STOCK ARTICLE : Fourth Loss on Above Average Volume Testing 50-Day Average - 3/13/2014
View all notes |
Set NEW NOTE alert |
CANSLIM.net Company Profile |
SEC
News |
Chart |
Request a new note
C
A N
S L
I M
|
PCLN
-
NASDAQ
Priceline.com Inc
INTERNET - Internet Software and Services
|
$1,287.96
|
+20.03
1.58% |
$1,308.79
|
900,788
113.74% of 50 DAV
50 DAV is 792,000
|
$1,378.96
-6.60%
|
12/18/2013
|
$1,156.20
|
PP = $1,198.85
|
|
MB = $1,258.79
|
Most Recent Note - 3/17/2014 12:14:38 PM
G - Halting its slide today after 2 consecutive big losses and closes near the session lows. Near-term support to watch is its 50 DMA line ($1,235).
>>> FEATURED STOCK ARTICLE : Perched At Highs With Volume Totals Cooling - 3/10/2014
View all notes |
Set NEW NOTE alert |
CANSLIM.net Company Profile |
SEC
News |
Chart |
Request a new note
C
A N
S L
I M
|
PSIX
-
NASDAQ
Power Solutions Intl Inc
Machinery-Gen Industrial
|
$75.12
|
-0.55
-0.73% |
$77.06
|
36,895
58.56% of 50 DAV
50 DAV is 63,000
|
$87.40
-14.05%
|
2/28/2014
|
$74.65
|
PP = $76.93
|
|
MB = $80.78
|
Most Recent Note - 3/14/2014 5:41:39 PM
Y - Down for a 4th consecutive loss today, slumping under its pivot point and below prior highs in the $78 area raising concerns. Disciplined investors avoid chasing stocks more than +5% above prior highs and always sell if any stock falls more than -7% from their purchase price.
>>> FEATURED STOCK ARTICLE : Earnings Solid and Forming a Cup-With-Handle - 2/28/2014
View all notes |
Set NEW NOTE alert |
CANSLIM.net Company Profile |
SEC
News |
Chart |
Request a new note
C
A N
S L
I M
|
SILC
-
NASDAQ
Silicom Ltd
COMPUTER HARDWARE - Networking andamp; Communication Dev
|
$68.49
|
+0.55
0.81% |
$68.86
|
30,944
36.84% of 50 DAV
50 DAV is 84,000
|
$73.44
-6.74%
|
12/23/2013
|
$44.62
|
PP = $46.25
|
|
MB = $48.56
|
Most Recent Note - 3/12/2014 5:41:23 PM
G - Posted a gain today on lighter volume after retreating from all-time highs with 4 consecutive losses. Extended from any sound base. Patient investors may watch for a new base or secondary buy point to possibly develop and be noted in the weeks ahead.
>>> FEATURED STOCK ARTICLE : Very Extended From Prior Base After 11 Straight Weekly Gains - 3/6/2014
View all notes |
Set NEW NOTE alert |
CANSLIM.net Company Profile |
SEC
News |
Chart |
Request a new note
C
A N
S L
I M
|
Symbol/Exchange
Company Name
Industry Group |
PRICE |
CHANGE
(%Change) |
Day High |
Volume
(% DAV)
(% 50 day avg vol) |
52 Wk Hi
% From Hi |
Featured
Date |
Price
Featured |
Pivot Featured |
|
Max Buy |
ULTI
-
NASDAQ
Ultimate Software Group
INTERNET - Internet Software and Services
|
$156.66
|
+1.94
1.25% |
$158.39
|
134,126
63.18% of 50 DAV
50 DAV is 212,300
|
$171.96
-8.90%
|
1/27/2014
|
$153.75
|
PP = $162.98
|
|
MB = $171.13
|
Most Recent Note - 3/17/2014 6:47:37 PM
G - Volume was below average behind today's 2nd consecutive small gain. Remains below its 50 DMA line after damaging losses, and only a prompt rebound above that important short-term average would help its outlook improve.
>>> FEATURED STOCK ARTICLE : Near 52--Week High Following Another Volume-Driven Gain - 3/4/2014
View all notes |
Set NEW NOTE alert |
CANSLIM.net Company Profile |
SEC
News |
Chart |
Request a new note
C
A N
S L
I M
|
VRX
-
NYSE
Valeant Pharmaceuticals
DRUGS - Drug Manufacturers - Other
|
$140.90
|
+0.89
0.64% |
$142.20
|
1,251,451
71.51% of 50 DAV
50 DAV is 1,750,000
|
$153.10
-7.97%
|
9/11/2013
|
$100.26
|
PP = $105.50
|
|
MB = $110.78
|
Most Recent Note - 3/17/2014 6:44:14 PM
G - Consolidating just above its 50 DMA line ($137.66) which defines near-term support. A more damaging violation may raise serious concerns and trigger a more worrisome technical sell signal. See the latest FSU analysis for more details and new annotated graphs.
>>> FEATURED STOCK ARTICLE : Finding Support Above 50-Day Moving Average Line - 3/17/2014
View all notes |
Set NEW NOTE alert |
CANSLIM.net Company Profile |
SEC
News |
Chart |
Request a new note
C
A N
S L
I M
|
|
|
|
THESE ARE NOT BUY RECOMMENDATIONS!
Comments contained in the body of this report are technical
opinions only. The material herein has been obtained
from sources believed to be reliable and accurate, however,
its accuracy and completeness cannot be guaranteed.
This site is not an investment advisor, hence it does
not endorse or recommend any securities or other investments.
Any recommendation contained in this report may not
be suitable for all investors and it is not to be deemed
an offer or solicitation on our part with respect to
the purchase or sale of any securities. All trademarks,
service marks and trade names appearing in this report
are the property of their respective owners, and are
likewise used for identification purposes only.
This report is a service available
only to active Paid Premium Members.
You may opt-out of receiving report notifications
at any time. Questions or comments may be submitted
by writing to Premium Membership Services 665 S.E. 10 Street, Suite 201 Deerfield Beach, FL 33441-5634 or by calling 1-800-965-8307
or 954-785-1121.
|
|
|

