You are not logged in.
This means you
CAN ONLY VIEW reports that were published prior to Monday, April 14, 2025.
You
MUST UPGRADE YOUR MEMBERSHIP if you want to see any current reports.
AFTER MARKET UPDATE - FRIDAY, MARCH 18TH, 2011
Previous After Market Report Next After Market Report >>>
|
|
|
|
DOW |
+83.93 |
11,858.52 |
+0.71% |
|
Volume |
1,906,061,960 |
+84% |
|
Volume |
2,502,580,060 |
+29% |
|
NASDAQ |
+7.62 |
2,643.67 |
+0.29% |
|
Advancers |
2,148 |
69% |
|
Advancers |
1,794 |
65% |
|
S&P 500 |
+5.49 |
1,279.21 |
+0.43% |
|
Decliners |
838 |
27% |
|
Decliners |
850 |
31% |
|
Russell 2000 |
+9.14 |
794.66 |
+1.16% |
|
52 Wk Highs |
49 |
|
|
52 Wk Highs |
49 |
|
|
S&P 600 |
+4.91 |
422.06 |
+1.18% |
|
52 Wk Lows |
17 |
|
|
52 Wk Lows |
42 |
|
|
 |
Major Averages Rise With Better Volume and Positive Breadth
Kenneth J. Gruneisen - Passed the CAN SLIM® Master's Exam
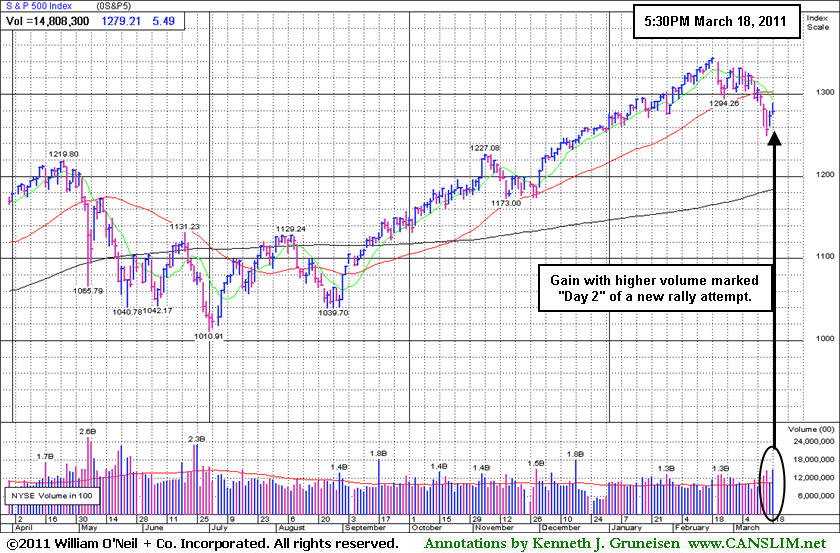
The major averages finished with gains for a second consecutive session on Friday, but the gains were not enough to make up for losses earlier this week. For the week, the Dow was down -1.5%, the S&P 500 Index fell -1.9%, and the Nasdaq Composite Index lost -2.6%. Volume totals were reported higher on the NYSE and on the Nasdaq exchange versus the prior session's totals, which suggested that there was new accumulation of stocks taking place by institutional investors. However, the session marked the quarterly options expirations day known as "quadruple witching" which typically results in higher volume totals on the exchanges. Advancing issues beat decliners by more than 2-1 on both the NYSE and the Nasdaq. New 52-week highs outnumbered new 52-week lows on the Nasdaq exchange and on the NYSE. There were 25 high-ranked companies from the CANSLIM.net Leaders List that made new 52-week highs and appeared on the CANSLIM.net BreakOuts Page, up from a total of 15 on the prior session. On the Featured Stocks Page there were gains from just 7 of the 19 high-ranked market leaders currently listed.
The Nikkei stock average in Japan jumped +2.7% after news that power may be restored to crippled nuclear reactors in the next day or two. At the same time, the Japanese prime minister said the crisis remains "very grave." The world's seven largest industrialized countries backed a plan to bring the Japanese yen down from post-war highs and support recovery efforts. Oil closed lower after Libya declared a ceasefire, but investors remained on edge as United Nations allies made clear they will consider military action unless Moammar Qaddafi pulls back from towns once held by rebels.
Financial stocks are among the leaders after some banks, including JP Morgan Chase & Co (JPM +2.65%), were granted authority by the Federal Reserve to raise dividends and increase share buyback plans. Goldman Sachs Group Inc (GS +2.7%) rallied after announcing it will pay $5.65 billion to redeem preferred stock sold in 2008 to Warren Buffett.
Nike Inc (NKE -9.16%) dove lower after posting profits that were well below analyst forecasts. Cisco Systems Inc (CSCO +0.82%) announced its first-ever quarterly dividend.
More damaging distributional action has the potential to lead to a much more substantial correction for the major averages (bad M criteria). During a correction investors should raise their cash levels and reduce stock market exposure. New buying efforts should be avoided until a new rally with a follow-through day (FTD) provides a fresh confirmation that buying demand from the institutional crowd is returning again. Even after a FTD, marked by an expansion in volume and stocks hitting new highs with higher volume, buying efforts should only be cautiously and carefully made when all of the investment system's key criteria are met.
PICTURED: The S&P 500 Index posted a gain with higher volume while marking Day 2 of a new rally attempt. It is most ideal for a follow-through day of large gains from the major averages on heavier volume between Day 4-7 of a new rally.
|
 Kenneth J. Gruneisen started out as a licensed stockbroker in August 1987, a couple of months prior to the historic stock market crash that took the Dow Jones Industrial Average down -22.6% in a single day. He has published daily fact-based fundamental and technical analysis on high-ranked stocks online for two decades. Through FACTBASEDINVESTING.COM, Kenneth provides educational articles, news, market commentary, and other information regarding proven investment systems that work in good times and bad.
Comments contained in the body of this report are technical opinions only and are not necessarily those of Gruneisen Growth Corp. The material herein has been obtained from sources believed to be reliable and accurate, however, its accuracy and completeness cannot be guaranteed. Our firm, employees, and customers may effect transactions, including transactions contrary to any recommendation herein, or have positions in the securities mentioned herein or options with respect thereto. Any recommendation contained in this report may not be suitable for all investors and it is not to be deemed an offer or solicitation on our part with respect to the purchase or sale of any securities. |
|
 |
Financial Shares Help Underpin New Rally Attempt
Kenneth J. Gruneisen - Passed the CAN SLIM® Master's Exam
Financial shares were among the important positive influences on Friday as the Broker/Dealer Index ($XBD +1.45%) and Bank Index ($BKX +1.05%) posted gains. The Biotechnology Index ($BTK +1.99%) and Healthcare Index ($HMO +0.71%) posted gains, meanwhile mot of the tech sector sputtered as the Semiconductor Index ($SOX +0.29%) finished slightly higher while the Networking Index ($NWX -0.22%) and Internet Index ($IIX -0.06%) inched lower. The Retail Index ($RLX +0.20%) posted a small gain. The Gold & Silver Index ($XAU +1.12%) rallied while energy-related shares edged lower and the Integrated Oil Index ($XOI -0.02%) and Oil Services Index ($OSX -0.37%) fell.
Charts courtesy www.stockcharts.com
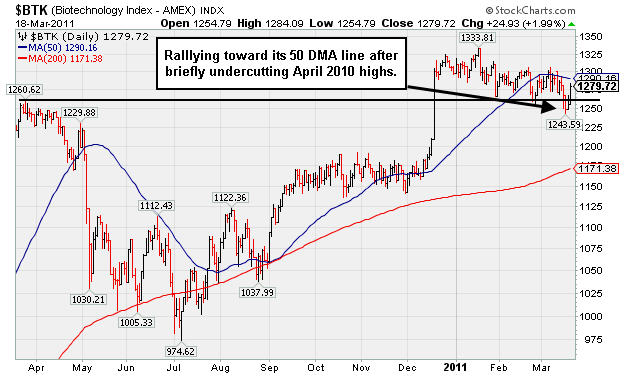
PICTURED: The Biotechnology Index ($BTK +1.99%) is rallying toward its 50-day moving average line after briefly undercutting its April 2010 highs.
| Oil Services |
$OSX |
277.97 |
-1.04 |
-0.37% |
+13.40% |
| Healthcare |
$HMO |
2,025.12 |
+14.31 |
+0.71% |
+19.69% |
| Integrated Oil |
$XOI |
1,310.54 |
-0.33 |
-0.02% |
+8.03% |
| Semiconductor |
$SOX |
419.20 |
+1.23 |
+0.29% |
+1.79% |
| Networking |
$NWX |
311.70 |
-0.68 |
-0.22% |
+11.10% |
| Internet |
$IIX |
302.13 |
-0.17 |
-0.06% |
-1.82% |
| Broker/Dealer |
$XBD |
118.66 |
+1.69 |
+1.45% |
-2.35% |
| Retail |
$RLX |
495.10 |
+0.99 |
+0.20% |
-2.61% |
| Gold & Silver |
$XAU |
204.30 |
+2.26 |
+1.12% |
-9.83% |
| Bank |
$BKX |
52.09 |
+0.54 |
+1.05% |
-0.23% |
| Biotech |
$BTK |
1,279.77 |
+24.98 |
+1.99% |
-1.38% |
|
|
|
 |
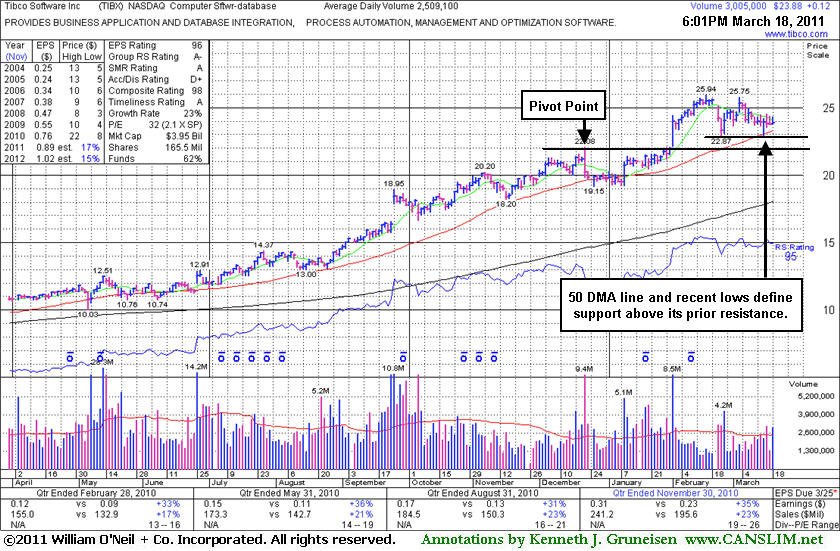
Bullish Base-On-Base Formed After Prior Breakout
Kenneth J. Gruneisen - Passed the CAN SLIM® Master's Exam
Tibco Software Inc (TIBX +$0.12 or +0.51% to $23.88) is consolidating above its 50-day moving average (DMA) line and recent chart lows defining support above its old $22.00 resistance area. More damaging losses would raise concerns and trigger technical sell signals. Since its last appearance in the FSU section on 2/10/11 with an annotated graph under the headline, "Leader Getting More Extended From Latest Base", it endured distributional pressure without breaking down badly. It has formed a bullish base-on-base type pattern and a new pivot point is cited based on its 52-week high plus 10 cents after its new flat base pattern of near minimum length. A subsequent breakout with heavy volume may trigger a new (or add-on) buy signal, however the market (M criteria) also needs to confirm a new rally with a follow-through day before disciplined investors following this fact-based investment system might take action on any buy candidates meeting all key criteria. This a high-ranked Computer Software - Database firm based in Palo Alto, CA has maintained a steady annual earnings (A criteria) history and earnings increases have been impressive in the 4 most recent quarterly comparisons, above the +25% guideline (C criteria). The number of top-rated funds owning its shares rose from 591 in Mar '10 to to 690 in Dec '10, a reassuring sign concerning the I criteria.
|
|
|
Color Codes Explained :
Y - Better candidates highlighted by our
staff of experts.
G - Previously featured
in past reports as yellow but may no longer be buyable under the
guidelines.
***Last / Change / Volume data in this table is the closing quote data***
Symbol/Exchange
Company Name
Industry Group |
PRICE |
CHANGE
(%Change) |
Day High |
Volume
(% DAV)
(% 50 day avg vol) |
52 Wk Hi
% From Hi |
Featured
Date |
Price
Featured |
Pivot Featured |
|
Max Buy |
BIDU
-
NASDAQ
Baidu Inc Ads
INTERNET - Internet Information Providers
|
$120.50
|
-1.14
-0.94% |
$123.30
|
6,053,739
89.11% of 50 DAV
50 DAV is 6,793,800
|
$131.63
-8.46%
|
3/17/2011
|
$121.97
|
PP = $131.73
|
|
MB = $138.32
|
Most Recent Note - 3/17/2011 3:47:26 PM
Y - Color code is changed to yellow with new pivot point cited based on its 52-week high plus 10 cents after consolidating for the past 5 weeks above support at its 50 DMA line. Volume-driven gains above its pivot point and a new rally with follow-through day from at least one of the major averages (M criteria) are necessary first in order to justify new (or add-on) buying efforts under the system's guidelines. Its recent chart low ($112.95 on 2/23/11) is the next important chart support to watch below its short-term average.
>>> The latest Featured Stock Update with an annotated graph appeared on 3/9/2011. Click here.
View all notes |
Alert me of new notes |
CANSLIM.net Company Profile |
SEC |
Zacks Reports |
StockTalk |
News |
Chart |
Request a new note
C
A N
S L
I M


|
CMG
-
NYSE
Chipotle Mexican Grill
LEISURE - Restaurants
|
$246.81
|
-4.85
-1.93% |
$256.02
|
1,065,458
99.90% of 50 DAV
50 DAV is 1,066,500
|
$275.00
-10.25%
|
2/11/2011
|
$271.15
|
PP = $262.87
|
|
MB = $276.01
|
Most Recent Note - 3/17/2011 3:49:40 PM
G - Perched -8% of its all-time high today. Reassuring signs of support have been noted while consolidating above its 50 DMA line and prior highs in the $237 area. Subsequent violations and damaging losses would raise greater concerns and trigger technical sell signals. See the latest FSU analysis for more details and a new annotated graph.
>>> The latest Featured Stock Update with an annotated graph appeared on 3/14/2011. Click here.
View all notes |
Alert me of new notes |
CANSLIM.net Company Profile |
SEC |
Zacks Reports |
StockTalk |
News |
Chart |
Request a new note
C
A N
S L
I M
|
CRUS
-
NASDAQ
Cirrus Logic Inc
ELECTRONICS - Semiconductor - Specialized
|
$19.97
|
-0.48
-2.35% |
$20.91
|
4,137,719
107.15% of 50 DAV
50 DAV is 3,861,700
|
$25.48
-21.62%
|
1/28/2011
|
$20.69
|
PP = $19.17
|
|
MB = $20.13
|
 Most Recent Note - 3/18/2011 4:40:53 PM
Down today, slumping further below its 50 DMA line and below recent lows near $20. Its close below old high closes from July - August 2010 raises more serious concerns. Based on weak action it will be dropped from the Featured Stocks list tonight. A subsequent rebound above its 50 DMA line would help its outlook.
>>> The latest Featured Stock Update with an annotated graph appeared on 3/4/2011. Click here.
View all notes |
Alert me of new notes |
CANSLIM.net Company Profile |
SEC |
Zacks Reports |
StockTalk |
News |
Chart |
Request a new note
C
A N
S L
I M
|
CTSH
-
NASDAQ
Cognizant Tech Sol Cl A
COMPUTER SOFTWARE and SERVICES - Business Software and Services
|
$74.19
|
-0.51
-0.68% |
$75.64
|
3,210,833
136.27% of 50 DAV
50 DAV is 2,356,300
|
$78.69
-5.72%
|
2/7/2011
|
$75.09
|
PP = $76.46
|
|
MB = $80.28
|
Most Recent Note - 3/17/2011 3:42:07 PM
G - Halted its slide today after 3 consecutive losses violated its 50 DMA line and its previously noted chart low ($73.25 on 2/23/11). Color code was changed to green after the damaging technical violations. See the latest FSU analysis for more details and a new annotated graph.
>>> The latest Featured Stock Update with an annotated graph appeared on 3/17/2011. Click here.
View all notes |
Alert me of new notes |
CANSLIM.net Company Profile |
SEC |
Zacks Reports |
StockTalk |
News |
Chart |
Request a new note
C
A N
S L
I M
|
DECK
-
NASDAQ
Deckers Outdoor Corp
CONSUMER NON-DURABLES - Textile - Apparel Footwear
|
$78.79
|
-0.72
-0.91% |
$80.31
|
1,715,294
110.18% of 50 DAV
50 DAV is 1,556,800
|
$94.70
-16.80%
|
2/3/2011
|
$79.61
|
PP = $82.67
|
|
MB = $86.80
|
Most Recent Note - 3/16/2011 7:52:17 PM
G - Down again today with below average volume. Slumping further below its 50 DMA line raises greater concerns and hurts its technical outlook.
>>> The latest Featured Stock Update with an annotated graph appeared on 3/3/2011. Click here.
View all notes |
Alert me of new notes |
CANSLIM.net Company Profile |
SEC |
Zacks Reports |
StockTalk |
News |
Chart |
Request a new note
C
A N
S L
I M
|
Symbol/Exchange
Company Name
Industry Group |
PRICE |
CHANGE
(%Change) |
Day High |
Volume
(% DAV)
(% 50 day avg vol) |
52 Wk Hi
% From Hi |
Featured
Date |
Price
Featured |
Pivot Featured |
|
Max Buy |
EBIX
-
NASDAQ
Ebix Inc
COMPUTER SOFTWARE and SERVICES - Business Software and Services
|
$28.06
|
+0.46
1.67% |
$28.47
|
671,420
110.38% of 50 DAV
50 DAV is 608,300
|
$29.61
-5.23%
|
2/28/2011
|
$25.70
|
PP = $25.97
|
|
MB = $27.27
|
Most Recent Note - 3/15/2011 4:23:30 PM
G - Overcame early weakness today and managed a positive reversal for a gain with above average volume. Wider than usual intra-day swings are a sign of uncertainty while distributional action recently raised concerns. Prior highs in the $25-26 area define important chart support to watch along with its 50 DMA line.
>>> The latest Featured Stock Update with an annotated graph appeared on 2/28/2011. Click here.
View all notes |
Alert me of new notes |
CANSLIM.net Company Profile |
SEC |
Zacks Reports |
StockTalk |
News |
Chart |
Request a new note
C
A N
S L
I M
|
EZPW
-
NASDAQ
Ezcorp Inc Cl A
SPECIALTY RETAIL - Specialty Retail, Other
|
$27.58
|
+0.58
2.15% |
$27.58
|
260,794
70.79% of 50 DAV
50 DAV is 368,400
|
$29.94
-7.88%
|
2/18/2011
|
$27.94
|
PP = $30.04
|
|
MB = $31.54
|
Most Recent Note - 3/18/2011 4:42:28 PM
G - Gain today halted a streak of 6 consecutive losses, but its outlook gets worse the longer it remains below its 50 DMA line. The recent low ($25.56 on 1/25/11) defines the next important support level.
>>> The latest Featured Stock Update with an annotated graph appeared on 3/10/2011. Click here.
View all notes |
Alert me of new notes |
CANSLIM.net Company Profile |
SEC |
Zacks Reports |
StockTalk |
News |
Chart |
Request a new note
C
A N
S L
I M
|
FOSL
-
NASDAQ
Fossil Inc
CONSUMER DURABLES - Recreational Goods, Other
|
$79.52
|
-1.52
-1.88% |
$82.06
|
1,643,556
171.87% of 50 DAV
50 DAV is 956,300
|
$85.20
-6.67%
|
2/1/2011
|
$73.30
|
PP = $74.44
|
|
MB = $78.16
|
Most Recent Note - 3/18/2011 4:46:47 PM
G - Down today with above average volume. It has not formed a sound base. It found support at its 50 DMA line while consolidating above prior resistance in the $74 area.
>>> The latest Featured Stock Update with an annotated graph appeared on 2/24/2011. Click here.
View all notes |
Alert me of new notes |
CANSLIM.net Company Profile |
SEC |
Zacks Reports |
StockTalk |
News |
Chart |
Request a new note
C
A N
S L
I M
|
HMSY
-
NASDAQ
H M S Holdings Corp
COMPUTER SOFTWARE and SERVICES - Healthcare Information Service
|
$77.91
|
-1.10
-1.39% |
$79.33
|
224,758
131.28% of 50 DAV
50 DAV is 171,200
|
$81.36
-4.24%
|
11/19/2010
|
$61.89
|
PP = $63.01
|
|
MB = $66.16
|
Most Recent Note - 3/15/2011 10:20:31 AM
G - Pulling back from its all-time high with today's 4th consecutive loss. It is extended from any sound base pattern. Support to watch is defined by prior chart highs and its 50 DMA line in the $67 area.
>>> The latest Featured Stock Update with an annotated graph appeared on 2/16/2011. Click here.
View all notes |
Alert me of new notes |
CANSLIM.net Company Profile |
SEC |
Zacks Reports |
StockTalk |
News |
Chart |
Request a new note
C
A N
S L
I M
|
LULU
-
NASDAQ
Lululemon Athletica
MANUFACTURING - Textile Manufacturing
|
$75.56
|
-0.81
-1.06% |
$77.89
|
2,818,573
133.40% of 50 DAV
50 DAV is 2,112,800
|
$85.28
-11.40%
|
1/26/2011
|
$68.11
|
PP = $74.70
|
|
MB = $78.44
|
Most Recent Note - 3/17/2011 11:20:45 AM
G - Down today with heavy volume after reporting earnings per share +60% on +53% revenues for the quarter ended January 31, 2011 versus the year ago period. Volume and volatility often increase near earnings news. It is again testing its 50 DMA line, a classic chart support level. As previously noted - "A close below a significant prior high close ($73.51 on 12/21/10) would completely negate its latest breakout, raising more serious concerns."
>>> The latest Featured Stock Update with an annotated graph appeared on 2/25/2011. Click here.
View all notes |
Alert me of new notes |
CANSLIM.net Company Profile |
SEC |
Zacks Reports |
StockTalk |
News |
Chart |
Request a new note
C
A N
S L
I M
|
Symbol/Exchange
Company Name
Industry Group |
PRICE |
CHANGE
(%Change) |
Day High |
Volume
(% DAV)
(% 50 day avg vol) |
52 Wk Hi
% From Hi |
Featured
Date |
Price
Featured |
Pivot Featured |
|
Max Buy |
MG
-
NYSE
Mistras Group Inc
DIVERSIFIED SERVICES - Bulding and Faci;ity Management Services
|
$16.48
|
+0.16
0.98% |
$16.53
|
139,943
142.94% of 50 DAV
50 DAV is 97,900
|
$16.60
-0.72%
|
3/15/2011
|
$15.48
|
PP = $15.90
|
|
MB = $16.70
|
Most Recent Note - 3/18/2011 4:49:18 PM
Y - Up today with above average volume, rising near its "max buy" level. It triggered a technical buy signal after noted in the 3/15/11 mid-day report. The M criteria argues against new buying efforts until a confirmed rally with follow-through day occurs.
>>> The latest Featured Stock Update with an annotated graph appeared on 3/15/2011. Click here.
View all notes |
Alert me of new notes |
CANSLIM.net Company Profile |
SEC |
Zacks Reports |
StockTalk |
News |
Chart |
Request a new note
C
A N
S L
I M
|
MWIV
-
NASDAQ
M W I Veterinary Supply
HEALTH SERVICES - Medical Instruments and; Supplies
|
$76.20
|
+1.57
2.10% |
$76.55
|
83,265
92.52% of 50 DAV
50 DAV is 90,000
|
$78.48
-2.91%
|
11/4/2010
|
$61.79
|
PP = $59.60
|
|
MB = $62.58
|
Most Recent Note - 3/18/2011 4:43:33 PM
G - Today's gain leaves its -2.8% off its all-time high. It is extended from any sound base pattern.
>>> The latest Featured Stock Update with an annotated graph appeared on 3/8/2011. Click here.
View all notes |
Alert me of new notes |
CANSLIM.net Company Profile |
SEC |
Zacks Reports |
StockTalk |
News |
Chart |
Request a new note
C
A N
S L
I M
|
OPEN
-
NASDAQ
Opentable Inc
INTERNET - Internet Software and Services
|
$90.02
|
-0.31
-0.34% |
$91.90
|
764,227
66.52% of 50 DAV
50 DAV is 1,148,900
|
$95.97
-6.20%
|
3/17/2011
|
$90.71
|
PP = $96.07
|
|
MB = $100.87
|
Most Recent Note - 3/17/2011 11:31:02 AM
Y - Color code is changed to yellow after it has formed a sound new flat base pattern of sufficient length. Volume-driven gains above the new pivot point cited and a confirmed rally with follow-through day may eventually justify new (or add-on) buying efforts under the investment system guidelines. Important support to watch in the meanwhile is at its 50 DMA line and prior chart highs.
>>> The latest Featured Stock Update with an annotated graph appeared on 2/15/2011. Click here.
View all notes |
Alert me of new notes |
CANSLIM.net Company Profile |
SEC |
Zacks Reports |
StockTalk |
News |
Chart |
Request a new note
C
A N
S L
I M
|
PAY
-
NYSE
Verifone Systems Inc
COMPUTER HARDWARE - Transaction Automation Systems
|
$50.80
|
-1.59
-3.03% |
$53.70
|
1,893,821
99.29% of 50 DAV
50 DAV is 1,907,400
|
$53.85
-5.66%
|
1/27/2011
|
$41.77
|
PP = $44.97
|
|
MB = $47.22
|
Most Recent Note - 3/18/2011 4:36:31 PM
G - Pulled back on average volume today from its all-time high hit this week with 3 consecutive volume-driven gains. Repeatedly noted - "No resistance remains due to overhead supply, but it is extended from a sound base pattern. Its 50 DMA line defines chart support to watch."
>>> The latest Featured Stock Update with an annotated graph appeared on 3/2/2011. Click here.
View all notes |
Alert me of new notes |
CANSLIM.net Company Profile |
SEC |
Zacks Reports |
StockTalk |
News |
Chart |
Request a new note
C
A N
S L
I M
|
PCLN
-
NASDAQ
Priceline.Com Inc
INTERNET - Internet Software and Services
|
$449.54
|
-2.65
-0.59% |
$457.79
|
1,352,422
114.85% of 50 DAV
50 DAV is 1,177,600
|
$474.74
-5.31%
|
1/3/2011
|
$399.55
|
PP = $428.20
|
|
MB = $449.61
|
Most Recent Note - 3/15/2011 10:25:27 AM
G - Consolidating above support at its 50 DMA line, stubbornly holding its ground just -4.5% off its 52-week high. It has not built a sound base pattern recently.
>>> The latest Featured Stock Update with an annotated graph appeared on 2/14/2011. Click here.
View all notes |
Alert me of new notes |
CANSLIM.net Company Profile |
SEC |
Zacks Reports |
StockTalk |
News |
Chart |
Request a new note
C
A N
S L
I M
|
Symbol/Exchange
Company Name
Industry Group |
PRICE |
CHANGE
(%Change) |
Day High |
Volume
(% DAV)
(% 50 day avg vol) |
52 Wk Hi
% From Hi |
Featured
Date |
Price
Featured |
Pivot Featured |
|
Max Buy |
RAX
-
NYSE
Rackspace Hosting Inc
INTERNET - Internet Software and; Services
|
$36.60
|
+0.19
0.52% |
$37.47
|
1,611,292
86.29% of 50 DAV
50 DAV is 1,867,300
|
$40.62
-9.90%
|
3/16/2011
|
$36.28
|
PP = $40.72
|
|
MB = $42.76
|
Most Recent Note - 3/17/2011 11:33:10 AM
Y - Up today after testing prior highs near $35 and its 50 DMA line defining chart support to watch. Color code was changed to yellow with new pivot point cited after a new 5-week flat base pattern was identified. However, the negative market environment (M criteria) is an overriding concern for now arguing against new buying efforts until a rally with follow-through day occurs. See the latest FSU analysis for more details and a new annotated graph.
>>> The latest Featured Stock Update with an annotated graph appeared on 3/16/2011. Click here.
View all notes |
Alert me of new notes |
CANSLIM.net Company Profile |
SEC |
Zacks Reports |
StockTalk |
News |
Chart |
Request a new note
C
A N
S L
I M
|
TIBX
-
NASDAQ
Tibco Software Inc
COMPUTER SOFTWARE and SERVICES - Business Software and Services
|
$23.88
|
+0.12
0.51% |
$24.30
|
3,656,588
145.73% of 50 DAV
50 DAV is 2,509,100
|
$25.94
-7.94%
|
3/18/2011
|
$23.88
|
PP = $26.04
|
|
MB = $27.34
|
Most Recent Note - 3/18/2011 6:17:13 PM
Y - Color code is changed to yellow with new pivot point cited based on its 52-week high plus ten cents. Currently consolidating above support at its 50 DMA line and recent chart lows defining support above its old resistance area. More damaging losses would raise concerns and trigger more worrisome technical sell signals. See the latest FSU analysis for more details and a new annotated graph.
>>> The latest Featured Stock Update with an annotated graph appeared on 3/18/2011. Click here.
View all notes |
Alert me of new notes |
CANSLIM.net Company Profile |
SEC |
Zacks Reports |
StockTalk |
News |
Chart |
Request a new note
C
A N
S L
I M
|
UA
-
NYSE
Under Armour Inc Cl A
CONSUMER NON-DURABLES - Textile - Apparel Clothing
|
$63.31
|
-3.77
-5.62% |
$66.04
|
1,930,379
252.77% of 50 DAV
50 DAV is 763,700
|
$70.69
-10.44%
|
1/27/2011
|
$58.31
|
PP = $56.99
|
|
MB = $59.84
|
Most Recent Note - 3/18/2011 12:06:24 PM
G -Gapped down today, slumping near its 50 DMA line and recent lows defining important chart support. It may be forming a base-on-base pattern, but more damaging losses would hurt its outlook.
>>> The latest Featured Stock Update with an annotated graph appeared on 3/7/2011. Click here.
View all notes |
Alert me of new notes |
CANSLIM.net Company Profile |
SEC |
Zacks Reports |
StockTalk |
News |
Chart |
Request a new note
C
A N
S L
I M
|
ULTA
-
NASDAQ
Ulta Salon Cosm & Frag
SPECIALTY RETAIL - Specialty Retail, Other
|
$46.77
|
+0.35
0.75% |
$47.53
|
1,842,527
299.31% of 50 DAV
50 DAV is 615,600
|
$47.93
-2.42%
|
1/6/2011
|
$36.12
|
PP = $37.34
|
|
MB = $39.21
|
Most Recent Note - 3/18/2011 4:45:15 PM
G - Perched at its all-time high, holding its ground after a spurt of volume-driven gains. Support to watch is at its 50 DMA line and recent chart lows near the $40 level.
>>> The latest Featured Stock Update with an annotated graph appeared on 2/17/2011. Click here.
View all notes |
Alert me of new notes |
CANSLIM.net Company Profile |
SEC |
Zacks Reports |
StockTalk |
News |
Chart |
Request a new note
C
A N
S L
I M
|
|
|
|
THESE ARE NOT BUY RECOMMENDATIONS!
Comments contained in the body of this report are technical
opinions only. The material herein has been obtained
from sources believed to be reliable and accurate, however,
its accuracy and completeness cannot be guaranteed.
This site is not an investment advisor, hence it does
not endorse or recommend any securities or other investments.
Any recommendation contained in this report may not
be suitable for all investors and it is not to be deemed
an offer or solicitation on our part with respect to
the purchase or sale of any securities. All trademarks,
service marks and trade names appearing in this report
are the property of their respective owners, and are
likewise used for identification purposes only.
This report is a service available
only to active Paid Premium Members.
You may opt-out of receiving report notifications
at any time. Questions or comments may be submitted
by writing to Premium Membership Services 665 S.E. 10 Street, Suite 201 Deerfield Beach, FL 33441-5634 or by calling 1-800-965-8307
or 954-785-1121.
|
|
|

