***Last / Change / Volume data in this table is the closing quote data***
Symbol/Exchange
Company Name
Industry Group |
PRICE |
CHANGE
(%Change) |
Day High |
Volume
(% DAV)
(% 50 day avg vol) |
52 Wk Hi
% From Hi |
Featured
Date |
Price
Featured |
Pivot Featured |
|
Max Buy |
ADS
-
NYSE
Alliance Data Sys Corp
COMPUTER SOFTWARE and SERVICES - Information and Delivery Service
|
$124.87
|
-1.43
-1.13% |
$126.56
|
596,099
85.01% of 50 DAV
50 DAV is 701,200
|
$126.30
-1.13%
|
1/17/2012
|
$108.24
|
PP = $107.43
|
|
MB = $112.80
|
Most Recent Note - 3/15/2012 9:36:08 PM
G - Up today with average volume for another new all-time high. Fundamental concerns were raised by earnings reported +9%, well below the +25% minimum guideline in the latest quarter ended December 31, 2011.
>>> The latest Featured Stock Update with an annotated graph appeared on 2/29/2012. Click here.
View all notes |
Alert me of new notes |
CANSLIM.net Company Profile |
SEC |
Zacks Reports |
StockTalk |
News |
Chart |
Request a new note
C
A N
S L
I M


|
ALLT
-
NASDAQ
Allot Communications Ltd
COMPUTER SOFTWARE andamp; SERVICES - Technical andamp; System Software
|
$20.82
|
-0.29
-1.37% |
$21.25
|
388,617
114.57% of 50 DAV
50 DAV is 339,200
|
$21.21
-1.84%
|
3/13/2012
|
$19.72
|
PP = $18.91
|
|
MB = $19.86
|
Most Recent Note - 3/15/2012 9:37:21 PM
G - Hit another new 52-week high today with a 3rd consecutive gain, getting more extended from its prior base. A considerable gain on more than 7 times average volume cleared an orderly 13-week base and triggered a technical buy signal as it was featured in yellow in the 3/13/12 mid-day report (read here) with pivot point cited based on its 2/23/12 high plus 10 cents.Completed a new Public Offering on 11/09/11. It has attracted increasing interest from top-rated funds (I criteria). Quarterly comparisons have shown strong sales revenues and earnings increases satisfying the C criteria. This Israeli Computer - Networking firm showed good annual earnings increases in FY '10 & '11 after losses in prior years. No overhead supply remains to act as resistance.

There are no Featured Stock Updates™ available for this stock at this time. You may request one by clicking the Request a New Note link below
View all notes |
Alert me of new notes |
CANSLIM.net Company Profile |
SEC |
Zacks Reports |
StockTalk |
News |
Chart |
Request a new note
C
A N
S L
I M
|
ALXN
-
NASDAQ
Alexion Pharmaceuticals
DRUGS - Drug Manufacturers - Other
|
$89.01
|
-0.51
-0.57% |
$89.54
|
1,607,772
129.36% of 50 DAV
50 DAV is 1,242,900
|
$89.85
-0.93%
|
3/12/2012
|
$87.87
|
PP = $87.73
|
|
MB = $92.12
|
Most Recent Note - 3/12/2012 4:43:50 PM
Y - Hit a new all-time high with today's volume-driven gain. Color code is changed to yellow with new pivot point cited based on its 2/23/12 high. Its gain cleared an advanced "3-weeks tight" base, albeit a risker late-stage breakout, technically triggering a new (or add-on) buy signal. Support to watch on pullbacks is its 50 DMA line.
>>> The latest Featured Stock Update with an annotated graph appeared on 2/24/2012. Click here.
View all notes |
Alert me of new notes |
CANSLIM.net Company Profile |
SEC |
Zacks Reports |
StockTalk |
News |
Chart |
Request a new note
C
A N
S L
I M
|
BODY
-
NASDAQ
Body Central Corp
RETAIL - Catalog andamp; Mail Order Houses
|
$26.76
|
-0.27
-1.00% |
$27.04
|
208,530
99.49% of 50 DAV
50 DAV is 209,600
|
$29.49
-9.26%
|
1/27/2012
|
$26.69
|
PP = $25.46
|
|
MB = $26.73
|
Most Recent Note - 3/12/2012 4:53:55 PM
G - Reported earnings +52% on +20% sales revenues for the quarter ended December 31, 2011 versus the year ago period. Posted a gain today with below average volume. Found prompt support near its 50 DMA line and prior highs in the $26 area after a damaging 3/09/11 gap down and considerable volume-driven loss violated the previously noted upward trendline connecting its Nov-Feb lows.
>>> The latest Featured Stock Update with an annotated graph appeared on 3/13/2012. Click here.
View all notes |
Alert me of new notes |
CANSLIM.net Company Profile |
SEC |
Zacks Reports |
StockTalk |
News |
Chart |
Request a new note
C
A N
S L
I M
|
CATM
-
NASDAQ
Cardtronics Inc
DIVERSIFIED SERVICES - Business/Management Services
|
$26.94
|
-0.08
-0.30% |
$27.18
|
345,052
86.16% of 50 DAV
50 DAV is 400,500
|
$28.74
-6.26%
|
2/24/2012
|
$27.94
|
PP = $28.30
|
|
MB = $29.72
|
Most Recent Note - 3/12/2012 4:54:40 PM
Y - Pulled back today for a 5th consecutive small loss on below average volume while staying perched near its pivot point cited, not yet triggering a technical buy signal. Disciplined investors resist the urge to get in early while confirming gains are still needed.
>>> The latest Featured Stock Update with an annotated graph appeared on 1/30/2012. Click here.
View all notes |
Alert me of new notes |
CANSLIM.net Company Profile |
SEC |
Zacks Reports |
StockTalk |
News |
Chart |
Request a new note
C
A N
S L
I M
|
Symbol/Exchange
Company Name
Industry Group |
PRICE |
CHANGE
(%Change) |
Day High |
Volume
(% DAV)
(% 50 day avg vol) |
52 Wk Hi
% From Hi |
Featured
Date |
Price
Featured |
Pivot Featured |
|
Max Buy |
CDNS
-
NASDAQ
Cadence Design Systems
COMPUTER SOFTWARE and SERVICES - Technical and System Software
|
$12.33
|
-0.07
-0.56% |
$12.44
|
3,060,082
90.89% of 50 DAV
50 DAV is 3,366,700
|
$12.41
-0.64%
|
2/3/2012
|
$11.66
|
PP = $11.15
|
|
MB = $11.71
|
Most Recent Note - 3/15/2012 9:30:39 PM
G - Hit a new 52-week high today with a solid gain on above average volume. Color code is changed to green as it is getting extended from the most ideal range for accumulating shares under the fact based system following an earlier technical breakout.
>>> The latest Featured Stock Update with an annotated graph appeared on 2/3/2012. Click here.
View all notes |
Alert me of new notes |
CANSLIM.net Company Profile |
SEC |
Zacks Reports |
StockTalk |
News |
Chart |
Request a new note
C
A N
S L
I M
|
CELG
-
NASDAQ
Celgene Corp
DRUGS - Drug Manufacturers - Major
|
$75.60
|
-0.53
-0.70% |
$76.83
|
3,781,169
118.96% of 50 DAV
50 DAV is 3,178,400
|
$77.43
-2.36%
|
2/2/2012
|
$74.16
|
PP = $75.21
|
|
MB = $78.97
|
 Most Recent Note - 3/16/2012 11:41:06 AM
Y - Perched near its 52-week high today, rising from a test of support at its 50 DMA line last week. Currently perched within striking distance of its all-time high ($77.39 in Aug '08). Any subsequent volume-driven gains would be a reassuring sign of fresh institutional demand.
>>> The latest Featured Stock Update with an annotated graph appeared on 2/2/2012. Click here.
View all notes |
Alert me of new notes |
CANSLIM.net Company Profile |
SEC |
Zacks Reports |
StockTalk |
News |
Chart |
Request a new note
C
A N
S L
I M
|
COO
-
NYSE
Cooper Companies Inc
HEALTH SERVICES - Medical Instruments and Supplies
|
$80.78
|
-0.05
-0.06% |
$80.98
|
322,720
79.14% of 50 DAV
50 DAV is 407,800
|
$84.20
-4.06%
|
3/9/2012
|
$83.05
|
PP = $81.02
|
|
MB = $85.07
|
Most Recent Note - 3/13/2012 10:48:38 PM
Y - Gain on average volume today, remaining under the pivot point. The 3/09/12 gain with 4 times average volume triggered a technical buy signal as it rose from a near 6-month cup-with-handle base pattern.
>>> The latest Featured Stock Update with an annotated graph appeared on 3/9/2012. Click here.
View all notes |
Alert me of new notes |
CANSLIM.net Company Profile |
SEC |
Zacks Reports |
StockTalk |
News |
Chart |
Request a new note
C
A N
S L
I M
|
DISH
-
NASDAQ
Dish Network Corp Cl A
CONSUMER DURABLES - Electronic Equipment
|
$31.51
|
-0.32
-1.01% |
$31.91
|
1,978,843
75.92% of 50 DAV
50 DAV is 2,606,500
|
$32.57
-3.24%
|
3/7/2012
|
$30.83
|
PP = $30.10
|
|
MB = $31.61
|
Most Recent Note - 3/14/2012 10:20:21 PM
Y - Light volume loss today. It remains within 5% of its pivot point, not too extended from its latest base. Prior highs in the $30 area define initial support to watch on pullbacks. See the latest FSU analysis for more details and a new annotated weekly graph.
>>> The latest Featured Stock Update with an annotated graph appeared on 3/14/2012. Click here.
View all notes |
Alert me of new notes |
CANSLIM.net Company Profile |
SEC |
Zacks Reports |
StockTalk |
News |
Chart |
Request a new note
C
A N
S L
I M
|
ECHO
-
NASDAQ
Echo Global Logistics
DIVERSIFIED SERVICES - Business/Management Services
|
$18.27
|
-0.14
-0.76% |
$18.50
|
89,672
113.22% of 50 DAV
50 DAV is 79,200
|
$19.38
-5.73%
|
2/22/2012
|
$18.50
|
PP = $18.63
|
|
MB = $19.56
|
Most Recent Note - 3/15/2012 9:25:25 PM
Y - Rallied from support at its 50 DMA line with a solid gain today on higher volume, finishing near the session high yet still below its previously cited pivot point.
>>> The latest Featured Stock Update with an annotated graph appeared on 2/23/2012. Click here.
View all notes |
Alert me of new notes |
CANSLIM.net Company Profile |
SEC |
Zacks Reports |
StockTalk |
News |
Chart |
Request a new note
C
A N
S L
I M
|
Symbol/Exchange
Company Name
Industry Group |
PRICE |
CHANGE
(%Change) |
Day High |
Volume
(% DAV)
(% 50 day avg vol) |
52 Wk Hi
% From Hi |
Featured
Date |
Price
Featured |
Pivot Featured |
|
Max Buy |
FEIC
-
NASDAQ
F E I Co
ELECTRONICS - Diversified Electronics
|
$45.88
|
-0.43
-0.93% |
$46.44
|
307,815
95.68% of 50 DAV
50 DAV is 321,700
|
$48.31
-5.03%
|
12/7/2011
|
$41.41
|
PP = $42.35
|
|
MB = $44.47
|
Most Recent Note - 3/15/2012 12:51:21 PM
G - Gain today has it poised for its best-ever close. No resistance remains due to overhead supply, however the latest quarterly report showed +21% earnings for the Dec '11 quarter, below the +25% minimum guideline for earnings growth.
>>> The latest Featured Stock Update with an annotated graph appeared on 3/12/2012. Click here.
View all notes |
Alert me of new notes |
CANSLIM.net Company Profile |
SEC |
Zacks Reports |
StockTalk |
News |
Chart |
Request a new note
C
A N
S L
I M
|
GNC
-
NYSE
G N C Holdings Inc
RETAIL - Drug Stores
|
$33.71
|
+0.42
1.26% |
$33.76
|
1,699,946
123.38% of 50 DAV
50 DAV is 1,377,800
|
$34.71
-2.88%
|
1/19/2012
|
$28.99
|
PP = $29.60
|
|
MB = $31.08
|
Most Recent Note - 3/14/2012 11:46:47 AM
G - Pulling back today following a considerable gap up gain on the prior session after raising guidance based on stronger same store sales than previously expected. Hit a new all-time high following a brief consolidation above prior highs in the $29.50 area and its 50 DMA line defining near-term support to watch.
>>> The latest Featured Stock Update with an annotated graph appeared on 3/5/2012. Click here.
View all notes |
Alert me of new notes |
CANSLIM.net Company Profile |
SEC |
Zacks Reports |
StockTalk |
News |
Chart |
Request a new note
C
A N
S L
I M
|
HLF
-
NYSE
Herbalife Ltd
DRUGS - Nutrition and Weight Management
|
$70.58
|
-0.17
-0.24% |
$70.77
|
1,100,257
82.34% of 50 DAV
50 DAV is 1,336,300
|
$71.41
-1.16%
|
2/22/2012
|
$65.90
|
PP = $63.50
|
|
MB = $66.68
|
Most Recent Note - 3/12/2012 5:40:23 PM
G - Holding its ground after rallying above its "max buy" level and getting extended from its prior base pattern. Prior highs in the $63 area define support to watch on pullbacks.
>>> The latest Featured Stock Update with an annotated graph appeared on 2/22/2012. Click here.
View all notes |
Alert me of new notes |
CANSLIM.net Company Profile |
SEC |
Zacks Reports |
StockTalk |
News |
Chart |
Request a new note
C
A N
S L
I M
|
ISRG
-
NASDAQ
Intuitive Surgical Inc
HEALTH SERVICES - Medical Appliances and Equipment
|
$529.74
|
+1.54
0.29% |
$531.11
|
388,111
106.77% of 50 DAV
50 DAV is 363,500
|
$533.00
-0.61%
|
12/20/2011
|
$442.43
|
PP = $449.16
|
|
MB = $471.62
|
Most Recent Note - 3/12/2012 5:42:22 PM
G - Today's gain helped it wedge up to another new all-time high without great volume conviction. Stubbornly held its ground while consolidating in a very tight trading range near its highs in recent weeks. December '11 quarterly earnings increased by just below the borderline +25% minimum guideline for ideal buy candidates.
>>> The latest Featured Stock Update with an annotated graph appeared on 3/1/2012. Click here.
View all notes |
Alert me of new notes |
CANSLIM.net Company Profile |
SEC |
Zacks Reports |
StockTalk |
News |
Chart |
Request a new note
C
A N
S L
I M
|
LULU
-
NASDAQ
Lululemon Athletica
MANUFACTURING - Textile Manufacturing
|
$72.04
|
-2.20
-2.96% |
$74.50
|
2,796,474
116.06% of 50 DAV
50 DAV is 2,409,600
|
$74.36
-3.12%
|
1/10/2012
|
$60.97
|
PP = $59.46
|
|
MB = $62.43
|
Most Recent Note - 3/16/2012 5:52:06 PM
G - Touched a new all-time high today then reversed for a loss with slightly higher volume. It is extended from any sound base. Prior highs in the $61-64 area and its 50 DMA line define chart support to watch on pullbacks.
>>> The latest Featured Stock Update with an annotated graph appeared on 2/21/2012. Click here.
View all notes |
Alert me of new notes |
CANSLIM.net Company Profile |
SEC |
Zacks Reports |
StockTalk |
News |
Chart |
Request a new note
C
A N
S L
I M
|
Symbol/Exchange
Company Name
Industry Group |
PRICE |
CHANGE
(%Change) |
Day High |
Volume
(% DAV)
(% 50 day avg vol) |
52 Wk Hi
% From Hi |
Featured
Date |
Price
Featured |
Pivot Featured |
|
Max Buy |
MA
-
NYSE
Mastercard Inc Cl A
DIVERSIFIED SERVICES - Business/Management Services
|
$420.17
|
+0.62
0.15% |
$421.37
|
759,645
69.12% of 50 DAV
50 DAV is 1,099,100
|
$428.57
-1.96%
|
3/12/2012
|
$419.86
|
PP = $428.67
|
|
MB = $450.10
|
Most Recent Note - 3/16/2012 5:53:46 PM
Y - Still quietly hovering near its all-time high. After forming an advanced "3-weeks tight" base a new pivot point was cited based on its 2/29/12 high plus 10 cents while its color code was changed to yellow. Volume-driven gains may trigger a new (or add-on) technical buy signal, meanwhile its prior highs in the $381-384 area define support to watch on pullbacks along with its 50 DMA line.
>>> The latest Featured Stock Update with an annotated graph appeared on 2/17/2012. Click here.
View all notes |
Alert me of new notes |
CANSLIM.net Company Profile |
SEC |
Zacks Reports |
StockTalk |
News |
Chart |
Request a new note
C
A N
S L
I M
|
MELI
-
NASDAQ
Mercadolibre Inc
INTERNET - Internet Software and; Services
|
$97.72
|
+0.10
0.10% |
$98.48
|
210,418
40.03% of 50 DAV
50 DAV is 525,600
|
$104.50
-6.49%
|
2/6/2012
|
$97.09
|
PP = $95.58
|
|
MB = $100.36
|
Most Recent Note - 3/15/2012 9:39:36 PM
Y - Quietly consolidating, staying above its 50 DMA line and above the recent low ($91.38 on 3/06/12) defining important support areas to watch.
>>> The latest Featured Stock Update with an annotated graph appeared on 2/6/2012. Click here.
View all notes |
Alert me of new notes |
CANSLIM.net Company Profile |
SEC |
Zacks Reports |
StockTalk |
News |
Chart |
Request a new note
C
A N
S L
I M
|
MKTX
-
NASDAQ
Marketaxess Holdings Inc
FINANCIAL SERVICES - Investment Brokerage - Nationa
|
$35.94
|
+0.74
2.10% |
$36.13
|
445,610
177.60% of 50 DAV
50 DAV is 250,900
|
$37.06
-3.02%
|
3/8/2012
|
$35.80
|
PP = $35.52
|
|
MB = $37.30
|
Most Recent Note - 3/16/2012 6:03:36 PM
Y - Up today with +77% above average volume while rallying above its pivot point for its second-best close ever. The solid volume-driven gain helped clinch a technical buy signal.
>>> The latest Featured Stock Update with an annotated graph appeared on 3/8/2012. Click here.
View all notes |
Alert me of new notes |
CANSLIM.net Company Profile |
SEC |
Zacks Reports |
StockTalk |
News |
Chart |
Request a new note
C
A N
S L
I M
|
RAX
-
NYSE
Rackspace Hosting Inc
INTERNET - Internet Software and; Services
|
$56.42
|
-0.13
-0.23% |
$57.22
|
1,825,323
87.96% of 50 DAV
50 DAV is 2,075,100
|
$56.94
-0.91%
|
2/2/2012
|
$46.69
|
PP = $45.55
|
|
MB = $47.83
|
Most Recent Note - 3/15/2012 12:57:20 PM
G - Challenging its 52-week high with today's gain and no resistance remains due to overhead supply. Its recent consolidation is a little short of the 5-week minimum length for it to be considered a new flat base pattern. Recently found support well above its 50 DMA line and prior highs in the $46 area that define important near-term support to watch.
>>> The latest Featured Stock Update with an annotated graph appeared on 2/16/2012. Click here.
View all notes |
Alert me of new notes |
CANSLIM.net Company Profile |
SEC |
Zacks Reports |
StockTalk |
News |
Chart |
Request a new note
C
A N
S L
I M
|
RRTS
-
NYSE
Roadrunner Trans Systems
TRANSPORTATION - Air Delivery and Freight Service
|
$18.20
|
-0.08
-0.44% |
$18.59
|
289,831
203.53% of 50 DAV
50 DAV is 142,400
|
$18.44
-1.30%
|
2/10/2012
|
$17.40
|
PP = $17.50
|
|
MB = $18.38
|
Most Recent Note - 3/16/2012 12:16:40 PM
Y - Reversed into the red after an early gain today touched a new high and it briefly traded above its "max buy" level. Prior highs in the $17 area define initial support to watch on pullbacks.
>>> The latest Featured Stock Update with an annotated graph appeared on 2/13/2012. Click here.
View all notes |
Alert me of new notes |
CANSLIM.net Company Profile |
SEC |
Zacks Reports |
StockTalk |
News |
Chart |
Request a new note
C
A N
S L
I M
|
Symbol/Exchange
Company Name
Industry Group |
PRICE |
CHANGE
(%Change) |
Day High |
Volume
(% DAV)
(% 50 day avg vol) |
52 Wk Hi
% From Hi |
Featured
Date |
Price
Featured |
Pivot Featured |
|
Max Buy |
SHFL
-
NASDAQ
Shuffle Master Inc
MANUFACTURING - Diversified Machinery
|
$17.83
|
+0.60
3.48% |
$17.84
|
1,152,691
207.54% of 50 DAV
50 DAV is 555,400
|
$17.49
1.94%
|
3/6/2012
|
$17.07
|
PP = $15.25
|
|
MB = $16.01
|
Most Recent Note - 3/16/2012 6:06:57 PM
G - Up today with 2 times average volume for a new 52-week high. It is extended from any sound base pattern. Its 50 DMA line defines support to watch on pullbacks.
>>> The latest Featured Stock Update with an annotated graph appeared on 3/15/2012. Click here.
View all notes |
Alert me of new notes |
CANSLIM.net Company Profile |
SEC |
Zacks Reports |
StockTalk |
News |
Chart |
Request a new note
C
A N
S L
I M
|
SWI
-
NYSE
Solarwinds Inc
COMPUTER SOFTWARE and SERVICES - Application Software
|
$38.00
|
-0.85
-2.19% |
$38.93
|
740,986
63.78% of 50 DAV
50 DAV is 1,161,800
|
$39.75
-4.40%
|
1/26/2012
|
$32.36
|
PP = $33.78
|
|
MB = $35.47
|
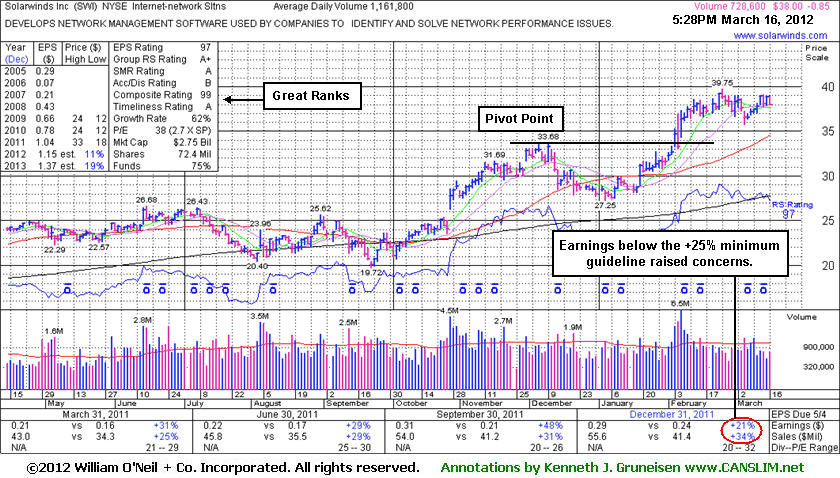
Most Recent Note - 3/16/2012 6:13:21 PM
G - Pulled back today with light volume, finishing -4.4% off its all-time high. Earnings below the +25% guideline for the Dec '11 quarter raised fundamental concerns. See the latest FSU analysis for more details and a new annotated graph.
>>> The latest Featured Stock Update with an annotated graph appeared on 3/16/2012. Click here.
View all notes |
Alert me of new notes |
CANSLIM.net Company Profile |
SEC |
Zacks Reports |
StockTalk |
News |
Chart |
Request a new note
C
A N
S L
I M
|
SXCI
-
NASDAQ
S X C Health Solutions
COMPUTER SOFTWARE and SERVICES - Healthcare Information Service
|
$72.00
|
-1.14
-1.56% |
$72.53
|
391,492
94.84% of 50 DAV
50 DAV is 412,800
|
$76.42
-5.78%
|
2/23/2012
|
$68.24
|
PP = $66.05
|
|
MB = $69.35
|
Most Recent Note - 3/12/2012 6:16:09 PM
G - Held its ground today near its all-time high hit on the prior session. Prior highs in the $66 area define support to watch on pullbacks.
>>> The latest Featured Stock Update with an annotated graph appeared on 3/6/2012. Click here.
View all notes |
Alert me of new notes |
CANSLIM.net Company Profile |
SEC |
Zacks Reports |
StockTalk |
News |
Chart |
Request a new note
C
A N
S L
I M
|
TDG
-
NYSE
Transdigm Group Inc
AEROSPACE/DEFENSE - Aerospace/Defense Products and; Services
|
$115.32
|
+0.02
0.02% |
$115.57
|
410,620
103.98% of 50 DAV
50 DAV is 394,900
|
$121.48
-5.07%
|
2/29/2012
|
$120.10
|
PP = $118.93
|
|
MB = $124.88
|
Most Recent Note - 3/12/2012 6:18:17 PM
Y - Holding its ground since its 3/06/12 gap down, sputtering below its latest pivot point after encountering distributional pressure. Its 50 DMA line defines important chart support to watch above prior highs in the $102 area.
>>> The latest Featured Stock Update with an annotated graph appeared on 2/10/2012. Click here.
View all notes |
Alert me of new notes |
CANSLIM.net Company Profile |
SEC |
Zacks Reports |
StockTalk |
News |
Chart |
Request a new note
C
A N
S L
I M
|
TNGO
-
NASDAQ
Tangoe Inc
COMPUTER SOFTWARE and SERVICES - Technical and System Software
|
$18.00
|
+0.12
0.67% |
$18.36
|
427,332
123.76% of 50 DAV
50 DAV is 345,300
|
$19.90
-9.55%
|
2/13/2012
|
$15.39
|
PP = $16.51
|
|
MB = $17.34
|
Most Recent Note - 3/13/2012 9:51:55 AM
G - Gapped down today, slumping near its "max buy" level. Prior highs in the $16 area and its 50 DMA line coincide and define important chart support to watch while consolidating.
>>> The latest Featured Stock Update with an annotated graph appeared on 2/14/2012. Click here.
View all notes |
Alert me of new notes |
CANSLIM.net Company Profile |
SEC |
Zacks Reports |
StockTalk |
News |
Chart |
Request a new note
C
A N
S L
I M
|
Symbol/Exchange
Company Name
Industry Group |
PRICE |
CHANGE
(%Change) |
Day High |
Volume
(% DAV)
(% 50 day avg vol) |
52 Wk Hi
% From Hi |
Featured
Date |
Price
Featured |
Pivot Featured |
|
Max Buy |
TSCO
-
NASDAQ
Tractor Supply Co
SPECIALTY RETAIL - Specialty Retail, Other
|
$85.81
|
-1.47
-1.68% |
$87.50
|
678,001
94.21% of 50 DAV
50 DAV is 719,700
|
$88.65
-3.20%
|
1/12/2012
|
$79.12
|
PP = $75.58
|
|
MB = $79.36
|
Most Recent Note - 3/16/2012 5:56:51 PM
G - Pulled back today for a loss on higher (near average) volume. Its 50 DMA line defines support to watch on pullbacks.
>>> The latest Featured Stock Update with an annotated graph appeared on 2/27/2012. Click here.
View all notes |
Alert me of new notes |
CANSLIM.net Company Profile |
SEC |
Zacks Reports |
StockTalk |
News |
Chart |
Request a new note
C
A N
S L
I M
|
UA
-
NYSE
Under Armour Inc Cl A
CONSUMER NON-DURABLES - Textile - Apparel Clothing
|
$94.31
|
-1.72
-1.79% |
$96.33
|
1,155,747
88.38% of 50 DAV
50 DAV is 1,307,700
|
$99.10
-4.83%
|
2/15/2012
|
$85.77
|
PP = $84.86
|
|
MB = $89.10
|
Most Recent Note - 3/16/2012 5:58:08 PM
G - Pulled back today for a 3rd consecutive loss today. Recent gains above its pivot point did not have volume sufficient to trigger a proper technical buy signal. Pyramiding into a position can help investors avoid chasing stocks too far above their pivot point.
>>> The latest Featured Stock Update with an annotated graph appeared on 2/15/2012. Click here.
View all notes |
Alert me of new notes |
CANSLIM.net Company Profile |
SEC |
Zacks Reports |
StockTalk |
News |
Chart |
Request a new note
C
A N
S L
I M
|
UBNT
-
NASDAQ
Ubiquiti Networks Inc
TELECOMMUNICATIONS - Diversified Communication Serv
|
$26.92
|
-0.25
-0.92% |
$27.26
|
98,656
31.22% of 50 DAV
50 DAV is 316,000
|
$28.97
-7.08%
|
1/27/2012
|
$22.25
|
PP = $23.14
|
|
MB = $24.30
|
Most Recent Note - 3/16/2012 6:00:32 PM
Y - Quietly consolidating within close striking distance of its 52-week high. They teach in the Certification that a stock may be bought from its 10-week moving average (WMA) up to +5% above the latest high (in this case $28.97 on 2/28/12 plus another 5%) following an earlier technical breakout.
>>> The latest Featured Stock Update with an annotated graph appeared on 2/1/2012. Click here.
View all notes |
Alert me of new notes |
CANSLIM.net Company Profile |
SEC |
Zacks Reports |
StockTalk |
News |
Chart |
Request a new note
C
A N
S L
I M
|
ULTA
-
NASDAQ
Ulta Salon Cosm & Frag
SPECIALTY RETAIL - Specialty Retail, Other
|
$88.58
|
-0.79
-0.88% |
$90.00
|
752,925
97.54% of 50 DAV
50 DAV is 771,900
|
$92.00
-3.72%
|
1/11/2012
|
$71.97
|
PP = $75.80
|
|
MB = $79.59
|
Most Recent Note - 3/12/2012 6:26:00 PM
G - Pulled back today on average volume from the all-time high hit on the prior session. It is extended from any sound base pattern, meanwhile its prior highs near $75 and its 50 DMA line define important chart support.
>>> The latest Featured Stock Update with an annotated graph appeared on 2/28/2012. Click here.
View all notes |
Alert me of new notes |
CANSLIM.net Company Profile |
SEC |
Zacks Reports |
StockTalk |
News |
Chart |
Request a new note
C
A N
S L
I M
|
V
-
NYSE
Visa Inc Cl A
DIVERSIFIED SERVICES - Business/Management Services
|
$116.68
|
-0.32
-0.27% |
$117.50
|
4,002,152
103.60% of 50 DAV
50 DAV is 3,862,900
|
$119.36
-2.25%
|
3/12/2012
|
$116.53
|
PP = $119.46
|
|
MB = $125.43
|
Most Recent Note - 3/12/2012 6:30:53 PM
Y - Consolidating near its all-time high with volume totals cooling while forming an advanced "3-weeks tight" pattern. Color code is changed to yellow with new pivot point based on its 2/29/12 high plus 10 cents. Volume-driven gains may trigger a new (or add-on) technical buy signal, meanwhile prior highs in the $103-104 area define support to watch along with its 50 DMA line.
>>> The latest Featured Stock Update with an annotated graph appeared on 3/7/2012. Click here.
View all notes |
Alert me of new notes |
CANSLIM.net Company Profile |
SEC |
Zacks Reports |
StockTalk |
News |
Chart |
Request a new note
C
A N
S L
I M
|
Symbol/Exchange
Company Name
Industry Group |
PRICE |
CHANGE
(%Change) |
Day High |
Volume
(% DAV)
(% 50 day avg vol) |
52 Wk Hi
% From Hi |
Featured
Date |
Price
Featured |
Pivot Featured |
|
Max Buy |