***Last / Change / Volume quote data in this table corresponds with the timestamp on the note***
Symbol/Exchange
Company Name
Industry Group |
Last |
Chg. |
Vol
% DAV |
Date Featured |
Price Featured |
Latest Pivot Point
Featured |
Status |
| Latest Max Buy Price |
ARUN
- NASDAQ
Aruba Networks Inc
COMPUTER HARDWARE - Networking & Communication Dev
|
$12.96
|
-0.17
|
813,714
55% DAV
1,479,000
|
2/19/2010
(Date
Featured) |
$12.71
(Price
Featured) |
PP = $11.94 |
G |
| MB = $12.54 |
Most Recent Note - 3/15/2010 6:27:15 PM
G - Loss today on light volume, consolidating after recent gains on high volume. It is extended from its prior base, and support to watch is now defined by prior chart highs and its 50 DMA line.
>>> The latest Featured Stock Update with an annotated graph appeared on 3/11/2010. click here.
|
|
C
A
S
I |
News |
Chart |
SEC
View all notes Alert
me of new notes
Company
Profile
|
BIDU
- NASDAQ
Baidu Inc Ads
INTERNET - Internet Information Providers
|
$576.84
|
+26.60
|
5,195,446
264% DAV
1,969,900
|
1/13/2010
(Date
Featured) |
$431.25
(Price
Featured) |
PP = $426.75 |
G |
| MB = $448.09 |
Most Recent Note - 3/15/2010 6:29:29 PM
G - Closed in the lower half of its intra-day range today after gapping up and rallying for a considerable gain with heavy volume greater than any session in over 4 weeks while headlines continue to swirl concerning search giant Google Inc. (GOOG) and its China pullout. BIDU is very extended from any sound base.
>>> The latest Featured Stock Update with an annotated graph appeared on 3/4/2010. click here.
|
|
C
A
S
I |
News |
Chart |
SEC
View all notes Alert
me of new notes
Company
Profile
|
BRLI
- NASDAQ
Bio Reference Labs Inc
HEALTH SERVICES - Medical Laboratories & Researc
|
$44.37
|
-0.65
|
84,013
85% DAV
98,500
|
2/12/2010
(Date
Featured) |
$39.02
(Price
Featured) |
PP = $40.97 |
G |
| MB = $43.02 |
Most Recent Note - 3/15/2010 6:34:00 PM
G - Down today with lighter volume after a negative reversal on 3/12/10. It is extended from its prior base, and prior chart highs and its 50 DMA line now coincide in the $40 area defining important support to watch.
>>> The latest Featured Stock Update with an annotated graph appeared on 3/1/2010. click here.
|
|
C
A
S
I |
News |
Chart |
SEC
View all notes Alert
me of new notes
Company
Profile
|
CACC
- NASDAQ
Credit Acceptance Corp
FINANCIAL SERVICES - Credit Services
|
$43.00
|
-0.61
|
39,774
68% DAV
58,800
|
9/29/2009
(Date
Featured) |
$33.48
(Price
Featured) |
PP = $37.10 |
G |
| MB = $38.96 |
Most Recent Note - 3/15/2010 6:35:47 PM
G - Loss on light volume today, remaining below its 50 DMA line which has recently acted as resistance. Recent lows in the $38 area are a nearby chart support level to watch.
>>> The latest Featured Stock Update with an annotated graph appeared on 3/2/2010. click here.
|
|
C
A
S
I |
News |
Chart |
SEC
View all notes Alert
me of new notes
Company
Profile
|
CISG
- NASDAQ
Cninsure Inc Ads
INSURANCE - Insurance Brokers
|
$25.40
|
-0.11
|
213,058
98% DAV
216,900
|
3/3/2010
(Date
Featured) |
$24.38
(Price
Featured) |
PP = $23.10 |
G |
| MB = $24.26 |
Most Recent Note - 3/15/2010 6:36:56 PM
G - Stubbornly holding its ground while perched near its 52-week high. No overhead supply remains to act as resistance. It rose from a 20-week double bottom base with 8 times average volume as it was featured in the 3/03/10 mid-day report (read here).
>>> The latest Featured Stock Update with an annotated graph appeared on 3/3/2010. click here.
|
|
C
A
S
I |
News |
Chart |
SEC
View all notes Alert
me of new notes
Company
Profile
|
CRM
- NYSE
Salesforce.com Inc
INTERNET - Internet Software & Services
|
$75.60
|
-0.11
|
1,414,301
69% DAV
2,051,700
|
3/5/2010
(Date
Featured) |
$72.28
(Price
Featured) |
PP = $75.53 |
Y |
| MB = $79.31 |
Most Recent Note - 3/15/2010 6:39:09 PM
Y - A small loss today ended a streak of 7 consecutive small gains. It remains perched above its pivot point after wedging higher last week following a 9-week base. Its 50 DMA line and recent chart low ($64.77 on 2/25/10) define important support.
>>> The latest Featured Stock Update with an annotated graph appeared on 3/5/2010. click here.
|
|
C
A
S
I |
News |
Chart |
SEC
View all notes Alert
me of new notes
Company
Profile
|
CTRP
- NASDAQ
Ctrip.com Intl Ltd Adr
LEISURE - Resorts & Casinos
|
$37.97
|
-0.68
|
1,297,994
60% DAV
2,163,300
|
3/1/2010
(Date
Featured) |
$38.23
(Price
Featured) |
PP = $38.50 |
Y |
| MB = $40.43 |
Most Recent Note - 3/15/2010 6:41:08 PM
Y - Down today on lighter than average volume, but slumping back below its pivot point. Completed an offering of additional shares on 3/03/10, shortly after featured in the March 2010 issue of CANSLIM.net News (read here). A gain above its pivot point or its most recent chart highs is still needed to confirm a fresh technical buy signal with +50% above average volume or more.
>>> The latest Featured Stock Update with an annotated graph appeared on 2/28/2010. click here.
|
|
C
A
S
I |
News |
Chart |
SEC
View all notes Alert
me of new notes
Company
Profile
|
EZPW
- NASDAQ
Ezcorp Inc Cl A
SPECIALTY RETAIL - Specialty Retail, Other
|
$20.40
|
-1.57
|
1,897,278
385% DAV
492,500
|
2/19/2010
(Date
Featured) |
$19.03
(Price
Featured) |
PP = $18.80 |
G |
| MB = $19.74 |
Most Recent Note - 3/15/2010 6:42:48 PM
G - Considerable loss today on heavy volume nearly 4 times average, a sign it is encountering distributional pressure after getting extended from any sound base of support. Prior chart highs in the $18 area and its 50 DMA line define an important support level to watch.
>>> The latest Featured Stock Update with an annotated graph appeared on 3/8/2010. click here.
|
|
C
A
S
I |
News |
Chart |
SEC
View all notes Alert
me of new notes
Company
Profile
|
GMCR
- NASDAQ
Green Mtn Coffee Roastrs
FOOD & BEVERAGE - Processed & Packaged Goods
|
$93.09
|
+0.44
|
1,151,857
87% DAV
1,329,000
|
2/26/2010
(Date
Featured) |
$84.39
(Price
Featured) |
PP = $88.75 |
Y |
| MB = $93.19 |
Most Recent Note - 3/15/2010 6:58:44 PM
Y - Posted a 4th consecutive gain with near average volume today, approaching its max buy level. Hovering near all-time highs since its gain on 3/08/10 triggered a new technical buy signal. Initial support to watch now would be prior chart highs in the $86-88 area.
>>> The latest Featured Stock Update with an annotated graph appeared on 3/12/2010. click here.
|
|
C
A
S
I |
News |
Chart |
SEC
View all notes Alert
me of new notes
Company
Profile
|
ISRG
- NASDAQ
Intuitive Surgical Inc
HEALTH SERVICES - Medical Appliances & Equipment
|
$356.00
|
-2.90
|
315,166
62% DAV
510,600
|
1/22/2010
(Date
Featured) |
$340.40
(Price
Featured) |
PP = $314.00 |
G |
| MB = $329.70 |
Most Recent Note - 3/15/2010 7:00:48 PM
G - Small loss today on light volume, continuing its consolidation in a tight range, perched quietly near all-time highs. Prior chart highs near $346 are now a support level to watch.
>>> The latest Featured Stock Update with an annotated graph appeared on 2/24/2010. click here.
|
|
C
A
S
I |
News |
Chart |
SEC
View all notes Alert
me of new notes
Company
Profile
|
PCLN
- NASDAQ
Priceline.com Inc
INTERNET - Internet Software & Services
|
$399.55
|
-4.72
|
584,812
N/A
|
11/1/2002
(Date
Featured) |
$399.55
(Price
Featured) |
PP = $428.20 |
Y |
| MB = $449.61 |
Most Recent Note - 1/2/2011
Y - Returns to Featured Stocks list with its appearance in the January 2011 CANSLIM.net News including detailed analysis and annotated daily and weekly graphs.
>>> The latest Featured Stock Update with an annotated graph appeared on 3/10/2010. click here.
|
|
C
A
S
I |
News |
Chart |
SEC
View all notes Alert
me of new notes
Company
Profile
|
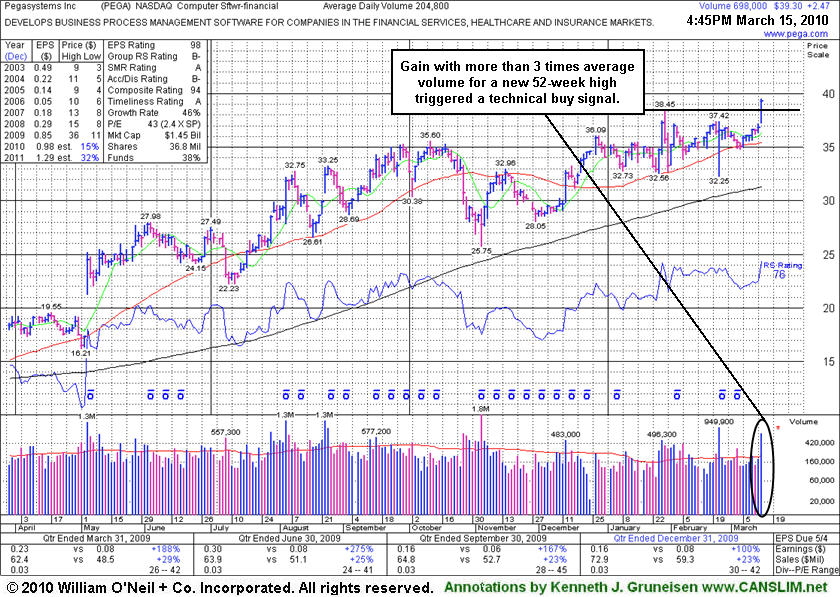
PEGA
- NASDAQ
Pegasystems Inc
COMPUTER SOFTWARE & SERVICES - Business Software & Services
|
$39.30
|
+2.47
|
705,071
344% DAV
204,800
|
2/26/2010
(Date
Featured) |
$36.00
(Price
Featured) |
PP = $38.55 |
Y |
| MB = $40.48 |
Most Recent Note - 3/15/2010 7:04:28 PM
Y - Gapped up today and triggered a technical buy signal as it rallied with more than 3 times average volume to a new 52-week high above its pivot point. The bullish action came after announcing plans to buy Chordiant Software Inc (CHRD), a firm with sub par fundamentals under the investment system guidelines. Recently found support at its 50 DMA line, while prior chart lows in the $32 area are the next support level.
>>> The latest Featured Stock Update with an annotated graph appeared on 3/15/2010. click here.
|
|
C
A
S
I |
News |
Chart |
SEC
View all notes Alert
me of new notes
Company
Profile
|
ROVI
- NASDAQ
Rovi Corp
COMPUTER SOFTWARE & SERVICES - Security Software & Services
|
$37.83
|
+0.01
|
1,208,911
91% DAV
1,331,300
|
2/25/2010
(Date
Featured) |
$33.54
(Price
Featured) |
PP = $34.87 |
G |
| MB = $36.61 |
Most Recent Note - 3/15/2010 7:07:03 PM
G - Ended a penny higher today for an 8th consecutive gain. Prior chart highs in the $34 area define an important support level to watch on pullbacks.
>>> The latest Featured Stock Update with an annotated graph appeared on 2/25/2010. click here.
|
|
C
A
S
I |
News |
Chart |
SEC
View all notes Alert
me of new notes
Company
Profile
|
SIRO
- NASDAQ
Sirona Dental Systems
HEALTH SERVICES - Medical Instruments & Supplies
|
$37.45
|
+0.40
|
713,900
126% DAV
568,700
|
2/16/2010
(Date
Featured) |
$36.43
(Price
Featured) |
PP = $36.15 |
Y |
| MB = $37.96 |
Most Recent Note - 3/15/2010 7:08:39 PM
Y - Small gain today for its second best close ever, approaching its max buy level. Prior chart highs and its 50 DMA line in the $35-36 area define important support to watch.
>>> The latest Featured Stock Update with an annotated graph appeared on 3/9/2010. click here.
|
|
C
A
S
I |
News |
Chart |
SEC
View all notes Alert
me of new notes
Company
Profile
|
ULTA
- NASDAQ
Ulta Salon Cosm & Frag
SPECIALTY RETAIL - Specialty Retail, Other
|
$22.11
|
-1.22
|
1,143,103
304% DAV
376,000
|
3/12/2010
(Date
Featured) |
$22.81
(Price
Featured) |
PP = $21.72 |
Y |
| MB = $22.81 |
Most Recent Note - 3/15/2010 7:10:49 PM
Y - Gapped down today for a loss on high volume after an analyst downgrade. Prior chart highs in the $21 area now define a very important technical support level. A detailed Stock Bulletin with annotated graph was published soon after it was featured in the 3/12/10 mid-day report.
>>> The latest Featured Stock Update with an annotated graph appeared on 3/12/2010. click here.
|
|
C
A
S
I |
News |
Chart |
SEC
View all notes Alert
me of new notes
Company
Profile
|
VPRT
- NASDAQ
Vistaprint Nv
DIVERSIFIED SERVICES - Business/Management Services
|
$60.00
|
-0.87
|
442,152
89% DAV
495,300
|
3/1/2010
(Date
Featured) |
$57.72
(Price
Featured) |
PP = $59.70 |
Y |
| MB = $62.69 |
Most Recent Note - 3/15/2010 7:12:58 PM
Y - Today was its 4th consecutive small loss, yet it is still consolidating only -4.4% from its 3/09/10 all-time high. It did not yet trigger a technical buy signal since featured in the March 2010 CANSLIM.net News monthly newsletter (read here). As previously noted, "Its gain on 3/02/10 was below the volume guidelines for buyable breakouts under the investment system."
>>> The latest Featured Stock Update with an annotated graph appeared on 2/28/2010. click here.
|
|
C
A
S
I |
News |
Chart |
SEC
View all notes Alert
me of new notes
Company
Profile
|