You are not logged in.
This means you
CAN ONLY VIEW reports that were published prior to Monday, April 14, 2025.
You
MUST UPGRADE YOUR MEMBERSHIP if you want to see any current reports.
AFTER MARKET UPDATE - FRIDAY, MARCH 14TH, 2014
Previous After Market Report Next After Market Report >>>
|
|
|
|
DOW |
-43.22 |
16,065.67 |
-0.27% |
|
Volume |
628,325,470 |
-7% |
|
Volume |
2,073,326,250 |
-7% |
|
NASDAQ |
-15.02 |
4,245.40 |
-0.35% |
|
Advancers |
1,733 |
55% |
|
Advancers |
1,479 |
52% |
|
S&P 500 |
-5.21 |
1,841.13 |
-0.28% |
|
Decliners |
1,261 |
40% |
|
Decliners |
1,281 |
45% |
|
Russell 2000 |
+4.67 |
1,181.41 |
+0.40% |
|
52 Wk Highs |
56 |
|
|
52 Wk Highs |
81 |
|
|
S&P 600 |
+3.01 |
669.63 |
+0.45% |
|
52 Wk Lows |
40 |
|
|
52 Wk Lows |
27 |
|
|
 |
Major Averages Pulled Back With Less Volume Conviction
Kenneth J. Gruneisen - Passed the CAN SLIM® Master's Exam
For the week, the Dow was off -2.3%, the S&P 500 fell -2% and the NASDAQ ended lower by -2.1%. The major averages ended modestly lower on Friday's session. Volume totals were reported lighter on the NYSE and on the Nasdaq exchange. Advancers led decliners by a 4-3 margin on the NYSE and 7-6 on the Nasdaq exchange. There were 20 high-ranked companies from the CANSLIM.net Leaders List that made new 52-week highs and appeared on the CANSLIM.net BreakOuts Page, up from the total of 18 stocks on the prior session. The list of stocks hitting new 52-week highs still outnumbered new 52-week lows on the Nasdaq exchange and on the NYSE. There were gains for 7 of the 12 high-ranked companies currently included on the Featured Stocks Page. The Market (M criteria) uptrend has come under pressure recently and investors should be watchful for individual issues flashing technical sell signals. For any rally to be sustained it is critical for there to be healthy leadership, so it remains crucial for many stocks to continue hitting new 52-week highs.
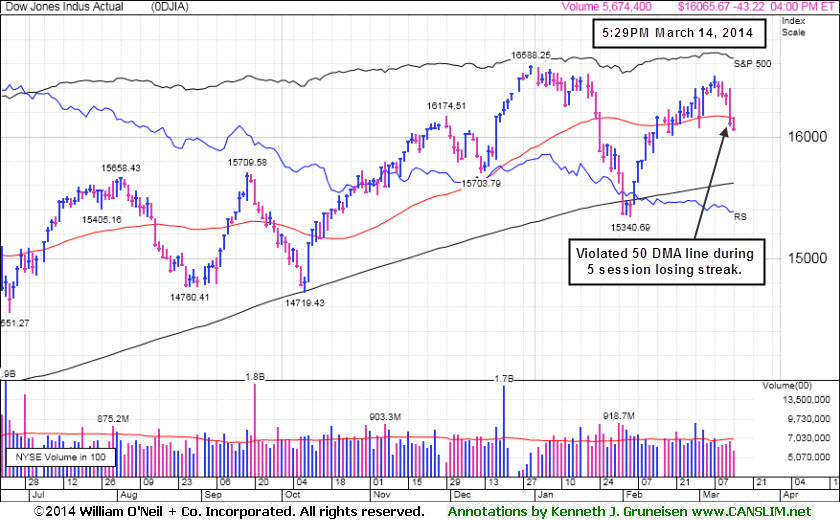
Stocks toggled between gains and losses throughout the session on Friday. The Dow Jones Industrial Average gave up 43 points to 16,065, the S&P 500 fell 5 points to 1,841 and the NASDAQ shed 15 points with the index closing at 4,245.
Investors exercised caution heading into the weekend as the Crimean Parliament prepares for a vote that will determine the fate of the region. Recent moves by Russia along the Ukrainian border have sparked fears that the situation could escalate into a military conflict.
On the earnings front, Ulta Salon (ULTA +6.42%) rallied following their better-than-anticipated quarterly report. On the downside, Hibbett Sports (HIBB -3.70%) after the sporting goods retailer posted results that were below analysts' estimates.
Turning to fixed income markets, Treasuries are little changed along the curve. The benchmark 10-year note was down 1/32 to yield 2.65% and the 30-year bond added 1/16 of a point to yield 3.59%.
The CANSLIM.net Featured Stocks Page shows the most action-worthy candidates and their latest notes and a Headline Link directs members to the latest detailed analysis with data-packed graphs annotated by a Certified expert along with links to additional resources. The Premium Member Homepage includes "dynamic archives" to all prior pay reports published. Watch for an announcement via email concerning the next WEBCAST.
PICTURED: The Dow Jones Industrial Average violated its 50-day moving average (DMA) line during its 5-day losing streak.
|
 Kenneth J. Gruneisen started out as a licensed stockbroker in August 1987, a couple of months prior to the historic stock market crash that took the Dow Jones Industrial Average down -22.6% in a single day. He has published daily fact-based fundamental and technical analysis on high-ranked stocks online for two decades. Through FACTBASEDINVESTING.COM, Kenneth provides educational articles, news, market commentary, and other information regarding proven investment systems that work in good times and bad.
Comments contained in the body of this report are technical opinions only and are not necessarily those of Gruneisen Growth Corp. The material herein has been obtained from sources believed to be reliable and accurate, however, its accuracy and completeness cannot be guaranteed. Our firm, employees, and customers may effect transactions, including transactions contrary to any recommendation herein, or have positions in the securities mentioned herein or options with respect thereto. Any recommendation contained in this report may not be suitable for all investors and it is not to be deemed an offer or solicitation on our part with respect to the purchase or sale of any securities. |
|
 |
Financial and Tech Groups Weighed on Major Averages
Kenneth J. Gruneisen - Passed the CAN SLIM® Master's Exam
The Gold & Silver Index ($XAU +0.85%) was a standout gainer on Friday while most groups slumped. The Biotechnology Index ($BTK -0.72%), Semiconductor Index ($SOX -0.47%), and the Networking Index ($NWX -0.38%) ended with unanimous losses. The Integrated Oil Index ($XOI +0.37%) posted a small gain while the Oil Services Index ($OSX -0.12%) edged lower. The Retail Index ($RLX +0.14%) eked out a small gain. Financial shares created a drag on the major averages as the Bank Index ($BKX -0.54%) and the Broker/Dealer Index ($XBD -0.47%) edged lower.
Charts courtesy www.stockcharts.com
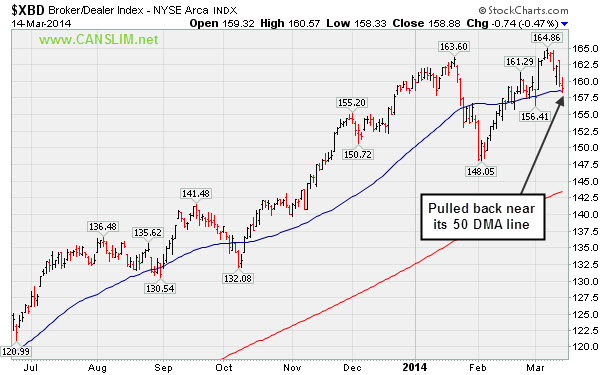
PICTURED: The Broker/Dealer Index ($XBD -0.47%) pulled back near its 50-day moving average (DMA) line.
| Oil Services |
$OSX |
273.82 |
-0.32 |
-0.12% |
-2.57% |
| Integrated Oil |
$XOI |
1,470.50 |
+5.39 |
+0.37% |
-2.17% |
| Semiconductor |
$SOX |
562.48 |
-2.66 |
-0.47% |
+5.13% |
| Networking |
$NWX |
337.24 |
-1.30 |
-0.38% |
+4.11% |
| Broker/Dealer |
$XBD |
158.88 |
-0.74 |
-0.47% |
-1.05% |
| Retail |
$RLX |
921.07 |
+1.27 |
+0.14% |
-1.99% |
| Gold & Silver |
$XAU |
106.20 |
+0.90 |
+0.85% |
+26.20% |
| Bank |
$BKX |
69.54 |
-0.38 |
-0.54% |
+0.40% |
| Biotech |
$BTK |
2,736.11 |
-19.91 |
-0.72% |
+17.41% |
|
|
|
 |
Pulling Back After Getting Extended From Prior Base
Kenneth J. Gruneisen - Passed the CAN SLIM® Master's Exam
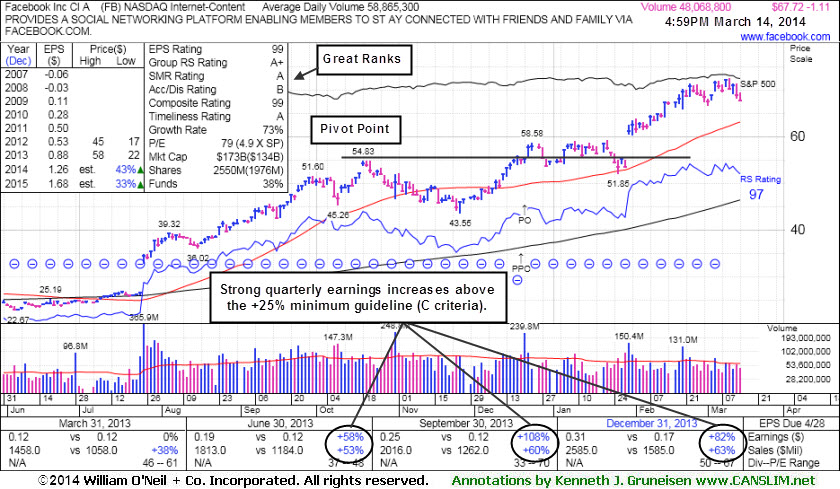
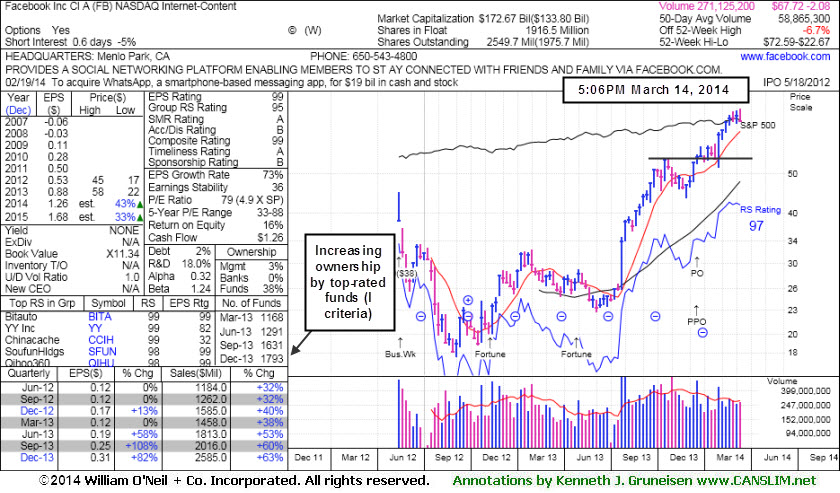
Facebook Inc (FB -$1.11 or -1.61% to $67.72) has been pulling back after getting very extended from any sound base. Its 50-day moving average (DMA) line ($63) defines near-term support to watch. FB was last shown in this FSU section on 2/25/14 with annotated graphs under the headline, "High-Ranked Internet Group Leader is Extended From Base", trading well beyond the "secondary buy point" previously noted. Disciplined investors avoid chasing extended stocks.
It reported earnings +82% on +63% sales revenues for the Dec '13 quarter, marking its 3rd quarterly comparison with earnings above the +25% minimum (C criteria). Sequential acceleration in quarterly sales and strong earnings increases helps it look like a better match with the fact-based investment system's winning models.
The high-ranked Internet - Content group leader rallied from a 9-week cup shaped base without a handle after completing a Public Offering on 12/20/13. The 12/12/13 mid-day report (read here) first highlighted the stock in yellow with a pivot point cited based on its 10/18/13 high plus 10 cents.
The number of top-rated funds owning its shares rose from 1,116 in Dec '12 to 1,793 in Dec '13, a reassuring sign concerning the I criteria. Keep in mind that its large supply of 2.54 billion shares in the public float makes it an unlikely sprinter, especially as it is already well known by the institutional crowd and the general public.
|
|
|
Color Codes Explained :
Y - Better candidates highlighted by our
staff of experts.
G - Previously featured
in past reports as yellow but may no longer be buyable under the
guidelines.
***Last / Change / Volume data in this table is the closing quote data***
Symbol/Exchange
Company Name
Industry Group |
PRICE |
CHANGE
(%Change) |
Day High |
Volume
(% DAV)
(% 50 day avg vol) |
52 Wk Hi
% From Hi |
Featured
Date |
Price
Featured |
Pivot Featured |
|
Max Buy |
EQM
-
NYSE
E Q T Midstream Partners
ENERGY - Oil and Gas Pipelines
|
$64.48
|
+0.24
0.37% |
$64.90
|
49,071
44.21% of 50 DAV
50 DAV is 111,000
|
$67.80
-4.90%
|
12/12/2013
|
$53.17
|
PP = $56.51
|
|
MB = $59.34
|
Most Recent Note - 3/10/2014 3:47:05 PM
G - Still stubbornly holding its ground since reporting earnings -2% on +22% sales revenues for the Dec '13 quarter, below the +25% minimum earnings guideline (C criteria), raising fundamental concerns. Its 50 DMA line ($62.85 now) defines near-term support where a violation may trigger a technical sell signal.
>>> FEATURED STOCK ARTICLE : Resilient Despite Fundamental Concerns - 3/3/2014
View all notes |
Set NEW NOTE alert |
CANSLIM.net Company Profile |
SEC
News |
Chart |
Request a new note
C
A N
S L
I M


|
FB
-
NASDAQ
Facebook Inc Cl A
INTERNET
|
$67.72
|
-1.11
-1.61% |
$69.43
|
48,074,686
81.67% of 50 DAV
50 DAV is 58,865,000
|
$72.59
-6.71%
|
12/12/2013
|
$51.40
|
PP = $54.93
|
|
MB = $57.68
|
 Most Recent Note - 3/14/2014 5:36:57 PM
G - Pulling back after getting extended from any sound base. Its 50 DMA line ($63 now) defines near-term support to watch. See the latest FSU analysis for more details and new annotated graphs.
>>> FEATURED STOCK ARTICLE : Pulling Back After Getting Extended From Prior Base - 3/14/2014
View all notes |
Set NEW NOTE alert |
CANSLIM.net Company Profile |
SEC
News |
Chart |
Request a new note
C
A N
S L
I M
|
FLT
-
NYSE
Fleetcor Technologies
DIVERSIFIED SERVICES - Business/Management Services
|
$118.05
|
+0.13
0.11% |
$118.68
|
623,043
461.51% of 50 DAV
50 DAV is 135,000
|
$132.22
-10.72%
|
3/5/2014
|
$125.40
|
PP = $124.06
|
|
MB = $130.26
|
Most Recent Note - 3/14/2014 12:04:04 PM
Y - Deterioration below its old high close ($122.70 on 12/02/13) raised concerns and completely negated the recent breakout. Slumping near its 50 DMA line with today's 6th consecutive loss, and more damaging losses leading to a violation would raise serious concerns.
>>> FEATURED STOCK ARTICLE : Consolidating Following Recent Breakout to New High Territory - 3/5/2014
View all notes |
Set NEW NOTE alert |
CANSLIM.net Company Profile |
SEC
News |
Chart |
Request a new note
C
A N
S L
I M
|
GNRC
-
NYSE
Generac Hldgs Inc
Electrical-Power/Equipmt
|
$60.47
|
+3.72
6.56% |
$60.67
|
1,242,627
130.80% of 50 DAV
50 DAV is 950,000
|
$59.74
1.23%
|
2/14/2014
|
$56.50
|
PP = $57.39
|
|
MB = $60.26
|
Most Recent Note - 3/14/2014 5:43:54 PM
G - Color code is changed to green after finishing near the session high and above its "max buy" level with a solid gain today backed by +31% above average volume.
>>> FEATURED STOCK ARTICLE : Bullish Gap Up Followed By Wedging and Stalling Action - 3/11/2014
View all notes |
Set NEW NOTE alert |
CANSLIM.net Company Profile |
SEC
News |
Chart |
Request a new note
C
A N
S L
I M
|
ICON
-
NASDAQ
Iconix Brand Group Inc
CONSUMER NON-DURABLES - Textile - Apparel Footwear
|
$39.90
|
-0.39
-0.97% |
$40.41
|
591,680
94.52% of 50 DAV
50 DAV is 626,000
|
$42.47
-6.04%
|
3/7/2014
|
$41.46
|
PP = $40.88
|
|
MB = $42.92
|
Most Recent Note - 3/12/2014 5:43:05 PM
Y - Consolidating above prior highs in the $40 area defining near-term support. Highlighted in yellow with pivot point cited based on its 12/02/13 high plus 10 cents in the 3/07/14 mid-day report (read here).
>>> FEATURED STOCK ARTICLE : Encountered Distributional Pressure Following Recent Breakout - 3/7/2014
View all notes |
Set NEW NOTE alert |
CANSLIM.net Company Profile |
SEC
News |
Chart |
Request a new note
C
A N
S L
I M
|
Symbol/Exchange
Company Name
Industry Group |
PRICE |
CHANGE
(%Change) |
Day High |
Volume
(% DAV)
(% 50 day avg vol) |
52 Wk Hi
% From Hi |
Featured
Date |
Price
Featured |
Pivot Featured |
|
Max Buy |
KORS
-
NYSE
Michael Kors Hldgs Ltd
RETAIL - Apparel Stores
|
$98.12
|
+1.10
1.13% |
$98.85
|
2,049,767
57.27% of 50 DAV
50 DAV is 3,579,000
|
$101.04
-2.89%
|
3/12/2014
|
$98.03
|
PP = $101.14
|
|
MB = $106.20
|
Most Recent Note - 3/12/2014 5:35:29 PM
Y - Color code is changed to yellow with new pivot point cited based on its 2/25/14 high plus 10 cents. While stubbornly holding its ground in a tight range near its 52-week high, volume totals cooling in recent weeks indicates that few investors have headed for the exit. Its 50 DMA line ($88) defines the nearest support above prior highs in the $84 area. See the latest FSU analysis for more details and new annotated graphs.
>>> FEATURED STOCK ARTICLE : Formed Advanced Base Pattern With Volume Totals Cooling - 3/12/2014
View all notes |
Set NEW NOTE alert |
CANSLIM.net Company Profile |
SEC
News |
Chart |
Request a new note
C
A N
S L
I M
|
LEAF
-
NYSE
Springleaf Holdings Inc
Finance-Consumer Loans
|
$24.48
|
-1.38
-5.34% |
$25.70
|
781,263
578.71% of 50 DAV
50 DAV is 135,000
|
$29.50
-17.02%
|
2/24/2014
|
$28.60
|
PP = $27.44
|
|
MB = $28.81
|
Most Recent Note - 3/14/2014 5:38:44 PM
G - Violated support at its 50 DMA line and triggered a technical sell signal with today's damaging 5th consecutive loss on ever-increasing volume. Disciplined investors avoid chasing extended stocks more than +5% above prior highs and always limit losses by selling any stock that falls more than -7% from their purchase price. See the latest FSU analysis for more details and annotated graphs.
>>> FEATURED STOCK ARTICLE : Fourth Loss on Above Average Volume Testing 50-Day Average - 3/13/2014
View all notes |
Set NEW NOTE alert |
CANSLIM.net Company Profile |
SEC
News |
Chart |
Request a new note
C
A N
S L
I M
|
PCLN
-
NASDAQ
Priceline.com Inc
INTERNET - Internet Software and Services
|
$1,267.93
|
-31.80
-2.45% |
$1,296.97
|
862,069
110.10% of 50 DAV
50 DAV is 783,000
|
$1,378.96
-8.05%
|
12/18/2013
|
$1,156.20
|
PP = $1,198.85
|
|
MB = $1,258.79
|
Most Recent Note - 3/14/2014 5:40:20 PM
G - Down again today with near average volume. Near-term support to watch is its 50 DMA line ($1,232).
>>> FEATURED STOCK ARTICLE : Perched At Highs With Volume Totals Cooling - 3/10/2014
View all notes |
Set NEW NOTE alert |
CANSLIM.net Company Profile |
SEC
News |
Chart |
Request a new note
C
A N
S L
I M
|
PSIX
-
NASDAQ
Power Solutions Intl Inc
Machinery-Gen Industrial
|
$75.67
|
-2.34
-3.00% |
$79.99
|
68,957
109.46% of 50 DAV
50 DAV is 63,000
|
$87.40
-13.42%
|
2/28/2014
|
$74.65
|
PP = $76.93
|
|
MB = $80.78
|
Most Recent Note - 3/14/2014 5:41:39 PM
Y - Down for a 4th consecutive loss today, slumping under its pivot point and below prior highs in the $78 area raising concerns. Disciplined investors avoid chasing stocks more than +5% above prior highs and always sell if any stock falls more than -7% from their purchase price.
>>> FEATURED STOCK ARTICLE : Earnings Solid and Forming a Cup-With-Handle - 2/28/2014
View all notes |
Set NEW NOTE alert |
CANSLIM.net Company Profile |
SEC
News |
Chart |
Request a new note
C
A N
S L
I M
|
SILC
-
NASDAQ
Silicom Ltd
COMPUTER HARDWARE - Networking andamp; Communication Dev
|
$67.94
|
+0.27
0.40% |
$68.55
|
45,737
54.45% of 50 DAV
50 DAV is 84,000
|
$73.44
-7.49%
|
12/23/2013
|
$44.62
|
PP = $46.25
|
|
MB = $48.56
|
Most Recent Note - 3/12/2014 5:41:23 PM
G - Posted a gain today on lighter volume after retreating from all-time highs with 4 consecutive losses. Extended from any sound base. Patient investors may watch for a new base or secondary buy point to possibly develop and be noted in the weeks ahead.
>>> FEATURED STOCK ARTICLE : Very Extended From Prior Base After 11 Straight Weekly Gains - 3/6/2014
View all notes |
Set NEW NOTE alert |
CANSLIM.net Company Profile |
SEC
News |
Chart |
Request a new note
C
A N
S L
I M
|
Symbol/Exchange
Company Name
Industry Group |
PRICE |
CHANGE
(%Change) |
Day High |
Volume
(% DAV)
(% 50 day avg vol) |
52 Wk Hi
% From Hi |
Featured
Date |
Price
Featured |
Pivot Featured |
|
Max Buy |
ULTI
-
NASDAQ
Ultimate Software Group
INTERNET - Internet Software and Services
|
$154.72
|
+0.84
0.55% |
$156.61
|
112,274
83.17% of 50 DAV
50 DAV is 135,000
|
$171.96
-10.03%
|
1/27/2014
|
$153.75
|
PP = $162.98
|
|
MB = $171.13
|
Most Recent Note - 3/11/2014 5:32:29 PM
G - Volume was higher behind today's 5th consecutive damaging loss. Weak action triggered a technical sell signal while slumping below its 50 DMA line and its color code is changed to green. Only a prompt rebound above the 50 DMA line would help its outlook improve.
>>> FEATURED STOCK ARTICLE : Near 52--Week High Following Another Volume-Driven Gain - 3/4/2014
View all notes |
Set NEW NOTE alert |
CANSLIM.net Company Profile |
SEC
News |
Chart |
Request a new note
C
A N
S L
I M
|
VRX
-
NYSE
Valeant Pharmaceuticals
DRUGS - Drug Manufacturers - Other
|
$140.01
|
+0.68
0.49% |
$140.50
|
1,255,793
71.92% of 50 DAV
50 DAV is 1,746,000
|
$153.10
-8.55%
|
9/11/2013
|
$100.26
|
PP = $105.50
|
|
MB = $110.78
|
Most Recent Note - 3/13/2014 12:40:00 PM
G - Consolidating just above its 50 DMA line ($136) which defines near-term support. A more damaging violation may raise serious concerns and trigger a more worrisome technical sell signal.
>>> FEATURED STOCK ARTICLE : Strong Earnings Report; On Track for 9th Weekly Gain in 10 Weeks - 2/27/2014
View all notes |
Set NEW NOTE alert |
CANSLIM.net Company Profile |
SEC
News |
Chart |
Request a new note
C
A N
S L
I M
|
|
|
|
THESE ARE NOT BUY RECOMMENDATIONS!
Comments contained in the body of this report are technical
opinions only. The material herein has been obtained
from sources believed to be reliable and accurate, however,
its accuracy and completeness cannot be guaranteed.
This site is not an investment advisor, hence it does
not endorse or recommend any securities or other investments.
Any recommendation contained in this report may not
be suitable for all investors and it is not to be deemed
an offer or solicitation on our part with respect to
the purchase or sale of any securities. All trademarks,
service marks and trade names appearing in this report
are the property of their respective owners, and are
likewise used for identification purposes only.
This report is a service available
only to active Paid Premium Members.
You may opt-out of receiving report notifications
at any time. Questions or comments may be submitted
by writing to Premium Membership Services 665 S.E. 10 Street, Suite 201 Deerfield Beach, FL 33441-5634 or by calling 1-800-965-8307
or 954-785-1121.
|
|
|

