You are not logged in.
This means you
CAN ONLY VIEW reports that were published prior to Monday, April 14, 2025.
You
MUST UPGRADE YOUR MEMBERSHIP if you want to see any current reports.
AFTER MARKET UPDATE - MONDAY, MARCH 14TH, 2011
Previous After Market Report Next After Market Report >>>
|
|
|
|
DOW |
-51.24 |
11,993.16 |
-0.43% |
|
Volume |
964,105,090 |
+5% |
|
Volume |
1,742,519,150 |
-4% |
|
NASDAQ |
-14.64 |
2,700.97 |
-0.54% |
|
Advancers |
946 |
30% |
|
Advancers |
793 |
29% |
|
S&P 500 |
-7.89 |
1,296.39 |
-0.60% |
|
Decliners |
2,052 |
66% |
|
Decliners |
1,848 |
68% |
|
Russell 2000 |
-4.66 |
798.17 |
-0.58% |
|
52 Wk Highs |
37 |
|
|
52 Wk Highs |
33 |
|
|
S&P 600 |
-1.95 |
424.26 |
-0.46% |
|
52 Wk Lows |
30 |
|
|
52 Wk Lows |
75 |
|
|
 |
Major Averages Weakening Below 50-Day Moving Averages
Kenneth J. Gruneisen - Passed the CAN SLIM® Master's Exam
The major averages steadily rebounded throughout the afternoon on Monday, reclaiming some of their lost ground, but they still ended the mostly negative session with losses. Gruesome coverage of the huge earthquake in Japan dominated headlines. Meanwhile, the European Union widened the scope of its bailout fund. Decliners outnumbered advancing issues by about 2-1 on the NYSE and on the Nasdaq exchange. Volume totals were reported higher on the NYSE and lighter on the Nasdaq exchange versus the prior session's totals, whereas gains on higher volume would be considered a more reassuring sign of accumulation by the institutional crowd. New 52-week lows outnumbered new 52-week highs on the Nasdaq exchange for a third consecutive session. New highs on the NYSE narrowly outnumbered new lows. There were 13 high-ranked companies from the CANSLIM.net Leaders List that made new 52-week highs and appeared on the CANSLIM.net BreakOuts Page, up slightly from a total of 11 on the prior session. On the Featured Stocks Page there were gains from only 6 of the 21 high-ranked market leaders currently listed.
Stocks headed lower in early trading as the market assessed damage to the world economy and concerns escalated about the impact from the Japanese disaster. The Tokyo Nikkei plunged -6.2% overnight to a four-month low. Companies associated with nuclear energy came under pressure. Uranium Energy Corporation (UEC -19.18%), a speculative, low-priced firm listed on the American Stock Exchange, plunged.
A drop in the price of oil below $100 was a boon for refiners including Valero Energy Corp (VLO +3.25%). Warren Buffett's Berkshire Hathaway (BRKA -1.25%) announced it would purchase Lubrizol Corp (LZ +27.7%) for $9 billion. Utility stocks were under pressure, however Exelon Corp (EXC -0.63%), the largest U.S. owner of nuclear reactors, held its ground quite well considering investor sentiment. Meanwhile, General Electric (GE -2.16%), which designed Japanese reactors and is in talks to sell nuclear reactors to India, fell. At the same time, Peabody Energy Corp (BTU +3.37%), and First Solar Inc (FSLR +5.13%) and Suntech Power Holdings Co Ltd (STP +2.99%) posted gains as coal and solar energy-related companies benefited while investors looked for alternatives. MEMC Electronic Materials Inc (WFR +11.23%), a company that makes wafers used in solar power, was also a standout gainer.
Dow component Pfizer Inc (PFE +1.75%) rose after an analyst said the company could spin off some of its businesses. Retailers with large businesses in Japan were lower, including Tiffany & Company (TIF -5.27%). Walt Disney Co's (DIS -1.6%) two theme parks in Tokyo are expected to be closed for ten days.
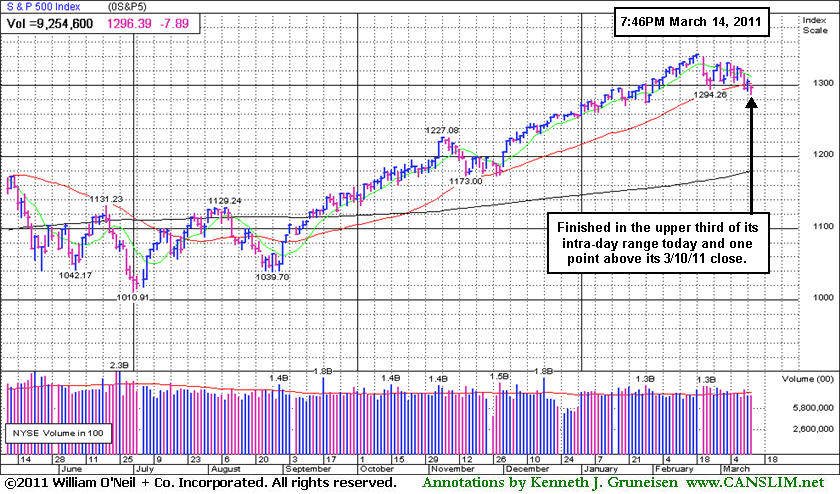
More damaging distributional action has the potential to lead to a much more substantial correction for the major averages (bad M criteria). During a correction investors should raise their cash levels and reduce stock market exposure. New buying efforts should be avoided until a new rally with a follow-through day (FTD) provides a fresh confirmation that buying demand from the institutional crowd is returning again. Even after a FTD, marked by an expansion in volume and stocks hitting new highs with higher volume, buying efforts should only be cautiously and carefully made when all of the investment system's key criteria are met.
PICTURED: The S&P 500 Index touched its lowest level since January before rebounding for a smaller loss. It was not an accumulation day, yet it finished in the upper third of its intra-day range and one point above its 3/10/11 close. The 3 major averages now are slumping below their respective 50-day moving average (DMA) lines, a clear sign that the market's trend has weakened.
|
 Kenneth J. Gruneisen started out as a licensed stockbroker in August 1987, a couple of months prior to the historic stock market crash that took the Dow Jones Industrial Average down -22.6% in a single day. He has published daily fact-based fundamental and technical analysis on high-ranked stocks online for two decades. Through FACTBASEDINVESTING.COM, Kenneth provides educational articles, news, market commentary, and other information regarding proven investment systems that work in good times and bad.
Comments contained in the body of this report are technical opinions only and are not necessarily those of Gruneisen Growth Corp. The material herein has been obtained from sources believed to be reliable and accurate, however, its accuracy and completeness cannot be guaranteed. Our firm, employees, and customers may effect transactions, including transactions contrary to any recommendation herein, or have positions in the securities mentioned herein or options with respect thereto. Any recommendation contained in this report may not be suitable for all investors and it is not to be deemed an offer or solicitation on our part with respect to the purchase or sale of any securities. |
|
 |
Financial Shares' Negative Bias Hurting Outlook
Kenneth J. Gruneisen - Passed the CAN SLIM® Master's Exam
The Broker/Dealer Index ($XBD -1.29%) and Bank Index ($BKX -0.82%) fell as financial shares were among the session's most damaging influences. The financial groups' deterioration is of particular concern at present because the major averages historically have been prone to sustaining greater damage whenever financial stocks were weak. The Retail Index ($RLX -0.99%) also had a negative bias and weighed on the major market indices. Note that all 3 of the above mentioned indexes are deteriorating well below their 50-day moving average (DMA) lines, respectively. It is no great coincidence that there is a corresponding slump below all of the major market averages currently proving the market is in a correction.
The Integrated Oil Index ($XOI +0.07%) and Oil Services Index ($OSX +0.20%) bucked a broadly negative market as energy-related issues inched higher. Their outlook was helped by lower oil prices. However, the Healthcare Index ($HMO -1.18%) and Gold & Silver Index ($XAU -0.20%) provided no reward for defensively positioned investors. In times of economic uncertainty those groups typically attract investors who are seeking a safe-haven.
The tech sector was not hit especially hard on Monday. The Internet Index ($IIX -0.59%), Networking Index ($NWX -0.28%), Biotechnology Index ($BTK -0.27%) and Semiconductor Index ($SOX -0.17%) avoided major setbacks.
Charts courtesy www.stockcharts.com
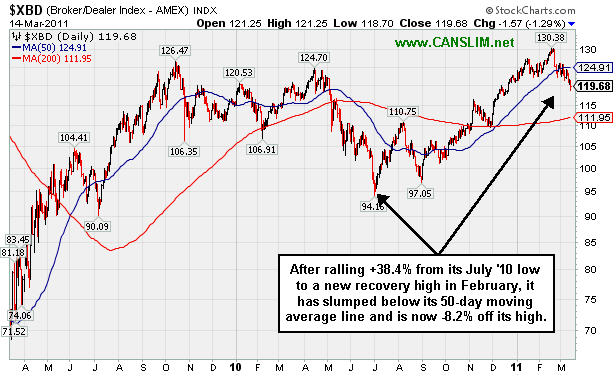
PICTURED: The Broker/Dealer Index ($XBD -1.29%), after rallying +38.4% from is July '10 low to its latest peak, is now -8.2% off its recovery high after slumping below its 50-day moving average (DMA) line. Investors should be most concerned with individual stocks and their relationship with their 50 DMA lines. Indexes, by their nature, move more gradually than individual issues. By the time any index crosses an important moving average, you can bet that many of its individual components have done so.
| Oil Services |
$OSX |
278.66 |
+0.57 |
+0.20% |
+13.68% |
| Healthcare |
$HMO |
2,035.16 |
-24.39 |
-1.18% |
+20.28% |
| Integrated Oil |
$XOI |
1,315.83 |
+0.94 |
+0.07% |
+8.46% |
| Semiconductor |
$SOX |
427.17 |
-0.74 |
-0.17% |
+3.73% |
| Networking |
$NWX |
320.97 |
-0.87 |
-0.27% |
+14.41% |
| Internet |
$IIX |
309.84 |
-1.82 |
-0.58% |
+0.69% |
| Broker/Dealer |
$XBD |
119.69 |
-1.56 |
-1.29% |
-1.50% |
| Retail |
$RLX |
503.57 |
-5.09 |
-1.00% |
-0.95% |
| Gold & Silver |
$XAU |
206.39 |
-0.42 |
-0.20% |
-8.91% |
| Bank |
$BKX |
52.12 |
-0.43 |
-0.82% |
-0.17% |
| Biotech |
$BTK |
1,281.92 |
-3.34 |
-0.26% |
-1.21% |
|
|
|
 |
Correction Also Hurts Stocks With Strong Fundamentals
Kenneth J. Gruneisen - Passed the CAN SLIM® Master's Exam
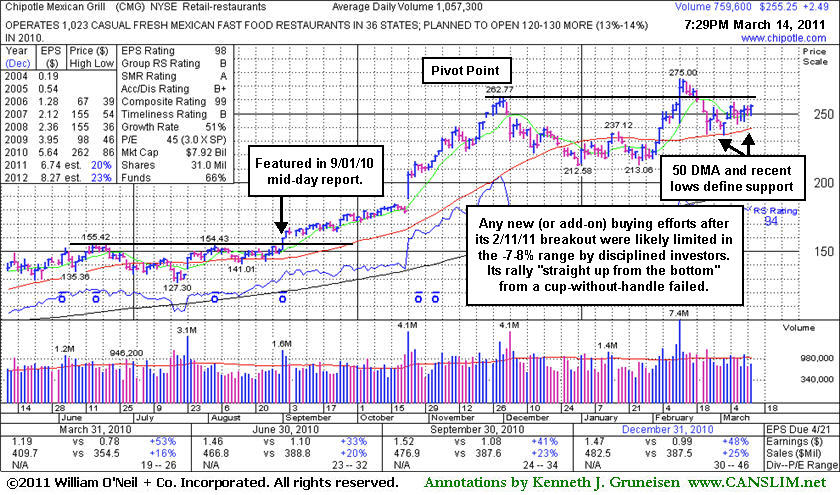
Chipotle Mexican Grill, Inc. (CMG +$2.49 or +0.99% to $255.25) managed to make a positive reversal today after initially gapping down. It was a reassuring sign that it found support above its 50-day moving average (DMA) line and prior highs in the $237 area recently. Subsequent violations and damaging losses would raise greater concerns and trigger technical sell signals. Meanwhile, it may eventually form a new flat base or other bullish pattern. An overriding concern to worry more about now may be the M criteria, which recently has argued against new buying efforts, since 3 out of 4 stocks follow the direction of the major averages.
Any new (or add-on) buying efforts after its 2/11/11 breakout were likely limited to fresh losses in the -7-8% range by disciplined investors. Its rally "straight up from the bottom" from a cup-without-handle failed. In the stock's last appearance in this FSU section under the headline "A 'Straight Up From The Bottom' Breakout " an annotated graph showed it rising from an 11-week cup-shaped base without a handle. That article also discussed the tactic of properly pyramiding into a position with multiple purchases per the investment system guidelines. It also reminded investors - "The usual sell rules apply, as disciplined investors know to alway limit losses by selling if a stock falls -7% or more from your buy price."
CMG currently has an B+ rating for Accumulation/Distribution. Ownership by top-rated funds rose from 530 in Mar '10 to 639 in Dec '10, a nice reassurance concerning the I criteria of the investment system. Sales revenues increases have shown acceleration while up +12%, +16%, +20%, +23%, and now +25% in the streak of latest quarterly comparisons while the C criteria is satisfied by ongoing earnings increases above the +25% guideline. It also has a good annual (A criteria) earnings history. Despite a stock's strong fundamentals, investors must always be cautious not to let losses accumulate or grow out of control, and they should never average down by buying more shares at a lower price than an initial buy point.
|
|
|
Color Codes Explained :
Y - Better candidates highlighted by our
staff of experts.
G - Previously featured
in past reports as yellow but may no longer be buyable under the
guidelines.
***Last / Change / Volume data in this table is the closing quote data***
Symbol/Exchange
Company Name
Industry Group |
PRICE |
CHANGE
(%Change) |
Day High |
Volume
(% DAV)
(% 50 day avg vol) |
52 Wk Hi
% From Hi |
Featured
Date |
Price
Featured |
Pivot Featured |
|
Max Buy |
BIDU
-
NASDAQ
Baidu Inc Ads
INTERNET - Internet Information Providers
|
$124.06
|
-0.90
-0.72% |
$125.40
|
6,233,156
94.26% of 50 DAV
50 DAV is 6,612,500
|
$131.63
-5.75%
|
2/1/2011
|
$117.74
|
PP = $112.08
|
|
MB = $117.68
|
Most Recent Note - 3/11/2011 4:15:26 PM
G - Positive action this week was reassuring in the face of widespread market weakness. Consolidating above its 50 DMA line and recent chart low defining important chart support to watch. See latest FSU analysis for details and a new annotated graph.
>>> The latest Featured Stock Update with an annotated graph appeared on 3/9/2011. Click here.
View all notes |
Alert me of new notes |
CANSLIM.net Company Profile |
SEC |
Zacks Reports |
StockTalk |
News |
Chart |
Request a new note
C
A N
S L
I M


|
CMG
-
NYSE
Chipotle Mexican Grill
LEISURE - Restaurants
|
$255.25
|
+2.49
0.99% |
$256.85
|
759,629
73.06% of 50 DAV
50 DAV is 1,039,700
|
$275.00
-7.18%
|
2/11/2011
|
$271.15
|
PP = $262.87
|
|
MB = $276.01
|
 Most Recent Note - 3/14/2011 8:42:27 PM
G - Positive reversal today was a reassuring sign while consolidating above support at its 50 DMA line and prior highs in the $237 area. Violations and damaging losses would raise greater concerns and trigger technical sell signals. See the latest FSU analysis for more details and a new annotated graph.
>>> The latest Featured Stock Update with an annotated graph appeared on 3/14/2011. Click here.
View all notes |
Alert me of new notes |
CANSLIM.net Company Profile |
SEC |
Zacks Reports |
StockTalk |
News |
Chart |
Request a new note
C
A N
S L
I M
|
CRUS
-
NASDAQ
Cirrus Logic Inc
ELECTRONICS - Semiconductor - Specialized
|
$21.83
|
+0.83
3.95% |
$22.63
|
4,052,111
112.47% of 50 DAV
50 DAV is 3,602,800
|
$25.48
-14.32%
|
1/28/2011
|
$20.69
|
PP = $19.17
|
|
MB = $20.13
|
Most Recent Note - 3/14/2011 1:36:20 PM
G - Rising today with higher volume, a reassuring sign after finding prompt support near its 50 DMA line last week. Further deterioration below its 50 DMA and below the previously noted high close ($20.54 on 7/26/10) would raise more serious concerns.
>>> The latest Featured Stock Update with an annotated graph appeared on 3/4/2011. Click here.
View all notes |
Alert me of new notes |
CANSLIM.net Company Profile |
SEC |
Zacks Reports |
StockTalk |
News |
Chart |
Request a new note
C
A N
S L
I M
|
CTSH
-
NASDAQ
Cognizant Tech Sol Cl A
COMPUTER SOFTWARE and SERVICES - Business Software and Services
|
$75.37
|
-1.00
-1.31% |
$76.30
|
1,245,081
55.03% of 50 DAV
50 DAV is 2,262,700
|
$78.69
-4.22%
|
2/7/2011
|
$75.09
|
PP = $76.46
|
|
MB = $80.28
|
Most Recent Note - 3/14/2011 7:12:22 PM
Y - Down today with below average volume, testing support at its 50 DMA line. Any violation of its short-term average and subsequent breach of its recent chart low ($73.25 on 2/23/11) would be more worrisome signs of damaging distributional pressure.
>>> The latest Featured Stock Update with an annotated graph appeared on 2/8/2011. Click here.
View all notes |
Alert me of new notes |
CANSLIM.net Company Profile |
SEC |
Zacks Reports |
StockTalk |
News |
Chart |
Request a new note
C
A N
S L
I M
|
DECK
-
NASDAQ
Deckers Outdoor Corp
CONSUMER NON-DURABLES - Textile - Apparel Footwear
|
$83.23
|
-1.00
-1.19% |
$84.45
|
603,713
38.09% of 50 DAV
50 DAV is 1,585,000
|
$94.70
-12.11%
|
2/3/2011
|
$79.61
|
PP = $82.67
|
|
MB = $86.80
|
Most Recent Note - 3/10/2011 4:00:35 PM
G - Down today on light volume, slumping near support at its pivot point and 50 DMA line.
>>> The latest Featured Stock Update with an annotated graph appeared on 3/3/2011. Click here.
View all notes |
Alert me of new notes |
CANSLIM.net Company Profile |
SEC |
Zacks Reports |
StockTalk |
News |
Chart |
Request a new note
C
A N
S L
I M
|
Symbol/Exchange
Company Name
Industry Group |
PRICE |
CHANGE
(%Change) |
Day High |
Volume
(% DAV)
(% 50 day avg vol) |
52 Wk Hi
% From Hi |
Featured
Date |
Price
Featured |
Pivot Featured |
|
Max Buy |
EBIX
-
NASDAQ
Ebix Inc
COMPUTER SOFTWARE and SERVICES - Business Software and Services
|
$27.39
|
-0.74
-2.63% |
$28.66
|
1,215,789
222.75% of 50 DAV
50 DAV is 545,800
|
$29.61
-7.50%
|
2/28/2011
|
$25.70
|
PP = $25.97
|
|
MB = $27.27
|
Most Recent Note - 3/14/2011 12:57:04 PM
G - Down today with heavier volume, and wider than usual intra-day swings are a sign of uncertainty as the distributional action raises concerns. Prior highs in the $25-26 area define important chart support to watch along with its 50 DMA line.
>>> The latest Featured Stock Update with an annotated graph appeared on 2/28/2011. Click here.
View all notes |
Alert me of new notes |
CANSLIM.net Company Profile |
SEC |
Zacks Reports |
StockTalk |
News |
Chart |
Request a new note
C
A N
S L
I M
|
EZCH
-
NASDAQ
Ezchip Semiconductor Ltd
ELECTRONICS - Semiconductor - Specialized
|
$28.54
|
+0.10
0.35% |
$28.63
|
305,388
77.92% of 50 DAV
50 DAV is 391,900
|
$33.48
-14.76%
|
12/2/2010
|
$27.53
|
PP = $26.00
|
|
MB = $27.30
|
Most Recent Note - 3/14/2011 7:23:30 PM
G - Finished near the session high today after a positive reversal following a small gap down. Its 50 DMA line recently has acted as resistance, and it faces some overhead supply up through the $33 area. More damaging losses would raise greater concerns. Its chart has the ominous look of a head-and-shoulders top with a neckline at $27.00 above its rising 200 DMA line.
>>> The latest Featured Stock Update with an annotated graph appeared on 3/1/2011. Click here.
View all notes |
Alert me of new notes |
CANSLIM.net Company Profile |
SEC |
Zacks Reports |
StockTalk |
News |
Chart |
Request a new note
C
A N
S L
I M
|
EZPW
-
NASDAQ
Ezcorp Inc Cl A
SPECIALTY RETAIL - Specialty Retail, Other
|
$27.46
|
-0.13
-0.47% |
$27.76
|
225,259
60.86% of 50 DAV
50 DAV is 370,100
|
$29.94
-8.28%
|
2/18/2011
|
$27.94
|
PP = $30.04
|
|
MB = $31.54
|
Most Recent Note - 3/10/2011 2:49:53 PM
G - Color code is changed to green while today's loss violating its 50 DMA line raises concerns. Gains with heavy volume above its latest pivot point have not shown up to provide the critical proof of institutional buying demand, meanwhile the recent low ($25.56 on 1/25/11) defines an important support level.
>>> The latest Featured Stock Update with an annotated graph appeared on 3/10/2011. Click here.
View all notes |
Alert me of new notes |
CANSLIM.net Company Profile |
SEC |
Zacks Reports |
StockTalk |
News |
Chart |
Request a new note
C
A N
S L
I M
|
FOSL
-
NASDAQ
Fossil Inc
CONSUMER DURABLES - Recreational Goods, Other
|
$82.43
|
-0.12
-0.15% |
$82.72
|
724,871
79.85% of 50 DAV
50 DAV is 907,800
|
$85.20
-3.25%
|
2/1/2011
|
$73.30
|
PP = $74.44
|
|
MB = $78.16
|
Most Recent Note - 3/10/2011 4:12:01 PM
G - Paused at its all-time high today after 6 consecutive gains, extended from its prior base. It found support at its 50 DMA line while consolidating above prior resistance in the $74 area.
>>> The latest Featured Stock Update with an annotated graph appeared on 2/24/2011. Click here.
View all notes |
Alert me of new notes |
CANSLIM.net Company Profile |
SEC |
Zacks Reports |
StockTalk |
News |
Chart |
Request a new note
C
A N
S L
I M
|
HMSY
-
NASDAQ
H M S Holdings Corp
COMPUTER SOFTWARE and SERVICES - Healthcare Information Service
|
$79.36
|
-0.01
-0.01% |
$79.80
|
116,340
69.58% of 50 DAV
50 DAV is 167,200
|
$81.36
-2.46%
|
11/19/2010
|
$61.89
|
PP = $63.01
|
|
MB = $66.16
|
Most Recent Note - 3/10/2011 4:01:49 PM
G - Perched near its all-time high after a spurt of gains, extended from any sound base pattern. Support to watch is defined by prior chart highs and its 50 DMA line in the $67 area.
>>> The latest Featured Stock Update with an annotated graph appeared on 2/16/2011. Click here.
View all notes |
Alert me of new notes |
CANSLIM.net Company Profile |
SEC |
Zacks Reports |
StockTalk |
News |
Chart |
Request a new note
C
A N
S L
I M
|
Symbol/Exchange
Company Name
Industry Group |
PRICE |
CHANGE
(%Change) |
Day High |
Volume
(% DAV)
(% 50 day avg vol) |
52 Wk Hi
% From Hi |
Featured
Date |
Price
Featured |
Pivot Featured |
|
Max Buy |
JOBS
-
NASDAQ
Fifty One Job Inc Ads
DIVERSIFIED SERVICES - Staffing and; Outsourcing Service
|
$55.59
|
-0.98
-1.73% |
$56.64
|
142,147
108.68% of 50 DAV
50 DAV is 130,800
|
$64.55
-13.88%
|
2/7/2011
|
$59.23
|
PP = $61.38
|
|
MB = $64.45
|
Most Recent Note - 3/14/2011 7:08:15 PM
G - Slumped below its 50 DMA line today while resilience would have been a more reassuring sign of support from institutional investors. Its recent low ($52.58 on 1/28/11) was previously noted as a support level where a subsequent violation may trigger a more worrisome technical sell signal.
>>> The latest Featured Stock Update with an annotated graph appeared on 3/11/2011. Click here.
View all notes |
Alert me of new notes |
CANSLIM.net Company Profile |
SEC |
Zacks Reports |
StockTalk |
News |
Chart |
Request a new note
C
A N
S L
I M
|
LULU
-
NASDAQ
Lululemon Athletica
MANUFACTURING - Textile Manufacturing
|
$78.24
|
+1.74
2.27% |
$79.73
|
2,302,565
117.97% of 50 DAV
50 DAV is 1,951,800
|
$85.28
-8.26%
|
1/26/2011
|
$68.11
|
PP = $74.70
|
|
MB = $78.44
|
Most Recent Note - 3/14/2011 1:39:13 PM
Y - Up today with volume increasing after making a stand at its 50 DMA line, a classic chart support level. As previously noted - "A close below a significant prior high close ($73.51 on 12/21/10) would completely negate its latest breakout, raising more serious concerns."
>>> The latest Featured Stock Update with an annotated graph appeared on 2/25/2011. Click here.
View all notes |
Alert me of new notes |
CANSLIM.net Company Profile |
SEC |
Zacks Reports |
StockTalk |
News |
Chart |
Request a new note
C
A N
S L
I M
|
MWIV
-
NASDAQ
M W I Veterinary Supply
HEALTH SERVICES - Medical Instruments and; Supplies
|
$76.29
|
-0.38
-0.50% |
$77.47
|
124,819
156.02% of 50 DAV
50 DAV is 80,000
|
$78.48
-2.79%
|
11/4/2010
|
$61.79
|
PP = $59.60
|
|
MB = $62.58
|
Most Recent Note - 3/11/2011 4:25:53 PM
G - Perched at its all-time high, holding its ground following a streak of gains with above average volume. Found support near prior highs and its 50 DMA line recently but did not build a sound new base pattern. See the latest FSU analysis for more details and a new annotated graph.
>>> The latest Featured Stock Update with an annotated graph appeared on 3/8/2011. Click here.
View all notes |
Alert me of new notes |
CANSLIM.net Company Profile |
SEC |
Zacks Reports |
StockTalk |
News |
Chart |
Request a new note
C
A N
S L
I M
|
OPEN
-
NASDAQ
Opentable Inc
INTERNET - Internet Software and Services
|
$88.62
|
-2.91
-3.18% |
$90.80
|
1,003,374
91.99% of 50 DAV
50 DAV is 1,090,800
|
$95.97
-7.66%
|
1/5/2011
|
$74.05
|
PP = $76.79
|
|
MB = $80.63
|
Most Recent Note - 3/14/2011 1:27:31 PM
G - Gapped down today after closing the prior week higher despite broader market weakness. Current consolidation of just over 4 weeks has the look of a bullish base-on-base type pattern forming. Support to watch is at its 50 DMA line and prior chart highs.
>>> The latest Featured Stock Update with an annotated graph appeared on 2/15/2011. Click here.
View all notes |
Alert me of new notes |
CANSLIM.net Company Profile |
SEC |
Zacks Reports |
StockTalk |
News |
Chart |
Request a new note
C
A N
S L
I M
|
ORCL
-
NASDAQ
Oracle Corp
COMPUTER SOFTWARE and SERVICES - Application Software
|
$31.59
|
-0.32
-1.00% |
$31.86
|
18,656,522
78.11% of 50 DAV
50 DAV is 23,885,400
|
$33.71
-6.29%
|
1/20/2011
|
$32.31
|
PP = $32.37
|
|
MB = $33.99
|
Most Recent Note - 3/14/2011 1:32:55 PM
G - Color code is changed to green while slumping to its lowest level since 1/20/11 when it was featured in yellow and its latest pivot point was cited. Slumping further below its 50 DMA line, its Relative Strength rank (now 76) has also ratcheted below the 80+ guideline required of proper buy candidates. Prior low previously noted ($30.80 on 1/10/11) defines the next important chart support level to watch.
>>> The latest Featured Stock Update with an annotated graph appeared on 2/22/2011. Click here.
View all notes |
Alert me of new notes |
CANSLIM.net Company Profile |
SEC |
Zacks Reports |
StockTalk |
News |
Chart |
Request a new note
C
A N
S L
I M
|
Symbol/Exchange
Company Name
Industry Group |
PRICE |
CHANGE
(%Change) |
Day High |
Volume
(% DAV)
(% 50 day avg vol) |
52 Wk Hi
% From Hi |
Featured
Date |
Price
Featured |
Pivot Featured |
|
Max Buy |
PAY
-
NYSE
Verifone Systems Inc
COMPUTER HARDWARE - Transaction Automation Systems
|
$47.91
|
-1.09
-2.22% |
$49.40
|
1,517,240
89.80% of 50 DAV
50 DAV is 1,689,500
|
$51.23
-6.48%
|
1/27/2011
|
$41.77
|
PP = $44.97
|
|
MB = $47.22
|
Most Recent Note - 3/14/2011 7:03:17 PM
G - Down today with lighter than average volume, finishing -6.5% below its all-time high. No resistance remains due to overhead supply, but it is extended from a sound base pattern. Its 50 DMA line defines chart support to watch.
>>> The latest Featured Stock Update with an annotated graph appeared on 3/2/2011. Click here.
View all notes |
Alert me of new notes |
CANSLIM.net Company Profile |
SEC |
Zacks Reports |
StockTalk |
News |
Chart |
Request a new note
C
A N
S L
I M
|
PCLN
-
NASDAQ
Priceline.Com Inc
INTERNET - Internet Software and Services
|
$463.61
|
+0.42
0.09% |
$464.50
|
897,770
79.25% of 50 DAV
50 DAV is 1,132,800
|
$474.74
-2.34%
|
1/3/2011
|
$399.55
|
PP = $428.20
|
|
MB = $449.61
|
Most Recent Note - 3/10/2011 10:06:01 AM
G - Hovering near its 52-week high, extended from a sound base. Found impressive support near its 50 DMA line in recent months.
>>> The latest Featured Stock Update with an annotated graph appeared on 2/14/2011. Click here.
View all notes |
Alert me of new notes |
CANSLIM.net Company Profile |
SEC |
Zacks Reports |
StockTalk |
News |
Chart |
Request a new note
C
A N
S L
I M
|
RAX
-
NYSE
Rackspace Hosting Inc
INTERNET - Internet Software and; Services
|
$36.27
|
-0.69
-1.87% |
$37.07
|
1,522,204
82.90% of 50 DAV
50 DAV is 1,836,200
|
$40.62
-10.71%
|
1/10/2011
|
$22.84
|
PP = $32.76
|
|
MB = $34.40
|
Most Recent Note - 3/14/2011 7:14:11 PM
G - Down today with higher (near average) volume amid widespread market weakness. Consolidating just above prior highs near $35 and its 50 DMA line defining chart support to watch.
>>> The latest Featured Stock Update with an annotated graph appeared on 2/9/2011. Click here.
View all notes |
Alert me of new notes |
CANSLIM.net Company Profile |
SEC |
Zacks Reports |
StockTalk |
News |
Chart |
Request a new note
C
A N
S L
I M
|
TIBX
-
NASDAQ
Tibco Software Inc
COMPUTER SOFTWARE and SERVICES - Business Software and Services
|
$23.93
|
-0.04
-0.17% |
$24.47
|
2,456,645
100.58% of 50 DAV
50 DAV is 2,442,600
|
$25.94
-7.75%
|
2/1/2011
|
$24.35
|
PP = $22.18
|
|
MB = $23.29
|
Most Recent Note - 3/10/2011 4:02:40 PM
G - Down today on average volume, finishing -7.8% off its 52-week high. Recently found support above prior highs in the $22 area and well above its 50 DMA line.
>>> The latest Featured Stock Update with an annotated graph appeared on 2/10/2011. Click here.
View all notes |
Alert me of new notes |
CANSLIM.net Company Profile |
SEC |
Zacks Reports |
StockTalk |
News |
Chart |
Request a new note
C
A N
S L
I M
|
UA
-
NYSE
Under Armour Inc Cl A
CONSUMER NON-DURABLES - Textile - Apparel Clothing
|
$68.27
|
-1.18
-1.70% |
$69.14
|
550,518
72.47% of 50 DAV
50 DAV is 759,700
|
$70.69
-3.42%
|
1/27/2011
|
$58.31
|
PP = $56.99
|
|
MB = $59.84
|
Most Recent Note - 3/11/2011 4:20:10 PM
G -Perched at its 52-week high, rising this week amid widespread weakness. Its consolidation has been healthy while forming a base-on-base type pattern. See the latest FSU analysis for more details and a new annotated graph.
>>> The latest Featured Stock Update with an annotated graph appeared on 3/7/2011. Click here.
View all notes |
Alert me of new notes |
CANSLIM.net Company Profile |
SEC |
Zacks Reports |
StockTalk |
News |
Chart |
Request a new note
C
A N
S L
I M
|
Symbol/Exchange
Company Name
Industry Group |
PRICE |
CHANGE
(%Change) |
Day High |
Volume
(% DAV)
(% 50 day avg vol) |
52 Wk Hi
% From Hi |
Featured
Date |
Price
Featured |
Pivot Featured |
|
Max Buy |
ULTA
-
NASDAQ
Ulta Salon Cosm & Frag
SPECIALTY RETAIL - Specialty Retail, Other
|
$46.95
|
+1.18
2.57% |
$47.20
|
1,068,364
197.99% of 50 DAV
50 DAV is 539,600
|
$47.55
-1.26%
|
1/6/2011
|
$36.12
|
PP = $37.34
|
|
MB = $39.21
|
Most Recent Note - 3/14/2011 12:29:53 PM
G - Up today following a gap up gain to new all-time highs on 3/11/11 after reporting earnings +41% on +20% sales revenues for the quarter ended January 31, 2011 versus the year ago period. Its 4-week consolidation was too short to be considered a sound base pattern. Support to watch is at its 50 DMA line and recent chart lows near the $40 level.
>>> The latest Featured Stock Update with an annotated graph appeared on 2/17/2011. Click here.
View all notes |
Alert me of new notes |
CANSLIM.net Company Profile |
SEC |
Zacks Reports |
StockTalk |
News |
Chart |
Request a new note
C
A N
S L
I M
|
|
|
|
THESE ARE NOT BUY RECOMMENDATIONS!
Comments contained in the body of this report are technical
opinions only. The material herein has been obtained
from sources believed to be reliable and accurate, however,
its accuracy and completeness cannot be guaranteed.
This site is not an investment advisor, hence it does
not endorse or recommend any securities or other investments.
Any recommendation contained in this report may not
be suitable for all investors and it is not to be deemed
an offer or solicitation on our part with respect to
the purchase or sale of any securities. All trademarks,
service marks and trade names appearing in this report
are the property of their respective owners, and are
likewise used for identification purposes only.
This report is a service available
only to active Paid Premium Members.
You may opt-out of receiving report notifications
at any time. Questions or comments may be submitted
by writing to Premium Membership Services 665 S.E. 10 Street, Suite 201 Deerfield Beach, FL 33441-5634 or by calling 1-800-965-8307
or 954-785-1121.
|
|
|

