You are not logged in.
This means you
CAN ONLY VIEW reports that were published prior to Monday, April 14, 2025.
You
MUST UPGRADE YOUR MEMBERSHIP if you want to see any current reports.
AFTER MARKET UPDATE - FRIDAY, MARCH 12TH, 2010
Previous After Market Report Next After Market Report >>>
|
|
|
|
DOW |
+12.85 |
10,624.69 |
+0.12% |
|
Volume |
1,051,830,290 |
+7% |
|
Volume |
2,040,084,360 |
-8% |
|
NASDAQ |
-0.80 |
2,367.66 |
-0.03% |
|
Advancers |
1,654 |
53% |
|
Advancers |
1,222 |
43% |
|
S&P 500 |
-0.25 |
1,149.99 |
-0.02% |
|
Decliners |
1,370 |
44% |
|
Decliners |
1,479 |
52% |
|
Russell 2000 |
-0.63 |
676.59 |
-0.09% |
|
52 Wk Highs |
436 |
|
|
52 Wk Highs |
194 |
|
|
S&P 600 |
+0.06 |
358.93 |
+0.02% |
|
52 Wk Lows |
2 |
|
|
52 Wk Lows |
7 |
|
|
 |
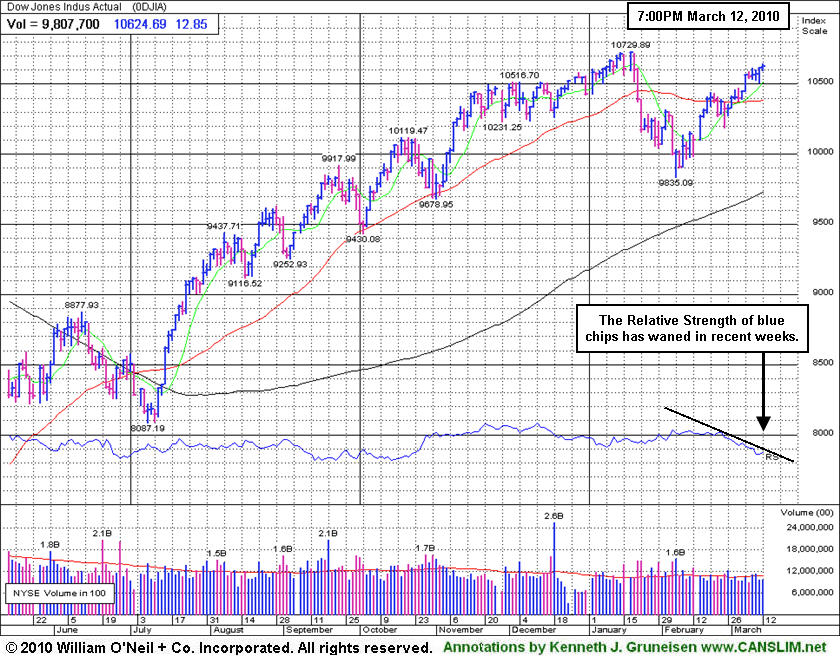
Dow Industrial Average Posts Gain But Recently Lagging
Adam Sarhan, Contributing Writer,
The major averages ended mixed as volume rose on the NYSE compared to the prior session but Nasdaq volume was reported down from Thursday's total. Advancers led decliners by a 8-to-7 ratio on the NYSE but trailed by a 6-to-7 ratio on the Nasdaq exchange. There were 58 high-ranked companies from the CANSLIM.net Leaders List that made a new 52-week high and appeared on the CANSLIM.net BreakOuts Page, up from the 35 issues that appeared on the prior session. New 52-week highs again overwhelmingly trumped new lows on both exchanges.
Stocks ended mixed on Monday as President Obama gave what appeared to be a final push to overhaul our troubled health-care system. Tuesday marked the one year anniversary of the March 2009 closing low in the benchmark S&P 500. A follow-through day (FTD) was produced on March 12, 2009 which helped confirm the rally which sent the benchmark average soaring +68% in the span of 12 months. Stocks edged higher on Wednesday which marked the tenth anniversary of 2000's dot-com bubble. The government said the US budget deficit widened to a record last month. Government spending was the primary culprit as the government continues to try and revive the economy.
Stocks rose on Thursday after China said inflation rose +2.7% in February, up from +1.5% in January. For the past few months, China has taken several steps to curb inflation and its robust economy. Their actions sent stocks lower as many people were concerned about what the ramifications would be for the ongoing economic recovery. Therefore, the higher reading on inflation could cause China to raise interest rates which could, in turn, hinder the economic recovery. In the US, two important economic reports were released: weekly jobless claims and the latest trade data. The Labor Department said weekly jobless claims fell by 6,000 to 462,000 which was a positive sign. Elsewhere, the Commerce Department said the trade deficit contracted in January due to a large drop in imported oil and cars. The report showed that US exports slid -0.3% which was concerning because the drop in overseas sales could slow the recovery.
Looking at the market, since the March 1, follow-through-day (FTD) the market and a batch of leading stocks steadily rallied. The fact that we have not seen any serious distribution days since the FTD bodes well for this nascent rally. It is also a welcome sign to see the market continue to improve as investors digest the latest round of stronger than expected economic and earnings data.Remember that now that a new rally has been confirmed, the window is open to start buying high quality breakouts. Trade accordingly.
Professional Money Management Services - A Winning System - Inquire today!
Our skilled team of portfolio managers knows how to follow the rules of this fact-based investment system. We do not follow opinion or the "conviction list" of some large Wall Street institution which would have us fully invested even during horrific bear markets. Instead, we remain fluid and only buy the best stocks when they are triggering proper technical buy signals. If you are not completely satisfied with the way your portfolio is being managed, Click here to get connected with one of our portfolio managers. *Accounts over $250,000 please. ** Serious inquires only, please
PICTURED: The Dow Jones Industrial Average posted a small gain on Friday and led its peers, but its Relative Strength has been waning in recent weeks while small-caps have shown leadership.
|
|
|
 |
Retail Index Bucks Mostly Negative Group Action
Kenneth J. Gruneisen - Passed the CAN SLIM® Master's Exam
The Retail Index ($RLX +0.57%) and Oil Services Index ($OSX +0.71%) posted gains on Friday while most group indices backpedaled. Defensive areas pulled back as the Healthcare Index ($HMO -1.39%) and Gold & Silver Index ($XAU -0.72%) edged lower. Financial shares showed slight weakness as the Bank Index ($BKX -0.90%) and Broker/Dealer Index ($XBD -0.28%) each fell less than -1%. The tech sector saw mild but unanimous losses from the Networking Index ($NWX -0.67%), Semiconductor Index ($SOX -0.50%), Biotechnology Index ($BTK -0.45%), and Internet Index ($IIX -0.24%).
Charts courtesy www.stockcharts.com
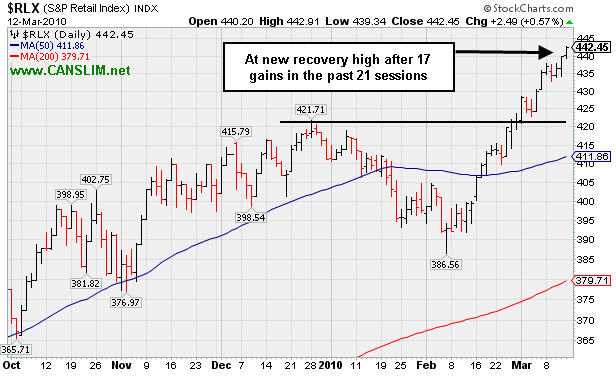
PICTURED: The Retail Index ($RLX +0.57%) is at a new recovery high after 17 gains in the past 21 sessions. Apparently the consumer is still alive!
| Oil Services |
$OSX |
212.65 |
+1.50 |
+0.71% |
+9.10% |
| Healthcare |
$HMO |
1,469.94 |
-20.67 |
-1.39% |
-0.20% |
| Integrated Oil |
$XOI |
1,073.90 |
-0.71 |
-0.07% |
+0.53% |
| Semiconductor |
$SOX |
355.37 |
-1.79 |
-0.50% |
-1.26% |
| Networking |
$NWX |
256.34 |
-1.72 |
-0.67% |
+10.94% |
| Internet |
$IIX |
245.65 |
-0.59 |
-0.24% |
+5.04% |
| Broker/Dealer |
$XBD |
118.87 |
-0.33 |
-0.28% |
+3.32% |
| Retail |
$RLX |
442.45 |
+2.49 |
+0.57% |
+7.62% |
| Gold & Silver |
$XAU |
166.04 |
-1.20 |
-0.72% |
-1.31% |
| Bank |
$BKX |
50.46 |
-0.46 |
-0.90% |
+18.15% |
| Biotech |
$BTK |
1,228.04 |
-5.54 |
-0.45% |
+30.35% |
|
|
|
 |
Strong Earnings Increases Help Leader Meet Key Criteria
Kenneth J. Gruneisen - Passed the CAN SLIM® Master's Exam
| Ulta Salon Cosmetics & Fragrance, Inc. |
CLICK HERE to see the Profile Page for this stock with current details and historic information |
|
Ticker Symbol: ULTA (NASDAQ) |
Industry Group: Retail - Miscellaneous |
Shares Outstanding: 58,100,000 |
|
Price: $22.80 3/12/2010 2:04PM |
Day's Volume: 1,398,400 2:04PM |
Shares in Float: 28,500,000 |
|
52 Week High: $21.74 3/08/2010 |
50-Day Average Volume: 337,800 |
Up/Down Volume Ratio: 1.4 |
|
Pivot Point: $21.72 1/08/2010 (high plus $0.10) |
Pivot Point +5% = Max Buy Price: $22.81 |
Web Address: http://www.ulta.com/
|
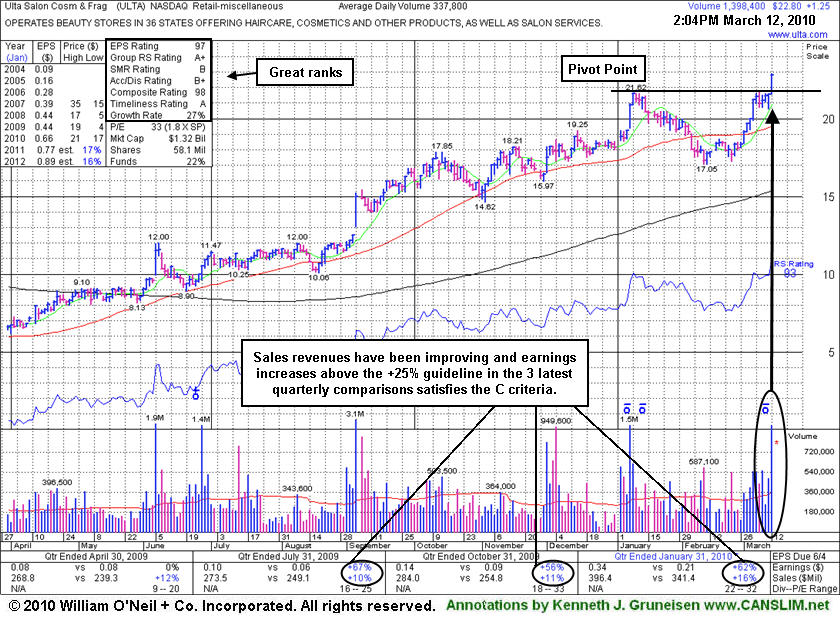
CANSLIM.net Profile: Ulta Salon Cosmetics & Fragrance, Inc. (ULTA) is a high-ranked leader in the Retail - Misc group which has shown accelerating sales revenues increases. Strong quarterly earnings increases above the +25% guideline in the 3 latest quarterly comparisons satisfies the C criteria. The stock resides in the Retail - Miscellaneous group which has a current Relative Strength rank of 93, indicating leadership that helps satisfy the L criteria. The number of top-rated funds with an ownership interest has grown from 49 funds in March '09 to 72 funds as of Dec '09 which is an encouraging sign of increasing institutional interest (the I criteria). Management's 51% ownership stake keeps the company's directors very motivated to look after and build shareholder value.
What to Look For and What to Look Out For: The stock is currently trading near its "maximum buy" price after a considerable gain today on heavy volume, a strong technical move in response to its improving fundamentals. Patience may allow its shares to be accumulated on light volume pullbacks toward its prior chart highs which are now an important support level to watch. Healthy stocks typically pull back and retest prior chart highs about 40% of the time before finding support and continuing higher. In bull markets they rarely will dip more than 7% below their pivot points. Near earnings news, investors may expect that volume and price action can be very volatile, and any reversal into its prior base would raise concerns. It is important to remain disciplined. Chasing it after it trades above its maximum buy price of $22.80 may not be a prudent move. The bulls remain in control as long as this stock continues trading above its pivot point.
Technical Analysis: It was featured in the mid-day report today (read here) as a considerable gain with heavy volume helped it reach a new 52-week high, rising from an 8-week cup shaped base following strong results for the quarter ended January 31, 2010. It was color coded yellow with a pivot point cited based on its 1/08/10 high plus ten cents. It has rallied from March '09 lows near $4, and it has encountered little distributional pressure during that period. Meanwhile it has shown numerous weekly gains with above average volume, including the 2 latest weeks while rallying from a consolidation below its 50-day moving average. It now faces no resistance due to overhead supply. |
|
|
Color Codes Explained :
Y - Better candidates highlighted by our
staff of experts.
G - Previously featured
in past reports as yellow but may no longer be buyable under the
guidelines.
***Last / Change / Volume quote data in this table corresponds with the timestamp on the note***
Symbol/Exchange
Company Name
Industry Group |
Last |
Chg. |
Vol
% DAV |
Date Featured |
Price Featured |
Latest Pivot Point
Featured |
Status |
| Latest Max Buy Price |
ARUN
- NASDAQ
Aruba Networks Inc
COMPUTER HARDWARE - Networking & Communication Dev
|
$13.13
|
-0.16
|
1,179,832
80% DAV
1,467,800
|
2/19/2010
(Date
Featured) |
$12.71
(Price
Featured) |
PP = $11.94 |
G |
| MB = $12.54 |
Most Recent Note - 3/12/2010 7:12:10 PM
G - Holding its ground stubbornly, quietly consolidating after recent gains, perched near its 52-week high, extended from its prior base. Support to watch is now defined by prior chart highs and its 50 DMA line. ARUN was featured in the mid-day report on 2/19/10 as it rose from a flat base-on-base pattern above its 50-day moving average line (read here).
>>> The latest Featured Stock Update with an annotated graph appeared on 3/11/2010. click here.
|
|
C
A
S
I |
News |
Chart |
SEC
View all notes Alert
me of new notes
Company
Profile
|
BIDU
- NASDAQ
Baidu Inc Ads
INTERNET - Internet Information Providers
|
$550.24
|
-3.86
|
1,447,876
74% DAV
1,956,700
|
1/13/2010
(Date
Featured) |
$431.25
(Price
Featured) |
PP = $426.75 |
G |
| MB = $448.09 |
Most Recent Note - 3/12/2010 7:12:28 PM
G - Small loss today on light volume after wedging up for 4 consecutive gains on light volume to all-time highs. Steadily rising without an above average volume session in 4 weeks. Its prior chart high near $470 is the nearest support level while it is extended above its mid-January highs. It rose steadily since the 2/10/10 gap up gain with more than 3 times average volume.
>>> The latest Featured Stock Update with an annotated graph appeared on 3/4/2010. click here.
|
|
C
A
S
I |
News |
Chart |
SEC
View all notes Alert
me of new notes
Company
Profile
|
BRLI
- NASDAQ
Bio Reference Labs Inc
HEALTH SERVICES - Medical Laboratories & Researc
|
$45.02
|
-0.43
|
98,386
101% DAV
97,200
|
2/12/2010
(Date
Featured) |
$39.02
(Price
Featured) |
PP = $40.97 |
G |
| MB = $43.02 |
Most Recent Note - 3/12/2010 7:12:55 PM
G - Negatively reversed after an early gain today for a new high. It is extended from its prior base. With no overhead supply, its weekly chart is marked by many up weeks with above average volume and few down weeks on volume -very bullish characteristics. This high-ranked Medical-Dental - Services firm was featured in yellow in the 2/12/10 mid-day report (read here).
>>> The latest Featured Stock Update with an annotated graph appeared on 3/1/2010. click here.
|
|
C
A
S
I |
News |
Chart |
SEC
View all notes Alert
me of new notes
Company
Profile
|
CACC
- NASDAQ
Credit Acceptance Corp
FINANCIAL SERVICES - Credit Services
|
$43.61
|
-0.34
|
30,838
53% DAV
58,700
|
9/29/2009
(Date
Featured) |
$33.48
(Price
Featured) |
PP = $37.10 |
G |
| MB = $38.96 |
Most Recent Note - 3/12/2010 7:13:05 PM
G - Posted a small loss on very light volume today, remaining below its 50 DMA line which has been acting as resistance. Recent lows in the $38 area are a nearby chart support level to watch.
>>> The latest Featured Stock Update with an annotated graph appeared on 3/2/2010. click here.
|
|
C
A
S
I |
News |
Chart |
SEC
View all notes Alert
me of new notes
Company
Profile
|
CISG
- NASDAQ
Cninsure Inc Ads
INSURANCE - Insurance Brokers
|
$25.51
|
-0.01
|
233,854
110% DAV
213,200
|
3/3/2010
(Date
Featured) |
$24.38
(Price
Featured) |
PP = $23.10 |
G |
| MB = $24.26 |
Most Recent Note - 3/12/2010 7:13:13 PM
G - Held its ground stubbornly this week, perched near its 52-week high with no overhead supply to act as resistance. It rose from a 20-week double bottom base with 8 times average volume as it was featured in the 3/03/10 mid-day report (read here).
>>> The latest Featured Stock Update with an annotated graph appeared on 3/3/2010. click here.
|
|
C
A
S
I |
News |
Chart |
SEC
View all notes Alert
me of new notes
Company
Profile
|
CRM
- NYSE
Salesforce.com Inc
INTERNET - Internet Software & Services
|
$75.71
|
+0.29
|
1,035,047
50% DAV
2,070,200
|
3/5/2010
(Date
Featured) |
$72.28
(Price
Featured) |
PP = $75.53 |
Y |
| MB = $79.31 |
Most Recent Note - 3/12/2010 7:13:17 PM
Y - A 7th consecutive gain today came with very light volume for a new high close just above its pivot point, wedging higher from a 9-week base. Its 50 DMA line and recent chart low ($64.77 on 2/25/10) define important support.
>>> The latest Featured Stock Update with an annotated graph appeared on 3/5/2010. click here.
|
|
C
A
S
I |
News |
Chart |
SEC
View all notes Alert
me of new notes
Company
Profile
|
CTRP
- NASDAQ
Ctrip.com Intl Ltd Adr
LEISURE - Resorts & Casinos
|
$38.65
|
-0.15
|
871,478
40% DAV
2,167,400
|
3/1/2010
(Date
Featured) |
$38.23
(Price
Featured) |
PP = $38.50 |
Y |
| MB = $40.43 |
Most Recent Note - 3/12/2010 7:13:48 PM
Y - Quietly held its ground this week while hovering near its 52-week highs above its pivot point. Completed an offering of additional shares on 3/03/10, shortly after featured in the March 2010 issue of CANSLIM.net News (read here). A gain above its pivot point or its most recent chart highs is still needed to confirm a fresh technical buy signal with +50% above average volume or more.
>>> The latest Featured Stock Update with an annotated graph appeared on 2/28/2010. click here.
|
|
C
A
S
I |
News |
Chart |
SEC
View all notes Alert
me of new notes
Company
Profile
|
EZPW
- NASDAQ
Ezcorp Inc Cl A
SPECIALTY RETAIL - Specialty Retail, Other
|
$21.97
|
+0.45
|
515,609
106% DAV
486,500
|
2/19/2010
(Date
Featured) |
$19.03
(Price
Featured) |
PP = $18.80 |
G |
| MB = $19.74 |
Most Recent Note - 3/12/2010 7:13:59 PM
G - Gain today for a new high close. Extended from any sound base of support, its prior chart highs in the $18 area define an important support level to watch. Featured in yellow in the 2/19/10 mid-day report (read here).
>>> The latest Featured Stock Update with an annotated graph appeared on 3/8/2010. click here.
|
|
C
A
S
I |
News |
Chart |
SEC
View all notes Alert
me of new notes
Company
Profile
|
GMCR
- NASDAQ
Green Mtn Coffee Roastrs
FOOD & BEVERAGE - Processed & Packaged Goods
|
$92.65
|
+0.29
|
532,907
39% DAV
1,357,900
|
2/26/2010
(Date
Featured) |
$84.39
(Price
Featured) |
PP = $88.75 |
Y |
| MB = $93.19 |
Most Recent Note - 3/12/2010 7:14:07 PM
Y - Posted a third consecutive gain on light volume today. Hovering near all-time highs since its gain on 3/08/10 triggered a new technical buy signal. Initial support to watch now would be prior chart highs in the $86-88 area.
>>> The latest Featured Stock Update with an annotated graph appeared on 3/12/2010. click here.
|
|
C
A
S
I |
News |
Chart |
SEC
View all notes Alert
me of new notes
Company
Profile
|
ISRG
- NASDAQ
Intuitive Surgical Inc
HEALTH SERVICES - Medical Appliances & Equipment
|
$358.90
|
+1.10
|
398,856
78% DAV
508,100
|
1/22/2010
(Date
Featured) |
$340.40
(Price
Featured) |
PP = $314.00 |
G |
| MB = $329.70 |
Most Recent Note - 3/12/2010 7:14:21 PM
G - Consolidated this week in a tight range, perched quietly near all-time highs. Prior chart highs near $346 are now a support level to watch. ISRG was featured at $340.40 in the 1/22/10 mid-day report following a powerful breakaway gap (read here).
>>> The latest Featured Stock Update with an annotated graph appeared on 2/24/2010. click here.
|
|
C
A
S
I |
News |
Chart |
SEC
View all notes Alert
me of new notes
Company
Profile
|
PCLN
- NASDAQ
Priceline.com Inc
INTERNET - Internet Software & Services
|
$399.55
|
-4.72
|
584,812
N/A
|
11/1/2002
(Date
Featured) |
$399.55
(Price
Featured) |
PP = $428.20 |
Y |
| MB = $449.61 |
Most Recent Note - 1/2/2011
Y - Returns to Featured Stocks list with its appearance in the January 2011 CANSLIM.net News including detailed analysis and annotated daily and weekly graphs.
>>> The latest Featured Stock Update with an annotated graph appeared on 3/10/2010. click here.
|
|
C
A
S
I |
News |
Chart |
SEC
View all notes Alert
me of new notes
Company
Profile
|
PEGA
- NASDAQ
Pegasystems Inc
COMPUTER SOFTWARE & SERVICES - Business Software & Services
|
$36.83
|
+0.26
|
179,331
88% DAV
204,600
|
2/26/2010
(Date
Featured) |
$36.00
(Price
Featured) |
PP = $38.55 |
Y |
| MB = $40.48 |
Most Recent Note - 3/12/2010 7:16:06 PM
Y - Quietly consolidating in a tight range within very close striking distance of its pivot point. Recently found support at its 50 DMA line, while prior chart lows in the $32 area are the next support level.
>>> The latest Featured Stock Update with an annotated graph appeared on 2/26/2010. click here.
|
|
C
A
S
I |
News |
Chart |
SEC
View all notes Alert
me of new notes
Company
Profile
|
ROVI
- NASDAQ
Rovi Corp
COMPUTER SOFTWARE & SERVICES - Security Software & Services
|
$37.82
|
+0.82
|
8,711,545
749% DAV
1,163,300
|
2/25/2010
(Date
Featured) |
$33.54
(Price
Featured) |
PP = $34.87 |
G |
| MB = $36.61 |
Most Recent Note - 3/12/2010 7:16:21 PM
G - Posted a 3rd consecutive gain today backed by heavy volume, showing formidable strength since announcing plans following Wednesday's close that it will issue $400M in senior notes (read here). Prior chart highs are important support to watch on pullbacks. Featured on 2/25/10 in yellow in the mid-day report (read here).
>>> The latest Featured Stock Update with an annotated graph appeared on 2/25/2010. click here.
|
|
C
A
S
I |
News |
Chart |
SEC
View all notes Alert
me of new notes
Company
Profile
|
SIRO
- NASDAQ
Sirona Dental Systems
HEALTH SERVICES - Medical Instruments & Supplies
|
$37.05
|
-0.46
|
187,186
33% DAV
568,600
|
2/16/2010
(Date
Featured) |
$36.43
(Price
Featured) |
PP = $36.15 |
Y |
| MB = $37.96 |
Most Recent Note - 3/12/2010 7:16:31 PM
Y - Small loss today on below average volume, quietly perched above its pivot point yet below its max buy level. It was featured in yellow in the 2/16/10 mid-day report (read here) as it broke out from a 10-week flat base.
>>> The latest Featured Stock Update with an annotated graph appeared on 3/9/2010. click here.
|
|
C
A
S
I |
News |
Chart |
SEC
View all notes Alert
me of new notes
Company
Profile
|
ULTA
- NASDAQ
Ulta Salon Cosm & Frag
SPECIALTY RETAIL - Specialty Retail, Other
|
$23.33
|
+1.79
|
1,976,196
585% DAV
337,800
|
3/12/2010
(Date
Featured) |
$22.81
(Price
Featured) |
PP = $21.72 |
Y |
| MB = $22.81 |
Most Recent Note - 3/12/2010 7:16:46 PM
Y - A more detailed Stock Bulletin was published as a follow-up to its appearance in today's mid-day report. Today it closed with a considerable gain with 5 times average volume for a new 52-week high, rising from an 8-week cup shaped base following strong results for the quarter ended January 31, 2010. Color coded yellow with pivot point cited based on its 1/08/10 high plus ten cents. Sales revenues increases have been accelerating while earnings increases in 3 most recent quarters were above the +25% guideline.
>>> The latest Featured Stock Update with an annotated graph appeared on 3/12/2010. click here.
|
|
C
A
S
I |
News |
Chart |
SEC
View all notes Alert
me of new notes
Company
Profile
|
VPRT
- NASDAQ
Vistaprint Nv
DIVERSIFIED SERVICES - Business/Management Services
|
$60.87
|
-1.08
|
578,959
118% DAV
489,100
|
3/1/2010
(Date
Featured) |
$57.72
(Price
Featured) |
PP = $59.70 |
Y |
| MB = $62.69 |
Most Recent Note - 3/12/2010 7:16:50 PM
Y - Gapped down today for a small loss after an analyst downgrade. It is now consolidating only -3% from its 3/09/10 all-time high. As previously noted, "Its gain on 3/02/10 was below the volume guidelines for buyable breakouts under the investment system." It did not yet trigger a technical buy signal since featured in the March 2010 CANSLIM.net News monthly newsletter (read here).
>>> The latest Featured Stock Update with an annotated graph appeared on 2/28/2010. click here.
|
|
C
A
S
I |
News |
Chart |
SEC
View all notes Alert
me of new notes
Company
Profile
|
|
|
|
THESE ARE NOT BUY RECOMMENDATIONS!
Comments contained in the body of this report are technical
opinions only. The material herein has been obtained
from sources believed to be reliable and accurate, however,
its accuracy and completeness cannot be guaranteed.
This site is not an investment advisor, hence it does
not endorse or recommend any securities or other investments.
Any recommendation contained in this report may not
be suitable for all investors and it is not to be deemed
an offer or solicitation on our part with respect to
the purchase or sale of any securities. All trademarks,
service marks and trade names appearing in this report
are the property of their respective owners, and are
likewise used for identification purposes only.
This report is a service available
only to active Paid Premium Members.
You may opt-out of receiving report notifications
at any time. Questions or comments may be submitted
by writing to Premium Membership Services 665 S.E. 10 Street, Suite 201 Deerfield Beach, FL 33441-5634 or by calling 1-800-965-8307
or 954-785-1121.
|
|
|


