You are not logged in.
This means you
CAN ONLY VIEW reports that were published prior to Monday, March 17, 2025.
You
MUST UPGRADE YOUR MEMBERSHIP if you want to see any current reports.
AFTER MARKET UPDATE - THURSDAY, MARCH 11TH, 2010
Previous After Market Report Next After Market Report >>>
|
|
|
|
DOW |
+44.51 |
10,611.84 |
+0.42% |
|
Volume |
981,153,810 |
-14% |
|
Volume |
2,205,499,020 |
-12% |
|
NASDAQ |
+9.51 |
2,368.46 |
+0.40% |
|
Advancers |
1,797 |
57% |
|
Advancers |
1,513 |
54% |
|
S&P 500 |
+4.63 |
1,150.24 |
+0.40% |
|
Decliners |
1,220 |
39% |
|
Decliners |
1,136 |
40% |
|
Russell 2000 |
+2.29 |
677.22 |
+0.34% |
|
52 Wk Highs |
281 |
|
|
52 Wk Highs |
178 |
|
|
S&P 600 |
+1.08 |
358.87 |
+0.30% |
|
52 Wk Lows |
1 |
|
|
52 Wk Lows |
2 |
|
|
 |
Volume Cools As Indices Edge Higher
Adam Sarhan, Contributing Writer,
The major averages edged higher after China said inflation jumped last month and mixed economic data was released. Volume totals were reported lower than the prior session on both major exchanges. Advancers led decliners by a 3-to-2 ratio on the NYSE and by a a 5-to-4 margin on the Nasdaq exchange. There were 35 high-ranked companies from the CANSLIM.net Leaders List that made a new 52-week high and appeared on the CANSLIM.net BreakOuts Page, down from the 50 issues that appeared on the prior session. New 52-week highs again overwhelmingly trumped new lows on both exchanges.
Overnight, China said inflation rose +2.7% in February, up from +1.5% in January. For the past few months, China has taken several steps to curb inflation and its robust economy. Their actions sent stocks lower as many people were concerned about what the ramifications would be for the ongoing economic recovery. Therefore, the higher reading on inflation could cause China to raise interest rates which could, in turn, hinder the economic recovery.
In the US, two important economic reports were released: weekly jobless claims and the latest trade data. The Labor Department said weekly jobless claims fell by 6,000 to 462,000 which was a positive sign. Elsewhere, the Commerce Department said the trade deficit contracted in January due to a large drop in imported oil and cars. The report showed that US exports slid -0.3% which was concerning because the drop in overseas sales could slow the recovery.
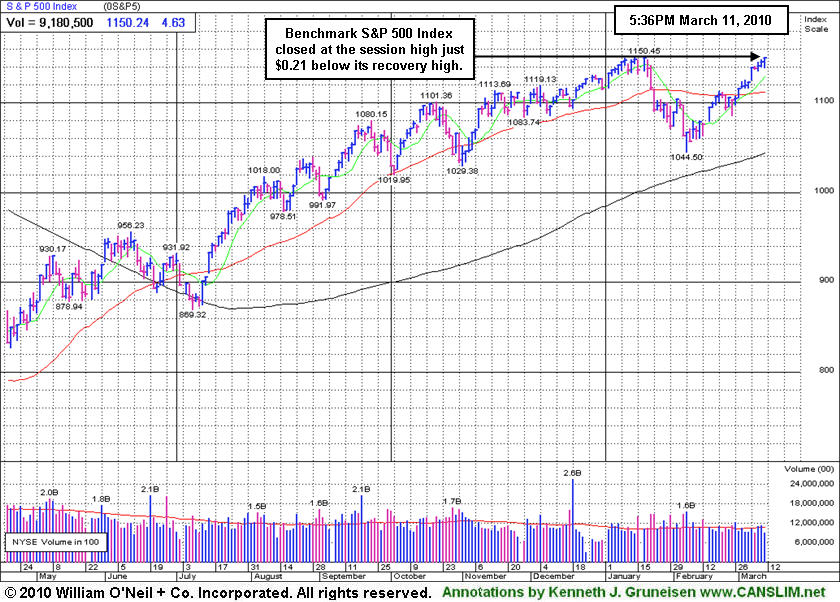
Looking at the market, since the March 1, follow-through-day (FTD) the market and a batch of leading stocks steadily rallied. The fact that we have not seen any serious distribution days since the FTD bodes well for this nascent rally. It is also a welcome sign to see the market continue to improve as investors digest the latest round of stronger than expected economic and earnings data. Remember that now that a new rally has been confirmed, the window is open to start buying high quality breakouts. Trade accordingly.
PICTURED: The benchmark S&P 500 Index closed at the session high just $0.21 below its recovery high.
|
|
|
 |
Bank Index Hits New Recovery Highs With Sixth Straight Gain
Kenneth J. Gruneisen - Passed the CAN SLIM® Master's Exam
The Healthcare Index ($HMO +1.56%) and Gold & Silver Index ($XAU +0.85%) were among Thursday's best performing group indexes. The Networking Index ($NWX +1.09%) posted its 10th consecutive gain while leading the tech sector higher. Meanwhile the rest of the tech sector showed less decisive action as the Semiconductor Index ($SOX -0.25%) lagged and the Biotechnology Index ($BTK +0.04%) and Internet Index ($IIX +0.24%) inched higher. A modest gain from the Retail Index ($RLX +0.79%) provided a positive influence for the major averages. Energy-related shares were mixed as the Oil Services Index ($OSX -0.11%) and Integrated Oil Index ($XOI +0.28%) ended the session with little change. The Broker/Dealer Index ($XBD +0.19%) is still a point below its January 2010 highs and -5.74% off its October 2009 recovery peak. However, the Bank Index ($BKX +1.72%) has been charging to new recovery highs, as shown below.
Charts courtesy www.stockcharts.com
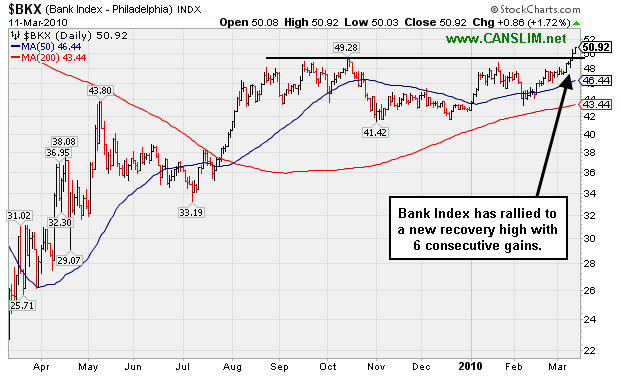
PICTURED: The Bank Index ($BKX +1.72%) posted a 6th consecutive gain while rallying to new recovery highs. The leadership from financial stocks (along with many other growth areas) bodes especially well for the overall market outlook.
| Oil Services |
$OSX |
211.15 |
-0.24 |
-0.11% |
+8.33% |
| Healthcare |
$HMO |
1,490.61 |
+22.94 |
+1.56% |
+1.20% |
| Integrated Oil |
$XOI |
1,074.61 |
+3.01 |
+0.28% |
+0.60% |
| Semiconductor |
$SOX |
357.16 |
-0.88 |
-0.25% |
-0.76% |
| Networking |
$NWX |
258.06 |
+2.77 |
+1.09% |
+11.69% |
| Internet |
$IIX |
245.86 |
+0.58 |
+0.24% |
+5.13% |
| Broker/Dealer |
$XBD |
119.21 |
+0.23 |
+0.19% |
+3.62% |
| Retail |
$RLX |
439.96 |
+3.47 |
+0.79% |
+7.01% |
| Gold & Silver |
$XAU |
167.24 |
+1.41 |
+0.85% |
-0.60% |
| Bank |
$BKX |
50.92 |
+0.86 |
+1.72% |
+19.22% |
| Biotech |
$BTK |
1,231.23 |
+0.52 |
+0.04% |
+30.69% |
|
|
|
 |
Networking Firm Followed Through After Powerful Breakout
Kenneth J. Gruneisen - Passed the CAN SLIM® Master's Exam
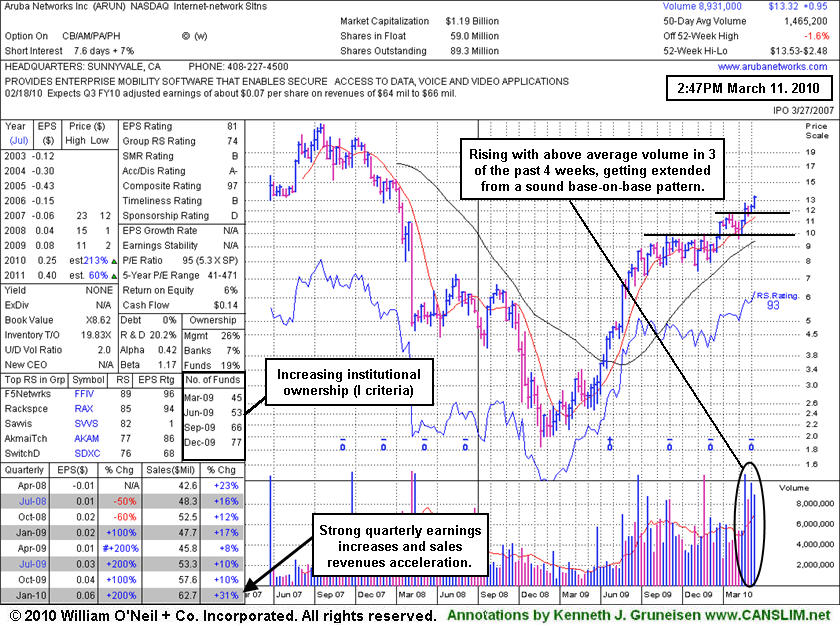
Aruba Networks Inc. (ARUN +$0.02 or +0.15% to $13.29) has been consolidating near its 52-week high after a considerable gain on 3/09/10 with volume nearly 4 times average. It is extended from its prior base, and disciplined investors would avoid chasing it and wait for another ideal entry point within the investment system's guidelines. Meanwhile, support to watch is now defined by prior chart highs and its 50-day moving average (DMA) line. When it gapped up 2/19/10 it was first featured in yellow in the mid-day report (read here) as its considerable gain for a new 52 week high on more than 8 times average volume helped it break out from a flat base-on-base pattern above its 50 DMA line. As previously noted, "a gap up gain with 8 times average volume is an indication of heavy institutional (I criteria) buying demand." It held its ground above prior chart highs and then followed through with additional confirming gains on heavy volume since its last appearance in this FSU section on 2/22/10 with an annotated daily graph under the headline "Held Ground After Prior Gap Up With 8 Times Average Volume." We will follow up that annotated daily graph with a weekly graph below that reveals several important data points.
Some of the strong technical action recently was an immediate response to its improving fundamentals. Its Up/Down Volume Ratio of 2.0 and gains backed by above average volume in 3 of the past 4 weeks are bullish signs. Its current quarterly earnings (C criteria) increases have been above the +25% minimum guideline and earnings in recent years followed prior annual losses. The quarter ended Dec 31, 2009 also showed a more impressive +30% sales revenues increase continuing its acceleration. The number of top-rated funds owning an interest in its shares rose from 45 in Mar '09 to 77 in Dec '09 providing a nice reassurance with respect to the investment system's I criteria. Return On Equity reported at 6% is below the 17% guideline, leaving some concerns. However, management's 26% ownership interest keeps the directors' focus on maintaining and growing shareholder value.
|
|
|
Color Codes Explained :
Y - Better candidates highlighted by our
staff of experts.
G - Previously featured
in past reports as yellow but may no longer be buyable under the
guidelines.
***Last / Change / Volume quote data in this table corresponds with the timestamp on the note***
Symbol/Exchange
Company Name
Industry Group |
Last |
Chg. |
Vol
% DAV |
Date Featured |
Price Featured |
Latest Pivot Point
Featured |
Status |
| Latest Max Buy Price |
ARUN
- NASDAQ
Aruba Networks Inc
COMPUTER HARDWARE - Networking & Communication Dev
|
$13.29
|
+0.02
|
931,424
64% DAV
1,465,200
|
2/19/2010
(Date
Featured) |
$12.71
(Price
Featured) |
PP = $11.94 |
G |
| MB = $12.54 |
Most Recent Note - 3/11/2010 5:25:22 PM
G - Holding its ground after recent gains, stubbornly perched at its 52-week high, extended from its prior base. Support to watch is now defined by prior chart highs and its 50 DMA line. ARUN was featured in the mid-day report on 2/19/10 as it rose from a flat base-on-base pattern above its 50-day moving average line (read here).
>>> The latest Featured Stock Update with an annotated graph appeared on 3/11/2010. click here.
|
|
C
A
S
I |
News |
Chart |
SEC
View all notes Alert
me of new notes
Company
Profile
|
BIDU
- NASDAQ
Baidu Inc Ads
INTERNET - Internet Information Providers
|
$554.10
|
+4.93
|
1,601,369
82% DAV
1,946,600
|
1/13/2010
(Date
Featured) |
$431.25
(Price
Featured) |
PP = $426.75 |
G |
| MB = $448.09 |
Most Recent Note - 3/11/2010 5:27:59 PM
G - Wedged up today for a 4th consecutive gain on light volume and yet another new all-time high. Steadily rising without an above average volume session in 4 weeks. Its prior chart high near $470 is the nearest support level while it is extended above its mid-January highs. It rose steadily since the 2/10/10 gap up gain with more than 3 times average volume.
>>> The latest Featured Stock Update with an annotated graph appeared on 3/4/2010. click here.
|
|
C
A
S
I |
News |
Chart |
SEC
View all notes Alert
me of new notes
Company
Profile
|
BRLI
- NASDAQ
Bio Reference Labs Inc
HEALTH SERVICES - Medical Laboratories & Researc
|
$45.45
|
+1.44
|
137,118
143% DAV
95,800
|
2/12/2010
(Date
Featured) |
$39.02
(Price
Featured) |
PP = $40.97 |
G |
| MB = $43.02 |
Most Recent Note - 3/11/2010 5:30:11 PM
G - Closed near the session high for a considerable gain today with above average volume, getting extended from its prior base. With no overhead supply, its weekly chart is marked by many up weeks with above average volume and few down weeks on volume -very bullish characteristics. This high-ranked Medical-Dental - Services firm was featured in yellow in the 2/12/10 mid-day report (read here).
>>> The latest Featured Stock Update with an annotated graph appeared on 3/1/2010. click here.
|
|
C
A
S
I |
News |
Chart |
SEC
View all notes Alert
me of new notes
Company
Profile
|
CACC
- NASDAQ
Credit Acceptance Corp
FINANCIAL SERVICES - Credit Services
|
$43.95
|
+0.00
|
28,999
49% DAV
59,200
|
9/29/2009
(Date
Featured) |
$33.48
(Price
Featured) |
PP = $37.10 |
G |
| MB = $38.96 |
Most Recent Note - 3/11/2010 5:31:39 PM
G - Posted a small gain on very light volume today, remaining below its 50 DMA line which has been acting as resistance. Recent lows in the $38 area are a nearby chart support level to watch.
>>> The latest Featured Stock Update with an annotated graph appeared on 3/2/2010. click here.
|
|
C
A
S
I |
News |
Chart |
SEC
View all notes Alert
me of new notes
Company
Profile
|
CISG
- NASDAQ
Cninsure Inc Ads
INSURANCE - Insurance Brokers
|
$25.52
|
-0.23
|
211,125
100% DAV
211,100
|
3/3/2010
(Date
Featured) |
$24.38
(Price
Featured) |
PP = $23.10 |
G |
| MB = $24.26 |
Most Recent Note - 3/11/2010 5:45:34 PM
G - Small loss on average volume today, holding its ground stubbornly near its 52-week high with no overhead supply to act as resistance. It rose from a 20-week double bottom base with 8 times average volume as it was featured in the 3/03/10 mid-day report (read here).
>>> The latest Featured Stock Update with an annotated graph appeared on 3/3/2010. click here.
|
|
C
A
S
I |
News |
Chart |
SEC
View all notes Alert
me of new notes
Company
Profile
|
CRM
- NYSE
Salesforce.com Inc
INTERNET - Internet Software & Services
|
$75.42
|
+0.23
|
1,643,911
79% DAV
2,070,600
|
3/5/2010
(Date
Featured) |
$72.28
(Price
Featured) |
PP = $75.53 |
Y |
| MB = $79.31 |
Most Recent Note - 3/11/2010 5:50:18 PM
Y - Its 6th consecutive gain today came with lighter than average volume. It finished the session at a new high close near its pivot point after a 9-week base. Its 50 DMA line and recent chart low ($64.77 on 2/25/10) define important support.
>>> The latest Featured Stock Update with an annotated graph appeared on 3/5/2010. click here.
|
|
C
A
S
I |
News |
Chart |
SEC
View all notes Alert
me of new notes
Company
Profile
|
CTRP
- NASDAQ
Ctrip.com Intl Ltd Adr
LEISURE - Resorts & Casinos
|
$38.80
|
-0.07
|
1,039,116
48% DAV
2,159,700
|
3/1/2010
(Date
Featured) |
$38.23
(Price
Featured) |
PP = $38.50 |
Y |
| MB = $40.43 |
Most Recent Note - 3/11/2010 5:51:26 PM
Y - It continues quietly holding its ground this week while hovering near its 52-week highs above its pivot point. It proposed and completed an offering of additional shares last week after featured in the new March 2010 issue of CANSLIM.net News (read here). A gain above its pivot point or its most recent chart highs is still needed to confirm a fresh technical buy signal with +50% above average volume or more.
>>> The latest Featured Stock Update with an annotated graph appeared on 2/28/2010. click here.
|
|
C
A
S
I |
News |
Chart |
SEC
View all notes Alert
me of new notes
Company
Profile
|
EZPW
- NASDAQ
Ezcorp Inc Cl A
SPECIALTY RETAIL - Specialty Retail, Other
|
$21.52
|
-0.32
|
520,000
108% DAV
481,500
|
2/19/2010
(Date
Featured) |
$19.03
(Price
Featured) |
PP = $18.80 |
G |
| MB = $19.74 |
Most Recent Note - 3/11/2010 5:53:20 PM
G - Loss today with average volume, negatively reversing after reaching another new all-time high. Extended from any sound base of support, its prior chart highs in the $18 area define an important support level to watch. Featured in yellow in the 2/19/10 mid-day report (read here).
>>> The latest Featured Stock Update with an annotated graph appeared on 3/8/2010. click here.
|
|
C
A
S
I |
News |
Chart |
SEC
View all notes Alert
me of new notes
Company
Profile
|
GMCR
- NASDAQ
Green Mtn Coffee Roastrs
FOOD & BEVERAGE - Processed & Packaged Goods
|
$92.36
|
+0.19
|
591,573
42% DAV
1,394,800
|
2/26/2010
(Date
Featured) |
$84.39
(Price
Featured) |
PP = $88.75 |
Y |
| MB = $93.19 |
Most Recent Note - 3/11/2010 5:57:05 PM
Y - Posted a second consecutive gain on light volume today. Hovering near all-time highs since its gain on 3/08/10 triggered a new technical buy signal. Initial support to watch now would be prior chart highs in the $86-88 area.
>>> The latest Featured Stock Update with an annotated graph appeared on 2/23/2010. click here.
|
|
C
A
S
I |
News |
Chart |
SEC
View all notes Alert
me of new notes
Company
Profile
|
ISRG
- NASDAQ
Intuitive Surgical Inc
HEALTH SERVICES - Medical Appliances & Equipment
|
$357.80
|
+0.36
|
239,005
47% DAV
508,200
|
1/22/2010
(Date
Featured) |
$340.40
(Price
Featured) |
PP = $314.00 |
G |
| MB = $329.70 |
Most Recent Note - 3/11/2010 5:58:35 PM
G - Continuing to consolidate this week, perched quietly near all-time highs. Prior chart highs near $346 are now a support level to watch. ISRG was featured at $340.40 in the 1/22/10 mid-day report following a powerful breakaway gap (read here).
>>> The latest Featured Stock Update with an annotated graph appeared on 2/24/2010. click here.
|
|
C
A
S
I |
News |
Chart |
SEC
View all notes Alert
me of new notes
Company
Profile
|
PCLN
- NASDAQ
Priceline.com Inc
INTERNET - Internet Software & Services
|
$399.55
|
-4.72
|
584,812
N/A
|
11/1/2002
(Date
Featured) |
$399.55
(Price
Featured) |
PP = $428.20 |
Y |
| MB = $449.61 |
Most Recent Note - 1/2/2011
Y - Returns to Featured Stocks list with its appearance in the January 2011 CANSLIM.net News including detailed analysis and annotated daily and weekly graphs.
>>> The latest Featured Stock Update with an annotated graph appeared on 3/10/2010. click here.
|
|
C
A
S
I |
News |
Chart |
SEC
View all notes Alert
me of new notes
Company
Profile
|
PEGA
- NASDAQ
Pegasystems Inc
COMPUTER SOFTWARE & SERVICES - Business Software & Services
|
$36.57
|
-0.02
|
136,131
66% DAV
206,800
|
2/26/2010
(Date
Featured) |
$36.00
(Price
Featured) |
PP = $38.55 |
Y |
| MB = $40.48 |
Most Recent Note - 3/11/2010 6:02:01 PM
Y - Quietly perched within close striking distance of its pivot point. Recently found support at its 50 DMA line, while prior chart lows in the $32 area are the next support level.
>>> The latest Featured Stock Update with an annotated graph appeared on 2/26/2010. click here.
|
|
C
A
S
I |
News |
Chart |
SEC
View all notes Alert
me of new notes
Company
Profile
|
ROVI
- NASDAQ
Rovi Corp
COMPUTER SOFTWARE & SERVICES - Security Software & Services
|
$37.00
|
+0.00
|
2,793,586
250% DAV
1,115,800
|
2/25/2010
(Date
Featured) |
$33.54
(Price
Featured) |
PP = $34.87 |
G |
| MB = $36.61 |
Most Recent Note - 3/11/2010 6:03:15 PM
G - Held its ground today after announcing plans following Wednesday's close that it will issue $400M in senior notes (read here). Prior chart highs are important support to watch on pullbacks. Featured on 2/25/10 in yellow in the mid-day report (read here).
>>> The latest Featured Stock Update with an annotated graph appeared on 2/25/2010. click here.
|
|
C
A
S
I |
News |
Chart |
SEC
View all notes Alert
me of new notes
Company
Profile
|
SIRO
- NASDAQ
Sirona Dental Systems
HEALTH SERVICES - Medical Instruments & Supplies
|
$37.51
|
+0.11
|
483,502
86% DAV
561,500
|
2/16/2010
(Date
Featured) |
$36.43
(Price
Featured) |
PP = $36.15 |
Y |
| MB = $37.96 |
Most Recent Note - 3/11/2010 6:04:20 PM
Y - Small gain today on below average volume for a new high close. Quietly perched above its pivot point yet below its max buy level. It was featured in yellow in the 2/16/10 mid-day report (read here) as it broke out from a 10-week flat base.
>>> The latest Featured Stock Update with an annotated graph appeared on 3/9/2010. click here.
|
|
C
A
S
I |
News |
Chart |
SEC
View all notes Alert
me of new notes
Company
Profile
|
VPRT
- NASDAQ
Vistaprint Nv
DIVERSIFIED SERVICES - Business/Management Services
|
$61.95
|
-0.09
|
243,725
49% DAV
493,200
|
3/1/2010
(Date
Featured) |
$57.72
(Price
Featured) |
PP = $59.70 |
Y |
| MB = $62.69 |
Most Recent Note - 3/11/2010 6:06:54 PM
Y - Holding its ground while quietly hovering in a tight range this week. Perched near its all-time high above its pivot point, yet still under its max buy level. As previously noted, "Its gain on 3/02/10 was below the volume guidelines for buyable breakouts under the investment system." Featured in the March 2010 CANSLIM.net News monthly newsletter (read here).
>>> The latest Featured Stock Update with an annotated graph appeared on 2/28/2010. click here.
|
|
C
A
S
I |
News |
Chart |
SEC
View all notes Alert
me of new notes
Company
Profile
|
|
|
|
THESE ARE NOT BUY RECOMMENDATIONS!
Comments contained in the body of this report are technical
opinions only. The material herein has been obtained
from sources believed to be reliable and accurate, however,
its accuracy and completeness cannot be guaranteed.
This site is not an investment advisor, hence it does
not endorse or recommend any securities or other investments.
Any recommendation contained in this report may not
be suitable for all investors and it is not to be deemed
an offer or solicitation on our part with respect to
the purchase or sale of any securities. All trademarks,
service marks and trade names appearing in this report
are the property of their respective owners, and are
likewise used for identification purposes only.
This report is a service available
only to active Paid Premium Members.
You may opt-out of receiving report notifications
at any time. Questions or comments may be submitted
by writing to Premium Membership Services 665 S.E. 10 Street, Suite 201 Deerfield Beach, FL 33441-5634 or by calling 1-800-965-8307
or 954-785-1121.
|
|
|


