You are not logged in.
This means you
CAN ONLY VIEW reports that were published prior to Monday, February 26, 2024.
You
MUST UPGRADE YOUR MEMBERSHIP if you want to see any current reports.
AFTER MARKET UPDATE - WEDNESDAY, MARCH 11TH, 2020
Previous After Market Report Next After Market Report >>>
|
|
|
|
DOW |
-1,464.94 |
23,553.22 |
-5.86% |
|
Volume |
1,761,708,000 |
-3% |
|
Volume |
4,269,538,300 |
-3% |
|
NASDAQ |
-392.20 |
7,952.05 |
-4.70% |
|
Advancers |
150 |
5% |
|
Advancers |
381 |
12% |
|
S&P 500 |
-140.85 |
2,741.38 |
-4.89% |
|
Decliners |
2,620 |
95% |
|
Decliners |
2,905 |
88% |
|
Russell 2000 |
-86.60 |
1,264.30 |
-6.41% |
|
52 Wk Highs |
6 |
|
|
52 Wk Highs |
7 |
|
|
S&P 600 |
-48.50 |
757.53 |
-6.02% |
|
52 Wk Lows |
1,129 |
|
|
52 Wk Lows |
1,034 |
|
|
During market corrections it is especially important to reduce exposure, preserve your capital, and just be patient. Be safe! Historic studies have shown that the biggest up sessions have occurred during market corrections and bear markets.
Disciplined investors know to wait until a new confirmed rally marked by a solid follow-through day. The bold portion of the daily market commentary will note when that happens. For any clarification or additional help applying the fact-based investment system, we invite members to call, or contact us via the inquiry form.
|
 |
Major Indices Quickly Slump to "Bear Market" Threshold
Kenneth J. Gruneisen - Passed the CAN SLIM® Master's Exam
The Dow finished in bear market territory (marked by a 20% decline from a recent high), falling 1464 points to 23,553. The S&P 500 briefly dipped below 20% from its February 19th high, and closed within 1% from ending the longest bull market in history. The benchmark tumbled 4.9%, while the Nasdaq retreated 4.7%. Breadth was negative as decliners led advancers by a 17-1 margin on the NYSE and by more than 7-1 on the Nasdaq exchange. The reported volume totals were lighter than the prior session totals on the NYSE and on the Nasdaq exchange. Leadership remained thin as there were only 2 high-ranked companies from the Leaders List that hit a new 52-week high and were listed on the BreakOuts Page, versus 3 on the prior session. New 52-week lows totals swelled and easily outnumbered shrinking new 52-week highs totals on the NYSE and on the Nasdaq exchange. The major indices' (M criteria) have been in a noted "market correction" and investors have been prompted since February 25th to reduce market exposure. Disciplined investors know to watch for a follow-through day of gains on higher volume to confirm a new market uptrend before initiating any new buying efforts. The Featured Stocks Page provides the most timely analysis on high-ranked leaders. Charts used courtesy of www.stockcharts.com
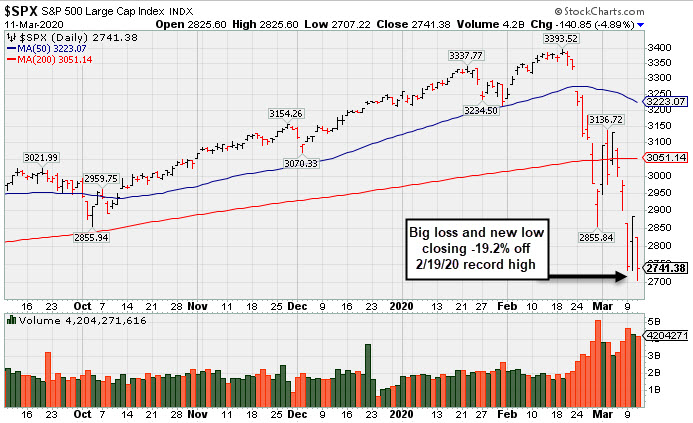
PICTURED: The S&P 500 Index suffered a big loss for a new low closing -19.2% off the all-time high hit on 2/19/20.
Stocks finished firmly lower on Wednesday after the World Health Organization declared the novel coronavirus a pandemic. Sentiment also faltered as the Trump administration failed to outline details of a proposed payroll tax relief package, which was aimed at combating the economic fallout from the outbreak.
All 11 S&P 500 sectors slumped more than 3.9%, with just ten constitutes of the index finishing in positive territory. Industrials led losses, declining nearly 6%. Energy shares also lagged, amid a further drop in oil prices. WTI crude fell 3.9% to $33.02/barrel after state oil giant Saudi Aramco said it had been directed to increase its production capacity by the kingdom’s energy ministry. In M&A news, PepsiCo (PEP -3.27%) fell after announcing the acquisition of energy drink maker Rockstar Energy for $3.85 billion.
Treasuries were mixed along the curve. The yield on the 10-year note rose seven basis points to 0.86%, while the yield on the two-year note slipped two basis points to 0.50%. On the data front, MBA mortgage applications surged 55.4% in the most recent week as mortgage rates tracked U.S. Treasury yields to historic lows. In central bank news, the Bank of England slashed its benchmark interest rate by 0.50% in a surprise policy move. |
 Kenneth J. Gruneisen started out as a licensed stockbroker in August 1987, a couple of months prior to the historic stock market crash that took the Dow Jones Industrial Average down -22.6% in a single day. He has published daily fact-based fundamental and technical analysis on high-ranked stocks online for two decades. Through FACTBASEDINVESTING.COM, Kenneth provides educational articles, news, market commentary, and other information regarding proven investment systems that work in good times and bad.
Comments contained in the body of this report are technical opinions only and are not necessarily those of Gruneisen Growth Corp. The material herein has been obtained from sources believed to be reliable and accurate, however, its accuracy and completeness cannot be guaranteed. Our firm, employees, and customers may effect transactions, including transactions contrary to any recommendation herein, or have positions in the securities mentioned herein or options with respect thereto. Any recommendation contained in this report may not be suitable for all investors and it is not to be deemed an offer or solicitation on our part with respect to the purchase or sale of any securities. |
|
 |
Energy, Financial, Retail, and Tech Indexes Sank
Kenneth J. Gruneisen - Passed the CAN SLIM® Master's Exam
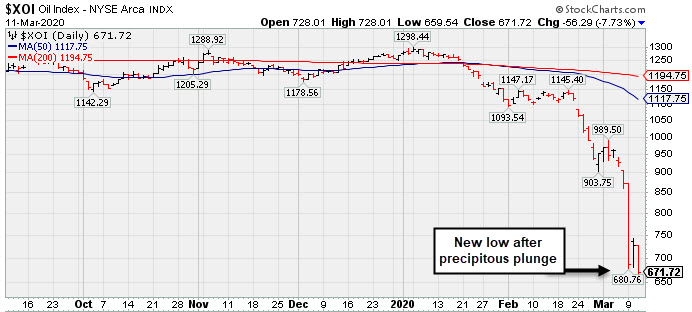
Commodity-linked groups were standout decliners as the Oil Services Index ($OSX -10.90%) and the Integrated Oil Index ($XOI -7.73%) slumped badly again and the Gold & Silver Index ($XAU -8.19%) also suffered a big loss. The Bank Index ($BKX -6.48%) and Broker/Dealer Index ($XBD -4.37%) suffered large losses along with Retail Index ($RLX 4.46%). The tech sector had a negative bias as the Semiconductor Index ($SOX -5.67%), Networking Index ($NWX -5.29%), and the Biotech Index ($BTK -5.76%) posted big declines.
PICTURED: The Integrated Oil Index ($XOI -7.73%) fell to a new low after a precipitous plunge.
| Oil Services |
$OSX |
27.84 |
-3.41 |
-10.91% |
-64.44% |
| Integrated Oil |
$XOI |
671.72 |
-56.29 |
-7.73% |
-47.13% |
| Semiconductor |
$SOX |
1,562.54 |
-93.96 |
-5.67% |
-15.52% |
| Networking |
$NWX |
448.89 |
-25.06 |
-5.29% |
-23.06% |
| Broker/Dealer |
$XBD |
229.61 |
-10.49 |
-4.37% |
-20.93% |
| Retail |
$RLX |
2,265.55 |
-105.64 |
-4.46% |
-7.50% |
| Gold & Silver |
$XAU |
87.67 |
-7.82 |
-8.19% |
-18.00% |
| Bank |
$BKX |
72.48 |
-5.02 |
-6.48% |
-36.06% |
| Biotech |
$BTK |
4,470.85 |
-273.14 |
-5.76% |
-11.77% |
|
|
|
 |
Featured Stocks Have Quickly Dwindled
Kenneth J. Gruneisen - Passed the CAN SLIM® Master's Exam
During extremely bearish markets the number of stocks covered in this area has sometimes been reduced to zero. We suggest making no excuses for weak stocks in weak markets. Feel free to contact us if you have a need for any additional information. |
|
|
Color Codes Explained :
Y - Better candidates highlighted by our
staff of experts.
G - Previously featured
in past reports as yellow but may no longer be buyable under the
guidelines.
***Last / Change / Volume data in this table is the closing quote data***
|
|
|
THESE ARE NOT BUY RECOMMENDATIONS!
Comments contained in the body of this report are technical
opinions only. The material herein has been obtained
from sources believed to be reliable and accurate, however,
its accuracy and completeness cannot be guaranteed.
This site is not an investment advisor, hence it does
not endorse or recommend any securities or other investments.
Any recommendation contained in this report may not
be suitable for all investors and it is not to be deemed
an offer or solicitation on our part with respect to
the purchase or sale of any securities. All trademarks,
service marks and trade names appearing in this report
are the property of their respective owners, and are
likewise used for identification purposes only.
This report is a service available
only to active Paid Premium Members.
You may opt-out of receiving report notifications
at any time. Questions or comments may be submitted
by writing to Premium Membership Services 665 S.E. 10 Street, Suite 201 Deerfield Beach, FL 33441-5634 or by calling 1-800-965-8307
or 954-785-1121.
|
|
|