You are not logged in.
This means you
CAN ONLY VIEW reports that were published prior to Thursday, April 17, 2025.
You
MUST UPGRADE YOUR MEMBERSHIP if you want to see any current reports.
AFTER MARKET UPDATE - THURSDAY, MARCH 12TH, 2020
Previous After Market Report Next After Market Report >>>
|
|
|
|
DOW |
-2,352.60 |
21,200.62 |
-9.99% |
|
Volume |
2,158,752,880 |
+23% |
|
Volume |
5,045,561,900 |
+18% |
|
NASDAQ |
-750.25 |
7,201.80 |
-9.43% |
|
Advancers |
74 |
3% |
|
Advancers |
193 |
6% |
|
S&P 500 |
-260.74 |
2,480.64 |
-9.51% |
|
Decliners |
2,775 |
97% |
|
Decliners |
3,165 |
94% |
|
Russell 2000 |
-141.37 |
1,122.93 |
-11.18% |
|
52 Wk Highs |
2 |
|
|
52 Wk Highs |
10 |
|
|
S&P 600 |
-86.23 |
671.30 |
-11.38% |
|
52 Wk Lows |
2,377 |
|
|
52 Wk Lows |
2,097 |
|
|
During market corrections it is especially important to reduce exposure, preserve your capital, and just be patient. Be safe! Historic studies have shown that the biggest up sessions have occurred during market corrections and bear markets.
Disciplined investors know to wait until a new confirmed rally marked by a solid follow-through day. The bold portion of the daily market commentary will note when that happens. For any clarification or additional help applying the fact-based investment system, we invite members to call, or contact us via the inquiry form.
|
 |
Major Indices Suffer Worst Day in 33 Years
Kenneth J. Gruneisen - Passed the CAN SLIM® Master's Exam
The Dow slumped 2,352 points for its largest single-session percentage decline since “Black Monday” in 1987. The S&P 500 tumbled 9.5% and into bear market territory, officially ending the longest bull market in history. The Nasdaq Composite Index fell 9.4%. Breadth was decisively negative as decliners led advancers by a 37-1 margin on the NYSE and by more than 16-1 on the Nasdaq exchange. The reported volume totals were higher than the prior session totals on the NYSE and on the Nasdaq exchange, indicative of even heavier institutional selling pressure termed "distribution". Leadership completely evaporated as there were zero high-ranked companies from the Leaders List that hit a new 52-week high and were listed on the BreakOuts Page, versus 2 on the prior session. New 52-week lows totals swelled and easily outnumbered new 52-week highs totals on the NYSE and on the Nasdaq exchange. The major indices' (M criteria) have been in a noted "market correction" and investors have been prompted since February 25th to reduce market exposure. Disciplined investors know to watch for a follow-through day of gains on higher volume to confirm a new market uptrend before initiating any new buying efforts. The Featured Stocks Page provides the most timely analysis on high-ranked leaders. Charts used courtesy of www.stockcharts.com
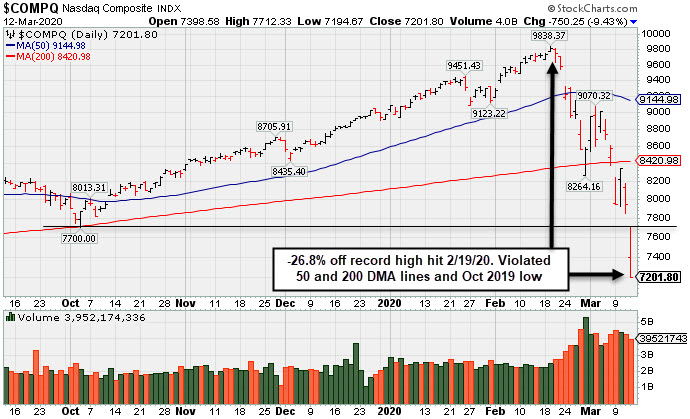
PICTURED: The Nasdaq Composite Index ended -26.8% off the all-time high hit on 2/19/20. It precipitously fell, violating its 50 and 200-day moving average lines and sinking below the October 2019 low. Stocks retreated on Thursday, as investors continued to digest the economic repercussions of the coronavirus pandemic. The selling began overnight as Wall Street was left underwhelmed by proposed fiscal stimulus measures from the U.S. government. President Trump also announced a 30-day travel ban between the United States and Europe. European shares suffered through the worst trading session on record Thursday, and U.S. trading was halted shortly after the open following a 7% decline. Stocks briefly rebounded later in the session as policymakers from the U.S. Federal Reserve pledged $1.5 trillion to shore up market liquidity, but the selling resumed and deepened in the final hour of the session.
All 11 S&P 500 sectors sunk at least 7% on the day, with four groups retreating more than 10%. Energy shares led the losses, amid a 5.6% pullback for WTI crude, which fell to $30.99/barrel. Financials, Industrials, and Utilities also experienced double-digit declines, and only three stocks in the S&P 500 finished in positive territory.
Treasuries were mixed, as the perceived “flight to safety” that sent government bonds rallying in recent weeks paused for a second-consecutive day. The yield on the benchmark 10-year Treasury note rose two basis points to 0.88%, while the 30-year yield climbed back to 1.45% after dipping below 1% on Monday. The rally in gold also ran out of steam, with the yellow metal sliding 4.5% to $1,568.90/ounce. |
 Kenneth J. Gruneisen started out as a licensed stockbroker in August 1987, a couple of months prior to the historic stock market crash that took the Dow Jones Industrial Average down -22.6% in a single day. He has published daily fact-based fundamental and technical analysis on high-ranked stocks online for two decades. Through FACTBASEDINVESTING.COM, Kenneth provides educational articles, news, market commentary, and other information regarding proven investment systems that work in good times and bad.
Comments contained in the body of this report are technical opinions only and are not necessarily those of Gruneisen Growth Corp. The material herein has been obtained from sources believed to be reliable and accurate, however, its accuracy and completeness cannot be guaranteed. Our firm, employees, and customers may effect transactions, including transactions contrary to any recommendation herein, or have positions in the securities mentioned herein or options with respect thereto. Any recommendation contained in this report may not be suitable for all investors and it is not to be deemed an offer or solicitation on our part with respect to the purchase or sale of any securities. |
|
 |
Commodity-Linked Groups, Financial, Retail, and Tech Indexes Dive
Kenneth J. Gruneisen - Passed the CAN SLIM® Master's Exam
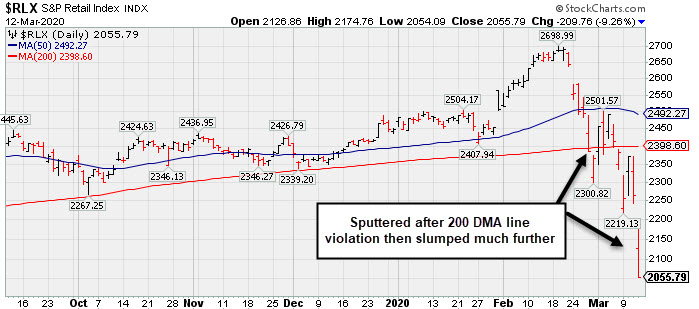
Commodity-linked groups were standout decliners again as the Oil Services Index ($OSX -15.22%) and the Integrated Oil Index ($XOI -13.50%) slumped badly again and the Gold & Silver Index ($XAU -11.27%) also suffered a big loss. The Bank Index ($BKX -10.42%) and Broker/Dealer Index ($XBD -11.63%) suffered large losses along with Retail Index ($RLX -9.26%). The tech sector had a negative bias as the Semiconductor Index ($SOX -10.91%), Networking Index ($NWX -9.81%), and the Biotech Index ($BTK -8.65%) posted big declines.
PICTURED: The Retail Index ($RLX -9.26%) sputtered after violating its 200-day moving average (DMA) line then fell to a new low while continuing the precipitous plunge. Weakness in the retail group bodes poorly for the market outlook because 2/3 of the economic activity in the US revolves around the consumer.
| Oil Services |
$OSX |
23.60 |
-4.24 |
-15.23% |
-69.86% |
| Integrated Oil |
$XOI |
581.03 |
-90.69 |
-13.50% |
-54.27% |
| Semiconductor |
$SOX |
1,392.11 |
-170.43 |
-10.91% |
-24.74% |
| Networking |
$NWX |
404.87 |
-44.02 |
-9.81% |
-30.60% |
| Broker/Dealer |
$XBD |
202.92 |
-26.69 |
-11.63% |
-30.12% |
| Retail |
$RLX |
2,055.79 |
-209.76 |
-9.26% |
-16.07% |
| Gold & Silver |
$XAU |
77.78 |
-9.89 |
-11.28% |
-27.25% |
| Bank |
$BKX |
64.93 |
-7.55 |
-10.42% |
-42.72% |
| Biotech |
$BTK |
4,083.95 |
-386.89 |
-8.65% |
-19.41% |
|
|
|
 |
No Featured Stocks
Kenneth J. Gruneisen - Passed the CAN SLIM® Master's Exam
During extremely bearish markets the number of stocks covered in this area has sometimes been reduced to zero. We suggest making no excuses for weak stocks in weak markets. Feel free to contact us if you have a need for any additional information. |
|
|
Color Codes Explained :
Y - Better candidates highlighted by our
staff of experts.
G - Previously featured
in past reports as yellow but may no longer be buyable under the
guidelines.
***Last / Change / Volume data in this table is the closing quote data***
|
|
|
THESE ARE NOT BUY RECOMMENDATIONS!
Comments contained in the body of this report are technical
opinions only. The material herein has been obtained
from sources believed to be reliable and accurate, however,
its accuracy and completeness cannot be guaranteed.
This site is not an investment advisor, hence it does
not endorse or recommend any securities or other investments.
Any recommendation contained in this report may not
be suitable for all investors and it is not to be deemed
an offer or solicitation on our part with respect to
the purchase or sale of any securities. All trademarks,
service marks and trade names appearing in this report
are the property of their respective owners, and are
likewise used for identification purposes only.
This report is a service available
only to active Paid Premium Members.
You may opt-out of receiving report notifications
at any time. Questions or comments may be submitted
by writing to Premium Membership Services 665 S.E. 10 Street, Suite 201 Deerfield Beach, FL 33441-5634 or by calling 1-800-965-8307
or 954-785-1121.
|
|
|