You are not logged in.
This means you
CAN ONLY VIEW reports that were published prior to Monday, April 14, 2025.
You
MUST UPGRADE YOUR MEMBERSHIP if you want to see any current reports.
AFTER MARKET UPDATE - MONDAY, MARCH 11TH, 2013
Previous After Market Report Next After Market Report >>>
|
|
|
|
DOW |
+50.22 |
14,447.29 |
+0.35% |
|
Volume |
599,037,690 |
-13% |
|
Volume |
1,586,693,110 |
+1% |
|
NASDAQ |
+8.50 |
3,252.87 |
+0.26% |
|
Advancers |
1,603 |
51% |
|
Advancers |
1,257 |
50% |
|
S&P 500 |
+5.04 |
1,556.22 |
+0.32% |
|
Decliners |
1,380 |
44% |
|
Decliners |
1,192 |
47% |
|
Russell 2000 |
+0.01 |
942.51 |
+0.00% |
|
52 Wk Highs |
328 |
|
|
52 Wk Highs |
215 |
|
|
S&P 600 |
-0.24 |
525.48 |
-0.05% |
|
52 Wk Lows |
14 |
|
|
52 Wk Lows |
14 |
|
|
 |
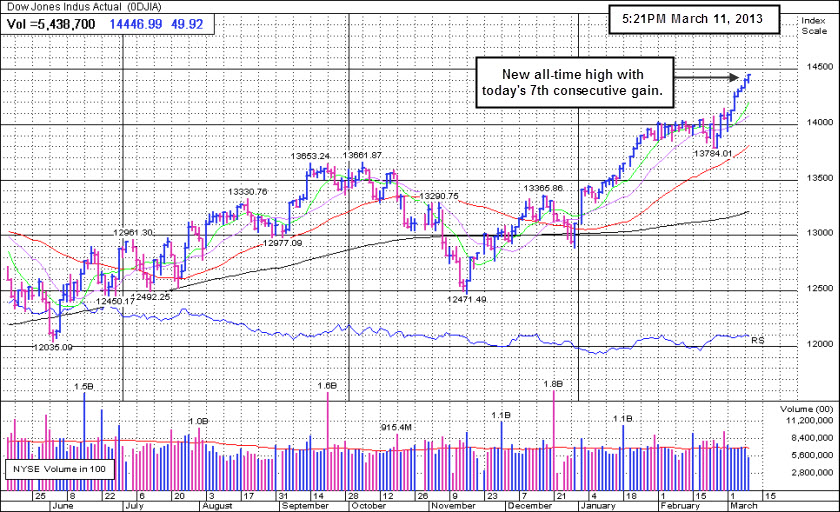
Dow Jones Industrial Average Tallied 7th Consecutive Gain to All-Times
Kenneth J. Gruneisen - Passed the CAN SLIM® Master's Exam
Behind Monday's small gains for the major averages the volume totals reported were mixed, lighter than the prior session total on the NYSE and yet slightly higher on the Nasdaq exchange. Breadth was slightly positive as advancers led decliners by an 8-7 margin on the NYSE and on the Nasdaq exchange. The total number of stocks hitting new 52-week highs solidly outnumbered new 52-week lows on the NYSE and on the Nasdaq exchange. There were 75 high-ranked companies from the CANSLIM.net Leaders List making new 52-week highs and appearing on the CANSLIM.net BreakOuts Page, down from the prior session's total of 100 stocks. There were gains for 10 of the 15 high-ranked companies currently included on the Featured Stocks Page.
U.S. equities have rallied strongly since the start of the year, helped by signs of improvement in the economy and the support of equities by the Federal Reserve's quantitative easing program. These factors have contained recent pullbacks as investors have used them as a buying opportunity. The Fed has continued its policy of keeping short-term interest rates near zero since late 2008.
Wall Street had traded slightly lower earlier in the day as Italy's credit downgrade and disappointing Chinese economic data gave investors a reason to pause. However, Dow component Boeing Co (BA +2.11%) rose its highest level since May 2008 after the U.S. aircraft manufacturer said strong demand was prompting it to increase its production rates of commercial planes. It was the Dow's biggest percentage gainer and gave the biggest boost to the Dow in Monday's session. The U.S.- listed shares of BlackBerry (BBRY +14.09%) rallied after AT&T Inc (T -0.22%) said it will start selling the company's new BlackBerry Z10 touchscreen smartphone in the United States on March 22nd. Dell Inc (DELL +1.48%) agreed to give Carl Icahn a closer look at its books less than a week after the activist investor joined a growing chorus of opposition to founder Michael Dell's plan to take the world's No. 3 personal computer maker private.
Genworth Financial Inc (GNW +6.71%) rallied following a report by Barron's that the mortgage insurer's stock could almost double in the next year, boosted by gains in mortgage and healthcare pricing. In contrast, Dick's Sporting Goods Inc (DKS -10.85%) tumbled after the retailer reported lower-than-expected fourth-quarter results and gave a disappointing forecast. None of the above mentioned companies match the fact-based investment system's guidelines. The most noteworthy high-ranked leaders are included on the Featured Stocks Page, a list that has recently expanded.
Any sustainable rally requires a healthy crop of companies hitting new 52-week highs, so it is always essential to see meaningful leadership (stocks hitting new 52-week highs). New buying efforts are justified under the fact-based system since Nasdaq Composite Index's solid gain on higher volume may be considered a follow-through day, shifting the market's (M criteria) direction to a confirmed rally again after a brief correction.
Watch for an announcement via email concerning the next WEBCAST. The webcast will also be available via an updated link highlighted at the top of the Premium Member Homepage.
PICTURED: The Dow Jones Industrial Average is up about +10%, for the year-to-date and it has tallied 7 consecutive gains.
|
 Kenneth J. Gruneisen started out as a licensed stockbroker in August 1987, a couple of months prior to the historic stock market crash that took the Dow Jones Industrial Average down -22.6% in a single day. He has published daily fact-based fundamental and technical analysis on high-ranked stocks online for two decades. Through FACTBASEDINVESTING.COM, Kenneth provides educational articles, news, market commentary, and other information regarding proven investment systems that work in good times and bad.
Comments contained in the body of this report are technical opinions only and are not necessarily those of Gruneisen Growth Corp. The material herein has been obtained from sources believed to be reliable and accurate, however, its accuracy and completeness cannot be guaranteed. Our firm, employees, and customers may effect transactions, including transactions contrary to any recommendation herein, or have positions in the securities mentioned herein or options with respect thereto. Any recommendation contained in this report may not be suitable for all investors and it is not to be deemed an offer or solicitation on our part with respect to the purchase or sale of any securities. |
|
 |
Financial Groups Led Gainers
Kenneth J. Gruneisen - Passed the CAN SLIM® Master's Exam
Strength in financial shares underpinned the major averages' rally on Monday as the Broker/Dealer Index ($XBD +0.53%) and Bank Index ($BKX +0.92%) posted decent gains. The tech sector had a slightly positive bias as the Semiconductor Index ($SOX +0.14%) and Biotechnology Index ($BTK +0.33%) posted small gains while the Networking Index ($NWX -0.02%) and Internet Index ($IIX +0.00%) finished flat.
The Gold & Silver Index ($XAU -0.25%) edged lower and energy-related shares were quiet as the Oil Services Index ($OSX -0.16%) and the Integrated Oil Index ($XOI +0.05%) finished flat. The Healthcare Index ($HMO +0.00%) and the Retail Index ($RLX +0.06%) were also virtually unchanged.
Charts courtesy www.stockcharts.com
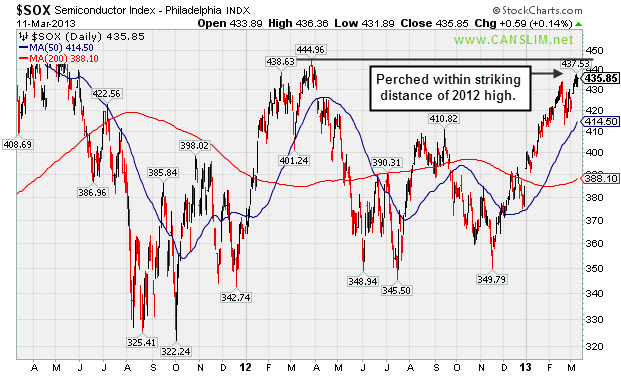
PICTURED: The Semiconductor Index ($SOX +0.14%) is perched within striking distance of its 2012 high after rallying more than +13.3% year to date.
| Oil Services |
$OSX |
244.36 |
-0.38 |
-0.16% |
+10.99% |
| Healthcare |
$HMO |
2,760.65 |
+0.00 |
+0.00% |
+9.80% |
| Integrated Oil |
$XOI |
1,347.86 |
+0.64 |
+0.05% |
+8.54% |
| Semiconductor |
$SOX |
435.85 |
+0.59 |
+0.14% |
+13.48% |
| Networking |
$NWX |
241.91 |
-0.05 |
-0.02% |
+6.78% |
| Internet |
$IIX |
368.74 |
+0.02 |
+0.00% |
+12.76% |
| Broker/Dealer |
$XBD |
110.60 |
+0.58 |
+0.53% |
+17.25% |
| Retail |
$RLX |
728.13 |
+0.45 |
+0.06% |
+11.50% |
| Gold & Silver |
$XAU |
132.97 |
-0.33 |
-0.25% |
-19.70% |
| Bank |
$BKX |
57.11 |
+0.52 |
+0.92% |
+11.37% |
| Biotech |
$BTK |
1,794.87 |
+5.82 |
+0.33% |
+16.02% |
|
|
|
 |
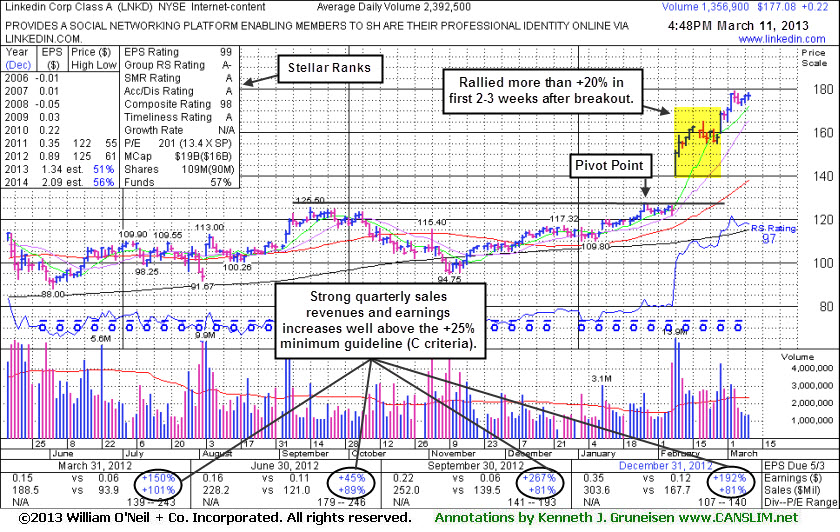
Extended From Base Following Breakaway Gap and Additional Volume-Driven Gains
Kenneth J. Gruneisen - Passed the CAN SLIM® Master's Exam
Linkedin Corp (LNKD +$26.39 or +21.27% to $150.48) is holding its ground stubbornly while perched near its all-time high. It is very extended from any sound base, yet may produce more climatic gains. It has recently been noted - "Disciplined investors may watch for secondary buy points or additional bases to possibly form and be noted in the weeks ahead." Having quickly rallied more than +20% in the first 2-3 weeks after its technical breakout, the investment system rules suggest holding such explosive winners for a minimum of 8 weeks to allow for potentially greater gains. Disciplined investors never hold any stock if it fails badly however, or if it falls more than -7% from their purchase price.
LNKD was last seen in this FSU section on 2/08/13 with an annotated graph under the headline -"Quickly Extended From Prior Highs Following Big Breakaway Gap", after highlighted in yellow in that day's mid-day report (read here) with a new pivot point cited based on its 1/28/13 high plus 10 cents. In reaction to its report of earnings +192% on +81% sales revenues for the Dec '12 quarter there was a considerable "breakaway gap" into new all-time high territory helped it blast from a 4-month cup-with-handle base. Longtime members may recall that a breakaway gap has previously been noted as the one exception which allows for new buying efforts more than +5% above prior highs, however risk increases the further one chases any stock above prior highs that an ordinary pullback may trigger the fact-based system's strict sell rule.
The stock rebounded impressively from lows below its 200-day moving average (DMA) line since dropped from the Featured Stocks list on 10/19/12. The company's fundamentals (C and A criteria) remain strong. The high-ranked leader from the Internet - Content Its Return On Equity of 13% is still below the 17% guideline, which is a minor concern. Ownership by top-rated funds has been on the rise, increasing from 185 in Sep '11 to 828 in Dec '12, a very reassuring sign concerning the I criteria. Its current Up/Down Volume Ratio of 1.6 is an unbiased indication that its shares have been under accumulation over the past 50 days.
|
|
|
Color Codes Explained :
Y - Better candidates highlighted by our
staff of experts.
G - Previously featured
in past reports as yellow but may no longer be buyable under the
guidelines.
***Last / Change / Volume data in this table is the closing quote data***
Symbol/Exchange
Company Name
Industry Group |
PRICE |
CHANGE
(%Change) |
Day High |
Volume
(% DAV)
(% 50 day avg vol) |
52 Wk Hi
% From Hi |
Featured
Date |
Price
Featured |
Pivot Featured |
|
Max Buy |
CELG
-
NASDAQ
Celgene Corp
DRUGS - Drug Manufacturers - Major
|
$111.92
|
+0.56
0.50% |
$112.09
|
3,362,501
86.90% of 50 DAV
50 DAV is 3,869,500
|
$111.80
0.11%
|
12/11/2012
|
$82.24
|
PP = $81.34
|
|
MB = $85.41
|
Most Recent Note - 3/5/2013 1:52:36 PM
G - Hitting new all-time highs yet again with today's gain, getting extended from any sound base. Recent lows in the $96 area define near-term support above its 50 DMA line.
>>> The latest Featured Stock Update with an annotated graph appeared on 2/28/2013. Click here.
View all notes |
Alert me of new notes |
CANSLIM.net Company Profile |
SEC |
Zacks Reports |
StockTalk |
News |
Chart |
Request a new note
C
A N
S L
I M


|
CFNL
-
NASDAQ
Cardinal Financial Corp
BANKING - Regional - Southeast Banks
|
$17.80
|
-0.20
-1.11% |
$18.10
|
383,388
186.02% of 50 DAV
50 DAV is 206,100
|
$18.19
-2.14%
|
3/7/2013
|
$17.27
|
PP = $16.77
|
|
MB = $17.61
|
Most Recent Note - 3/8/2013 12:13:11 PM
Y - Gapped up and hit another new 52-week high while trading near its "max buy" level with above average volume behind today's 7th consecutive gain. Prior session's gain was backed by volume +169% above average as it rose above the new pivot point cited based upon its 2/15/13 high, clearing a "double bottom" base and triggering a proper technical buy signal under the fact-based system.
>>> The latest Featured Stock Update with an annotated graph appeared on 2/21/2013. Click here.
View all notes |
Alert me of new notes |
CANSLIM.net Company Profile |
SEC |
Zacks Reports |
StockTalk |
News |
Chart |
Request a new note
C
A N
S L
I M
|
CMCSA
-
NASDAQ
Comcast Corp Cl A
MEDIA - CATV Systems
|
$41.14
|
+0.14
0.33% |
$41.14
|
8,461,613
61.94% of 50 DAV
50 DAV is 13,661,700
|
$42.00
-2.06%
|
12/3/2012
|
$37.08
|
PP = $38.06
|
|
MB = $39.96
|
Most Recent Note - 3/5/2013 1:41:04 PM
G - Volume totals have been cooling in the past week while consolidating above support at its 50 DMA line and still perched very near its 52-week high. Reported earnings +11% on +6% sales revenues for the Dec '12 quarter, below the +25% minimum earnings guideline (C criteria), raising fundamental concerns
>>> The latest Featured Stock Update with an annotated graph appeared on 2/19/2013. Click here.
View all notes |
Alert me of new notes |
CANSLIM.net Company Profile |
SEC |
Zacks Reports |
StockTalk |
News |
Chart |
Request a new note
C
A N
S L
I M
|
EVER
-
NYSE
Everbank Financial Corp
BANKING
|
$16.72
|
+0.25
1.52% |
$16.78
|
924,755
127.92% of 50 DAV
50 DAV is 722,900
|
$17.29
-3.30%
|
3/4/2013
|
$15.38
|
PP = $15.83
|
|
MB = $16.62
|
Most Recent Note - 3/8/2013 12:20:32 PM
Y - Retreating below its "max buy" level with today's pullback and its color code is changed to yellow. Prior highs in the $16 area define initial chart support to watch on pullbacks.
>>> The latest Featured Stock Update with an annotated graph appeared on 3/4/2013. Click here.
View all notes |
Alert me of new notes |
CANSLIM.net Company Profile |
SEC |
Zacks Reports |
StockTalk |
News |
Chart |
Request a new note
C
A N
S L
I M
|
JAZZ
-
NASDAQ
Jazz Pharmaceuticals Plc
DRUGS - Biotechnology
|
$59.25
|
+0.75
1.28% |
$59.69
|
1,042,889
213.93% of 50 DAV
50 DAV is 487,500
|
$60.25
-1.66%
|
3/5/2013
|
$59.10
|
PP = $60.10
|
|
MB = $63.11
|
 Most Recent Note - 3/11/2013 12:25:09 PM
Y - Holding its ground since completing a Secondary Offering on 3/05/13. Disciplined investors may watch for a volume-driven gain above the pivot point to trigger a technical buy signal before new buying efforts may be justified under the fact-based investment system. See the latest FSU analysis for more details and a new annotated graph.
>>> The latest Featured Stock Update with an annotated graph appeared on 3/7/2013. Click here.
View all notes |
Alert me of new notes |
CANSLIM.net Company Profile |
SEC |
Zacks Reports |
StockTalk |
News |
Chart |
Request a new note
C
A N
S L
I M
|
Symbol/Exchange
Company Name
Industry Group |
PRICE |
CHANGE
(%Change) |
Day High |
Volume
(% DAV)
(% 50 day avg vol) |
52 Wk Hi
% From Hi |
Featured
Date |
Price
Featured |
Pivot Featured |
|
Max Buy |
KORS
-
NYSE
Michael Kors Hldgs Ltd
RETAIL - Apparel Stores
|
$55.00
|
-3.19
-5.48% |
$57.86
|
11,399,138
198.84% of 50 DAV
50 DAV is 5,732,900
|
$65.10
-15.51%
|
1/23/2013
|
$54.98
|
PP = $58.72
|
|
MB = $61.66
|
Most Recent Note - 3/11/2013 11:04:56 AM
G - Color code is changed to green while slumping below prior highs in the $58 area and violating its 50 DMA line raising concerns. Completed another Secondary Offering 2/20/13 while perched near its all-time high.
>>> The latest Featured Stock Update with an annotated graph appeared on 3/8/2013. Click here.
View all notes |
Alert me of new notes |
CANSLIM.net Company Profile |
SEC |
Zacks Reports |
StockTalk |
News |
Chart |
Request a new note
C
A N
S L
I M
|
LNKD
-
NYSE
Linkedin Corp Class A
INTERNET - Internet Information Providers
|
$177.08
|
+0.22
0.12% |
$178.38
|
1,357,638
56.75% of 50 DAV
50 DAV is 2,392,500
|
$179.35
-1.27%
|
2/8/2013
|
$147.04
|
PP = $127.55
|
|
MB = $133.93
|
Most Recent Note - 3/11/2013 5:39:34 PM
G - Very extended from its prior base, but having rallied more than +20% in the first 2-3 weeks after its breakout, the investment system rules suggest holding such winners for a minimum of 8 weeks. See the latest FSU analysis for more details and a new annotated graph.
>>> The latest Featured Stock Update with an annotated graph appeared on 3/11/2013. Click here.
View all notes |
Alert me of new notes |
CANSLIM.net Company Profile |
SEC |
Zacks Reports |
StockTalk |
News |
Chart |
Request a new note
C
A N
S L
I M
|
LOPE
-
NASDAQ
Grand Canyon Education
DIVERSIFIED SERVICES - Education and; Training Services
|
$24.09
|
+0.02
0.08% |
$24.28
|
195,612
41.84% of 50 DAV
50 DAV is 467,500
|
$27.18
-11.37%
|
2/20/2013
|
$26.44
|
PP = $25.10
|
|
MB = $26.36
|
Most Recent Note - 3/5/2013 6:39:20 PM
G - Rebounded near its 50 DMA line with today's gain on lighter (near average) volume. That short-term average may now act as resistance. It quickly negated its recent technical breakout.
>>> The latest Featured Stock Update with an annotated graph appeared on 2/20/2013. Click here.
View all notes |
Alert me of new notes |
CANSLIM.net Company Profile |
SEC |
Zacks Reports |
StockTalk |
News |
Chart |
Request a new note
C
A N
S L
I M
|
MIDD
-
NASDAQ
Middleby Corp
MANUFACTURING - Diversified Machinery
|
$150.50
|
+0.50
0.33% |
$150.55
|
53,103
58.23% of 50 DAV
50 DAV is 91,200
|
$154.74
-2.74%
|
10/8/2012
|
$118.46
|
PP = $122.67
|
|
MB = $128.80
|
Most Recent Note - 3/5/2013 1:44:24 PM
G - Hovering near all-time highs today. Fundamental concerns were recently noted and prior reports cautioned members that it is extended from any sound base. Its 50 DMA line defines important near-term chart support above prior highs in the $134-135 area.
>>> The latest Featured Stock Update with an annotated graph appeared on 2/25/2013. Click here.
View all notes |
Alert me of new notes |
CANSLIM.net Company Profile |
SEC |
Zacks Reports |
StockTalk |
News |
Chart |
Request a new note
C
A N
S L
I M
|
MWIV
-
NASDAQ
M W I Veterinary Supply
HEALTH SERVICES - Medical Instruments and; Supplies
|
$131.75
|
-3.16
-2.34% |
$134.71
|
81,830
152.67% of 50 DAV
50 DAV is 53,600
|
$137.18
-3.96%
|
3/4/2013
|
$130.90
|
PP = $129.45
|
|
MB = $135.92
|
Most Recent Note - 3/11/2013 6:13:30 PM
Y - Fell with above average volume today, its 2nd distribution day since hitting its all-time high last week. Color code is changed to yellow after retreating below its "max buy" level. Subsequent deterioration below its pivot point would raise concerns and could negate its latest breakout.
>>> The latest Featured Stock Update with an annotated graph appeared on 3/6/2013. Click here.
View all notes |
Alert me of new notes |
CANSLIM.net Company Profile |
SEC |
Zacks Reports |
StockTalk |
News |
Chart |
Request a new note
C
A N
S L
I M
|
Symbol/Exchange
Company Name
Industry Group |
PRICE |
CHANGE
(%Change) |
Day High |
Volume
(% DAV)
(% 50 day avg vol) |
52 Wk Hi
% From Hi |
Featured
Date |
Price
Featured |
Pivot Featured |
|
Max Buy |
N
-
NYSE
Netsuite Inc
DIVERSIFIED SERVICES - Business/Management Services
|
$75.56
|
+0.56
0.75% |
$75.68
|
303,467
88.04% of 50 DAV
50 DAV is 344,700
|
$75.75
-0.25%
|
12/12/2012
|
$64.75
|
PP = $67.12
|
|
MB = $70.48
|
Most Recent Note - 3/8/2013 1:10:41 PM
G - Perched at its 52-week and all-time high, holding its ground following a streak of 7 consecutive volume-driven gains. Its 50 DMA line acted as support during the recent consolidation.
>>> The latest Featured Stock Update with an annotated graph appeared on 3/1/2013. Click here.
View all notes |
Alert me of new notes |
CANSLIM.net Company Profile |
SEC |
Zacks Reports |
StockTalk |
News |
Chart |
Request a new note
C
A N
S L
I M
|
NSR
-
NYSE
Neustar Inc
TELECOMMUNICATIONS - Diversified Communication Serv
|
$45.20
|
+0.06
0.13% |
$45.22
|
319,129
71.03% of 50 DAV
50 DAV is 449,300
|
$47.24
-4.32%
|
3/8/2013
|
$44.99
|
PP = $47.34
|
|
MB = $49.71
|
Most Recent Note - 3/8/2013 1:08:01 PM
Y - Consolidating above its 50 DMA line today after small gains this week backed by below average volume. Color code is changed to yellow with new pivot point cited based on its 2/27/13 high plus 10 cents while forming a "square box" base. Volume-driven gains above the pivot point may trigger a new (or add-on) technical buy signal. The 2/21/13 low ($42.40) defines important near-term support where any subsequent deterioration would raise greater concerns and trigger a worrisome technical sell signal.
>>> The latest Featured Stock Update with an annotated graph appeared on 2/27/2013. Click here.
View all notes |
Alert me of new notes |
CANSLIM.net Company Profile |
SEC |
Zacks Reports |
StockTalk |
News |
Chart |
Request a new note
C
A N
S L
I M
|
QIHU
-
NYSE
Qihoo 360 Technology Ads
INTERNET - Internet Service Providers
|
$31.81
|
-0.25
-0.78% |
$32.00
|
1,241,954
48.71% of 50 DAV
50 DAV is 2,549,500
|
$34.90
-8.85%
|
3/5/2013
|
$34.63
|
PP = $34.47
|
|
MB = $36.19
|
Most Recent Note - 3/6/2013 11:16:26 AM
G - Gapped down today after reporting earnings +10% on +65% sales revenues for the Dec '12 quarter, below the +25% minimum earnings guideline (C criteria) raising fundamental concerns. Color code is changed to green based the sub par results and the abrupt reversal from its new 52-week high hit on the prior session. Prior mid-day reports cautioned - "Deceleration in its sales revenues and earnings growth rate in sequential quarterly comparisons through Sep '12 is cause for concern. Faces additional overhead supply up through the $36 area. Found support at its 200 DMA line in recent weeks This Chinese Computer Software - Security firm's quarterly earnings (C criteria) and sales revenues increases have been strong." See the latest FSU analysis for more details and a new annotated graph under the headline, "Earnings Below Guideline Raised Concerns After Technical Breakout".
>>> The latest Featured Stock Update with an annotated graph appeared on 3/5/2013. Click here.
View all notes |
Alert me of new notes |
CANSLIM.net Company Profile |
SEC |
Zacks Reports |
StockTalk |
News |
Chart |
Request a new note
C
A N
S L
I M
|
SLCA
-
NYSE
U S Silica Holdings Inc
CHEMICALS - Specialty Chemicals
|
$26.53
|
+0.10
0.38% |
$28.50
|
754,989
143.13% of 50 DAV
50 DAV is 527,500
|
$27.86
-4.78%
|
2/26/2013
|
$22.23
|
PP = $21.50
|
|
MB = $22.58
|
Most Recent Note - 3/8/2013 1:21:55 PM
G - Adding to its spurt of volume-driven gains and hitting a yet another new 52-week high with today's considerable gain. Very extended from its prior base, but having rallied more than +20% in the first 2-3 weeks after its breakout, the investment system rules suggest holding such winners for a minimum of 8 weeks.
>>> The latest Featured Stock Update with an annotated graph appeared on 2/26/2013. Click here.
View all notes |
Alert me of new notes |
CANSLIM.net Company Profile |
SEC |
Zacks Reports |
StockTalk |
News |
Chart |
Request a new note
C
A N
S L
I M
|
VRX
-
NYSE
Valeant Pharmaceuticals
DRUGS - Drug Manufacturers - Other
|
$70.53
|
-0.25
-0.35% |
$71.49
|
901,341
68.80% of 50 DAV
50 DAV is 1,310,000
|
$70.85
-0.45%
|
12/20/2012
|
$60.24
|
PP = $61.21
|
|
MB = $64.27
|
Most Recent Note - 3/5/2013 1:50:31 PM
Y - Hitting another new 52-week high with today's 5th consecutive gain. A valid secondary buy point exists following the successful test of support at its 10-week moving average up to as high as +5% above the recent high ($67.98 plus 5% or $71.38). Color code is changed to yellow however no new pivot point is cited since a new base was not formed. The 50 DMA line and recent low ($64.05 on 2/21/13) define the next important support area to watch.
>>> The latest Featured Stock Update with an annotated graph appeared on 2/15/2013. Click here.
View all notes |
Alert me of new notes |
CANSLIM.net Company Profile |
SEC |
Zacks Reports |
StockTalk |
News |
Chart |
Request a new note
C
A N
S L
I M
|
Symbol/Exchange
Company Name
Industry Group |
PRICE |
CHANGE
(%Change) |
Day High |
Volume
(% DAV)
(% 50 day avg vol) |
52 Wk Hi
% From Hi |
Featured
Date |
Price
Featured |
Pivot Featured |
|
Max Buy |
|
|
|
THESE ARE NOT BUY RECOMMENDATIONS!
Comments contained in the body of this report are technical
opinions only. The material herein has been obtained
from sources believed to be reliable and accurate, however,
its accuracy and completeness cannot be guaranteed.
This site is not an investment advisor, hence it does
not endorse or recommend any securities or other investments.
Any recommendation contained in this report may not
be suitable for all investors and it is not to be deemed
an offer or solicitation on our part with respect to
the purchase or sale of any securities. All trademarks,
service marks and trade names appearing in this report
are the property of their respective owners, and are
likewise used for identification purposes only.
This report is a service available
only to active Paid Premium Members.
You may opt-out of receiving report notifications
at any time. Questions or comments may be submitted
by writing to Premium Membership Services 665 S.E. 10 Street, Suite 201 Deerfield Beach, FL 33441-5634 or by calling 1-800-965-8307
or 954-785-1121.
|
|
|

