You are not logged in.
This means you
CAN ONLY VIEW reports that were published prior to Monday, March 10, 2025.
You
MUST UPGRADE YOUR MEMBERSHIP if you want to see any current reports.
AFTER MARKET UPDATE - FRIDAY, MARCH 8TH, 2013
Previous After Market Report Next After Market Report >>>
|
|
|
|
DOW |
+67.58 |
14,397.07 |
+0.47% |
|
Volume |
690,518,370 |
-3% |
|
Volume |
1,571,267,510 |
-3% |
|
NASDAQ |
+12.28 |
3,244.37 |
+0.38% |
|
Advancers |
2,017 |
65% |
|
Advancers |
1,680 |
65% |
|
S&P 500 |
+6.92 |
1,551.18 |
+0.45% |
|
Decliners |
977 |
31% |
|
Decliners |
793 |
31% |
|
Russell 2000 |
+7.93 |
942.50 |
+0.85% |
|
52 Wk Highs |
348 |
|
|
52 Wk Highs |
253 |
|
|
S&P 600 |
+4.24 |
525.72 |
+0.81% |
|
52 Wk Lows |
13 |
|
|
52 Wk Lows |
8 |
|
|
 |
Positive Breadth But Lighter Volume as Rally Continues
Kenneth J. Gruneisen - Passed the CAN SLIM® Master's Exam
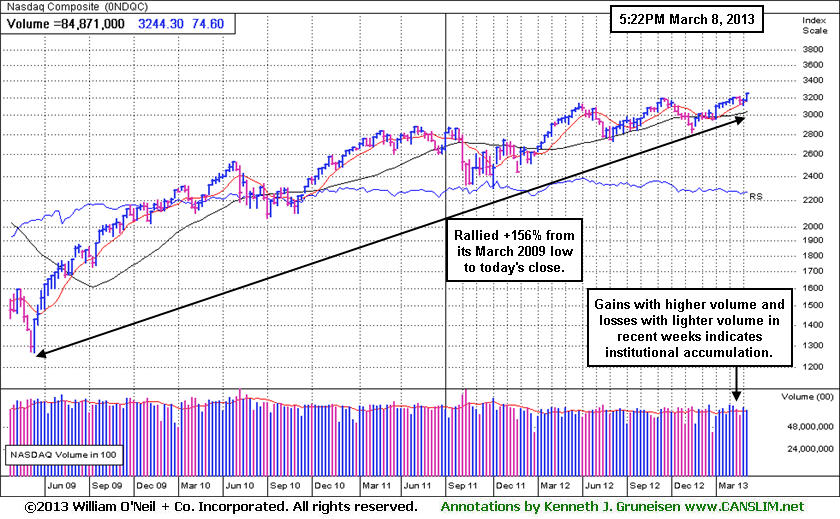
For the week, the Nasdaq Composite Index advanced +2.4% as the S&P 500 Index and the Dow Jones Industrial Average each posted a gain of +2.2%. The S&P 500 climbed for its sixth straight day, putting it less than 1% from an all-time closing high. The benchmark S&P index rose for its ninth positive week out of the last 10. All three major stock indexes racked up their biggest weekly gains since the first week of the year. Behind Friday's small gains for the major averages the volume totals reported were lighter than the prior session total on the NYSE and on the Nasdaq exchange. Breadth was positive as advancers led decliners by a 2-1 margin on the NYSE and on the Nasdaq exchange. The total number of stocks hitting new 52-week highs (leadership) expanded and new highs solidly outnumbered new 52-week lows on the NYSE and on the Nasdaq exchange. There were 100 high-ranked companies from the CANSLIM.net Leaders List making new 52-week highs and appearing on the CANSLIM.net BreakOuts Page, up nicely from the prior session's total of 60 stocks. There were gains for 13 of the 16 high-ranked companies currently included on the Featured Stocks Page, a list that has recently expanded with a few new added leaders. Coupled with solid leadership, the Nasdaq Composite Index's solid +1.32% gain on higher volume Tuesday was considered a follow-through day, shifting the market's (M criteria) direction to a confirmed rally again after a brief correction.
Hiring in the United States jumped in February with non-farm payrolls adding 236,000 last month, surging past expectations for a gain of 160,000 jobs and even topping the highest forecast of analysts polled by Reuters. The unemployment rate fell to 7.7%, the lowest since December 2008. Wholesale inventories added to the stream of positive economic data. In January, U.S. wholesale inventories increased +1.2% to $504.4 billion - the fastest pace of growth since December 2011. The strong January reading followed a revised +0.1% rise in December 2012.
The Federal Reserve's "stress test" results were largely positive and as expected. In response to the Fed saying the biggest U.S. banks had enough capital to withstand a severe economic downturn the Dow Jones Industrial Average hit yet another record closing high.
Nine of the 30 Dow components hit new highs for the year, including General Electric Co (GE +0.38%), Johnson & Johnson (JNJ +0.57%) and Chevron Corp (CVX +0.01%). None of the above mentioned companies meets the fact-based investment system's "stress test". The most noteworthy high-ranked leaders are included on the Featured Stocks Page, a list that has recently expanded.
Pandora Media Inc (P +17.56%) rallied on stronger-than-expected quarterly results, however, the leader in Internet-streaming radio unexpectedly said that its CEO Joseph Kennedy was stepping down. Skullcandy Inc (SKUL -22.5) dove after the headphone maker said it expects to post a loss in the current quarter although fourth-quarter revenue had been higher than expected.
Any sustainable rally requires a healthy crop of companies hitting new 52-week highs, so it is always essential to see meaningful leadership (stocks hitting new 52-week highs). New buying efforts are justified under the fact-based system since Nasdaq Composite Index's solid gain on higher volume may be considered a follow-through day, shifting the market's (M criteria) direction to a confirmed rally again after a brief correction.
Watch for an announcement via email concerning the next WEBCAST. The webcast will also be available via an updated link highlighted at the top of the Premium Member Homepage.
PICTURED: The Nasdaq Composite Index in recent weeks has seen gains on higher volume and losses on lighter volume, technically, action which is indicative of institutional "accumulation" while rallying into new high territory. The tech-heavy index has risen +156% from its March 2009 low. For the year, the Dow Jones Industrial Average is up +9.9%, while the S&P 500 Index is up +8.8% and the Nasdaq Composite Index is up about +7.5%.
|
 Kenneth J. Gruneisen started out as a licensed stockbroker in August 1987, a couple of months prior to the historic stock market crash that took the Dow Jones Industrial Average down -22.6% in a single day. He has published daily fact-based fundamental and technical analysis on high-ranked stocks online for two decades. Through FACTBASEDINVESTING.COM, Kenneth provides educational articles, news, market commentary, and other information regarding proven investment systems that work in good times and bad.
Comments contained in the body of this report are technical opinions only and are not necessarily those of Gruneisen Growth Corp. The material herein has been obtained from sources believed to be reliable and accurate, however, its accuracy and completeness cannot be guaranteed. Our firm, employees, and customers may effect transactions, including transactions contrary to any recommendation herein, or have positions in the securities mentioned herein or options with respect thereto. Any recommendation contained in this report may not be suitable for all investors and it is not to be deemed an offer or solicitation on our part with respect to the purchase or sale of any securities. |
|
 |
Retail, Financial, Defensive, and Commodity-Linked Groups Rose
Kenneth J. Gruneisen - Passed the CAN SLIM® Master's Exam
The Retail Index ($RLX +0.94%) and financial groups were a positive influence on the major averages as the Broker/Dealer Index ($XBD +0.47%) and Bank Index ($BKX +0.57%) each posted modest gains. Defensive and commodity linked groups also had a positive bias on Friday as the Healthcare Index ($HMO +1.11%), Gold & Silver Index ($XAU +0.52%), and Oil Services Index ($OSX +0.91%) each tallied a solid gain. The Biotechnology Index ($BTK +0.40%) edged higher while the rest of the tech sector was indecisive and the Networking Index ($NWX -0.05%), Internet Index ($IIX +0.12%), and Semiconductor Index ($SOX +0.13%) were little changed on the session.
Charts courtesy www.stockcharts.com
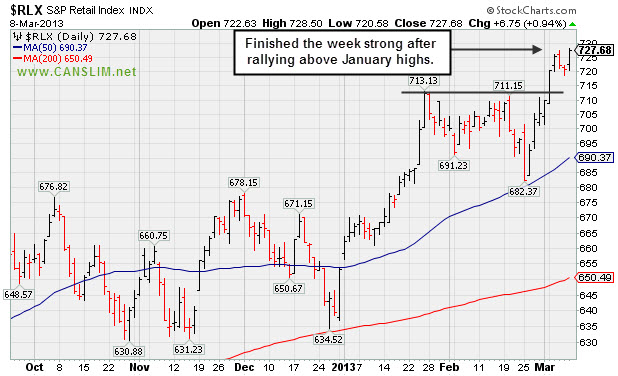
PICTURED: The Retail Index ($RLX +0.94%) finished the week strong after rallyng above the January highs. The bullish action in 2013 is an encouraging sign that consumers are continuing to spend despite the expiration of the payroll tax holiday which directly impacted millions of workers' paychecks.
| Oil Services |
$OSX |
244.74 |
+2.20 |
+0.91% |
+11.16% |
| Healthcare |
$HMO |
2,760.65 |
+30.43 |
+1.11% |
+9.80% |
| Integrated Oil |
$XOI |
1,347.22 |
-0.31 |
-0.02% |
+8.49% |
| Semiconductor |
$SOX |
435.26 |
+0.58 |
+0.13% |
+13.33% |
| Networking |
$NWX |
241.96 |
-0.11 |
-0.05% |
+6.80% |
| Internet |
$IIX |
368.72 |
+0.46 |
+0.12% |
+12.76% |
| Broker/Dealer |
$XBD |
110.02 |
+0.51 |
+0.47% |
+16.63% |
| Retail |
$RLX |
727.68 |
+6.75 |
+0.94% |
+11.43% |
| Gold & Silver |
$XAU |
133.30 |
+0.69 |
+0.52% |
-19.50% |
| Bank |
$BKX |
56.59 |
+0.32 |
+0.57% |
+10.35% |
| Biotech |
$BTK |
1,789.04 |
+7.20 |
+0.40% |
+15.64% |
|
|
|
 |
Following Another Secondary Offering Relative Strength Rank Has Slumped
Kenneth J. Gruneisen - Passed the CAN SLIM® Master's Exam
Michael Kors Hldgs Ltd (KORS -$0.02 or -0.03% to $58.19) is consolidating below its "max buy" level and near prior highs in the $58 area which define important support above its 50-day moving average (DMA) line (now $56.41). It completed another Secondary Offering 2/20/13 while perched near its all-time high. Such offerings often are a short-term hindrance to upward price progress yet typically result in broader institutional ownership interest. It was last in this FSU section on 2/07/13 with an annotated graph under the headline, " Base Building Continues After Positive Reversal Near 50 Day Average. This high-ranked Apparel - Clothing Manufacturing firm has headquarters in Hong Kong. It cleared the stubborn resistance with a "breakaway gap" on 2/12/13 but encountered distributional pressure soon thereafter and it has almost completely negated the technical breakout. Healthy stocks do not typically fall more than -7% below their pivot point in a bullish market environment, so members are cautioned to watch out if damage starts to mount.
Its strong quarterly and annual earnings history (C and A criteria) meet the fundamental guidelines of the fact-based investment system. It has traded up considerably from its 12/15/11 IPO priced at $20. The number of top-rated funds owning its shares rose from 326 n Mar '12 to 542 in Dec '12, a reassuring sign concerning the I criteria. Its current Up/Down Volume Ratio of 1.2 is an unbiased indication that its shares have been under slight accumulation over the past 50 days. However, its Relative Strength Rating has slumped to 75 (see red circle) below the 80+ minimum guideline for buy candidates.

|
|
|
Color Codes Explained :
Y - Better candidates highlighted by our
staff of experts.
G - Previously featured
in past reports as yellow but may no longer be buyable under the
guidelines.
***Last / Change / Volume data in this table is the closing quote data***
Symbol/Exchange
Company Name
Industry Group |
PRICE |
CHANGE
(%Change) |
Day High |
Volume
(% DAV)
(% 50 day avg vol) |
52 Wk Hi
% From Hi |
Featured
Date |
Price
Featured |
Pivot Featured |
|
Max Buy |
CELG
-
NASDAQ
Celgene Corp
DRUGS - Drug Manufacturers - Major
|
$111.36
|
+1.18
1.07% |
$111.80
|
2,736,778
71.21% of 50 DAV
50 DAV is 3,843,200
|
$110.80
0.51%
|
12/11/2012
|
$82.24
|
PP = $81.34
|
|
MB = $85.41
|
Most Recent Note - 3/5/2013 1:52:36 PM
G - Hitting new all-time highs yet again with today's gain, getting extended from any sound base. Recent lows in the $96 area define near-term support above its 50 DMA line.
>>> The latest Featured Stock Update with an annotated graph appeared on 2/28/2013. Click here.
View all notes |
Alert me of new notes |
CANSLIM.net Company Profile |
SEC |
Zacks Reports |
StockTalk |
News |
Chart |
Request a new note
C
A N
S L
I M


|
CFNL
-
NASDAQ
Cardinal Financial Corp
BANKING - Regional - Southeast Banks
|
$18.00
|
+0.69
3.99% |
$18.19
|
461,705
233.42% of 50 DAV
50 DAV is 197,800
|
$17.42
3.33%
|
3/7/2013
|
$17.27
|
PP = $16.77
|
|
MB = $17.61
|
 Most Recent Note - 3/8/2013 12:13:11 PM
Y - Gapped up and hit another new 52-week high while trading near its "max buy" level with above average volume behind today's 7th consecutive gain. Prior session's gain was backed by volume +169% above average as it rose above the new pivot point cited based upon its 2/15/13 high, clearing a "double bottom" base and triggering a proper technical buy signal under the fact-based system.
>>> The latest Featured Stock Update with an annotated graph appeared on 2/21/2013. Click here.
View all notes |
Alert me of new notes |
CANSLIM.net Company Profile |
SEC |
Zacks Reports |
StockTalk |
News |
Chart |
Request a new note
C
A N
S L
I M
|
CMCSA
-
NASDAQ
Comcast Corp Cl A
MEDIA - CATV Systems
|
$41.00
|
+0.38
0.94% |
$41.17
|
11,391,263
84.37% of 50 DAV
50 DAV is 13,501,900
|
$42.00
-2.38%
|
12/3/2012
|
$37.08
|
PP = $38.06
|
|
MB = $39.96
|
Most Recent Note - 3/5/2013 1:41:04 PM
G - Volume totals have been cooling in the past week while consolidating above support at its 50 DMA line and still perched very near its 52-week high. Reported earnings +11% on +6% sales revenues for the Dec '12 quarter, below the +25% minimum earnings guideline (C criteria), raising fundamental concerns
>>> The latest Featured Stock Update with an annotated graph appeared on 2/19/2013. Click here.
View all notes |
Alert me of new notes |
CANSLIM.net Company Profile |
SEC |
Zacks Reports |
StockTalk |
News |
Chart |
Request a new note
C
A N
S L
I M
|
EVER
-
NYSE
Everbank Financial Corp
BANKING
|
$16.47
|
-0.50
-2.95% |
$17.08
|
2,331,031
343.20% of 50 DAV
50 DAV is 679,200
|
$17.29
-4.74%
|
3/4/2013
|
$15.38
|
PP = $15.83
|
|
MB = $16.62
|
Most Recent Note - 3/8/2013 12:20:32 PM
Y - Retreating below its "max buy" level with today's pullback and its color code is changed to yellow. Prior highs in the $16 area define initial chart support to watch on pullbacks.
>>> The latest Featured Stock Update with an annotated graph appeared on 3/4/2013. Click here.
View all notes |
Alert me of new notes |
CANSLIM.net Company Profile |
SEC |
Zacks Reports |
StockTalk |
News |
Chart |
Request a new note
C
A N
S L
I M
|
JAZZ
-
NASDAQ
Jazz Pharmaceuticals Plc
DRUGS - Biotechnology
|
$58.50
|
+0.32
0.55% |
$59.20
|
476,535
99.15% of 50 DAV
50 DAV is 480,600
|
$60.25
-2.90%
|
3/5/2013
|
$59.10
|
PP = $60.10
|
|
MB = $63.11
|
Most Recent Note - 3/7/2013 7:05:01 PM
Y - Pulled back with light volume today. On 3/05/13 it completed a Secondary Offering and was highlighted in yellow with new pivot point cited based on its 10/05/12 high plus 10 cents in the mid-day report (read here). Volume-driven gains above the pivot point may trigger a technical buy signal. See the latest FSU analysis for more details and a new annotated graph.
>>> The latest Featured Stock Update with an annotated graph appeared on 3/7/2013. Click here.
View all notes |
Alert me of new notes |
CANSLIM.net Company Profile |
SEC |
Zacks Reports |
StockTalk |
News |
Chart |
Request a new note
C
A N
S L
I M
|
Symbol/Exchange
Company Name
Industry Group |
PRICE |
CHANGE
(%Change) |
Day High |
Volume
(% DAV)
(% 50 day avg vol) |
52 Wk Hi
% From Hi |
Featured
Date |
Price
Featured |
Pivot Featured |
|
Max Buy |
KORS
-
NYSE
Michael Kors Hldgs Ltd
RETAIL - Apparel Stores
|
$58.19
|
-0.02
-0.03% |
$58.95
|
6,452,604
114.83% of 50 DAV
50 DAV is 5,619,400
|
$65.10
-10.61%
|
1/23/2013
|
$54.98
|
PP = $58.72
|
|
MB = $61.66
|
Most Recent Note - 3/8/2013 7:11:49 PM
Y - Color code was changed to yellow while consolidating below its "max buy" level and near prior highs in the $58 area which define important support above its 50 DMA line. Completed another Secondary Offering 2/20/13 while perched near its all-time high. See the latest FSU analysis for more details and a new annotated graph.
>>> The latest Featured Stock Update with an annotated graph appeared on 3/8/2013. Click here.
View all notes |
Alert me of new notes |
CANSLIM.net Company Profile |
SEC |
Zacks Reports |
StockTalk |
News |
Chart |
Request a new note
C
A N
S L
I M
|
LNKD
-
NYSE
Linkedin Corp Class A
INTERNET - Internet Information Providers
|
$176.86
|
+1.50
0.86% |
$177.34
|
1,337,035
56.28% of 50 DAV
50 DAV is 2,375,700
|
$179.35
-1.39%
|
2/8/2013
|
$147.04
|
PP = $127.55
|
|
MB = $133.93
|
Most Recent Note - 3/8/2013 1:14:00 PM
G - Holding its ground stubbornly while perched near its all-time high. It is very extended from any sound base, yet may produce more climatic gains. Previously noted - "Disciplined investors may watch for secondary buy points or additional bases to possibly form and be noted in the weeks ahead."
>>> The latest Featured Stock Update with an annotated graph appeared on 2/8/2013. Click here.
View all notes |
Alert me of new notes |
CANSLIM.net Company Profile |
SEC |
Zacks Reports |
StockTalk |
News |
Chart |
Request a new note
C
A N
S L
I M
|
LOPE
-
NASDAQ
Grand Canyon Education
DIVERSIFIED SERVICES - Education and; Training Services
|
$24.07
|
+0.34
1.43% |
$24.20
|
402,573
87.02% of 50 DAV
50 DAV is 462,600
|
$27.18
-11.44%
|
2/20/2013
|
$26.44
|
PP = $25.10
|
|
MB = $26.36
|
Most Recent Note - 3/5/2013 6:39:20 PM
G - Rebounded near its 50 DMA line with today's gain on lighter (near average) volume. That short-term average may now act as resistance. It quickly negated its recent technical breakout.
>>> The latest Featured Stock Update with an annotated graph appeared on 2/20/2013. Click here.
View all notes |
Alert me of new notes |
CANSLIM.net Company Profile |
SEC |
Zacks Reports |
StockTalk |
News |
Chart |
Request a new note
C
A N
S L
I M
|
MIDD
-
NASDAQ
Middleby Corp
MANUFACTURING - Diversified Machinery
|
$150.00
|
+1.18
0.79% |
$150.93
|
85,329
95.02% of 50 DAV
50 DAV is 89,800
|
$154.74
-3.06%
|
10/8/2012
|
$118.46
|
PP = $122.67
|
|
MB = $128.80
|
Most Recent Note - 3/5/2013 1:44:24 PM
G - Hovering near all-time highs today. Fundamental concerns were recently noted and prior reports cautioned members that it is extended from any sound base. Its 50 DMA line defines important near-term chart support above prior highs in the $134-135 area.
>>> The latest Featured Stock Update with an annotated graph appeared on 2/25/2013. Click here.
View all notes |
Alert me of new notes |
CANSLIM.net Company Profile |
SEC |
Zacks Reports |
StockTalk |
News |
Chart |
Request a new note
C
A N
S L
I M
|
MWIV
-
NASDAQ
M W I Veterinary Supply
HEALTH SERVICES - Medical Instruments and; Supplies
|
$134.91
|
+0.03
0.02% |
$135.60
|
60,998
115.31% of 50 DAV
50 DAV is 52,900
|
$137.18
-1.65%
|
3/4/2013
|
$130.90
|
PP = $129.45
|
|
MB = $135.92
|
Most Recent Note - 3/6/2013 6:35:22 PM
G - Color code is changed to green after rallying beyond its "max buy" level with another volume-driven gain. See the latest FSU analysis for more details and a new annotated graph.
>>> The latest Featured Stock Update with an annotated graph appeared on 3/6/2013. Click here.
View all notes |
Alert me of new notes |
CANSLIM.net Company Profile |
SEC |
Zacks Reports |
StockTalk |
News |
Chart |
Request a new note
C
A N
S L
I M
|
Symbol/Exchange
Company Name
Industry Group |
PRICE |
CHANGE
(%Change) |
Day High |
Volume
(% DAV)
(% 50 day avg vol) |
52 Wk Hi
% From Hi |
Featured
Date |
Price
Featured |
Pivot Featured |
|
Max Buy |
N
-
NYSE
Netsuite Inc
DIVERSIFIED SERVICES - Business/Management Services
|
$75.00
|
+0.32
0.43% |
$75.06
|
279,301
81.79% of 50 DAV
50 DAV is 341,500
|
$75.75
-0.99%
|
12/12/2012
|
$64.75
|
PP = $67.12
|
|
MB = $70.48
|
Most Recent Note - 3/8/2013 1:10:41 PM
G - Perched at its 52-week and all-time high, holding its ground following a streak of 7 consecutive volume-driven gains. Its 50 DMA line acted as support during the recent consolidation.
>>> The latest Featured Stock Update with an annotated graph appeared on 3/1/2013. Click here.
View all notes |
Alert me of new notes |
CANSLIM.net Company Profile |
SEC |
Zacks Reports |
StockTalk |
News |
Chart |
Request a new note
C
A N
S L
I M
|
NSR
-
NYSE
Neustar Inc
TELECOMMUNICATIONS - Diversified Communication Serv
|
$45.14
|
+0.31
0.69% |
$45.22
|
260,208
58.28% of 50 DAV
50 DAV is 446,500
|
$47.24
-4.45%
|
3/8/2013
|
$44.99
|
PP = $47.34
|
|
MB = $49.71
|
Most Recent Note - 3/8/2013 1:08:01 PM
Y - Consolidating above its 50 DMA line today after small gains this week backed by below average volume. Color code is changed to yellow with new pivot point cited based on its 2/27/13 high plus 10 cents while forming a "square box" base. Volume-driven gains above the pivot point may trigger a new (or add-on) technical buy signal. The 2/21/13 low ($42.40) defines important near-term support where any subsequent deterioration would raise greater concerns and trigger a worrisome technical sell signal.
>>> The latest Featured Stock Update with an annotated graph appeared on 2/27/2013. Click here.
View all notes |
Alert me of new notes |
CANSLIM.net Company Profile |
SEC |
Zacks Reports |
StockTalk |
News |
Chart |
Request a new note
C
A N
S L
I M
|
QIHU
-
NYSE
Qihoo 360 Technology Ads
INTERNET - Internet Service Providers
|
$32.06
|
+0.09
0.28% |
$32.49
|
1,983,350
78.74% of 50 DAV
50 DAV is 2,518,900
|
$34.90
-8.14%
|
3/5/2013
|
$34.63
|
PP = $34.47
|
|
MB = $36.19
|
Most Recent Note - 3/6/2013 11:16:26 AM
G - Gapped down today after reporting earnings +10% on +65% sales revenues for the Dec '12 quarter, below the +25% minimum earnings guideline (C criteria) raising fundamental concerns. Color code is changed to green based the sub par results and the abrupt reversal from its new 52-week high hit on the prior session. Prior mid-day reports cautioned - "Deceleration in its sales revenues and earnings growth rate in sequential quarterly comparisons through Sep '12 is cause for concern. Faces additional overhead supply up through the $36 area. Found support at its 200 DMA line in recent weeks This Chinese Computer Software - Security firm's quarterly earnings (C criteria) and sales revenues increases have been strong." See the latest FSU analysis for more details and a new annotated graph under the headline, "Earnings Below Guideline Raised Concerns After Technical Breakout".
>>> The latest Featured Stock Update with an annotated graph appeared on 3/5/2013. Click here.
View all notes |
Alert me of new notes |
CANSLIM.net Company Profile |
SEC |
Zacks Reports |
StockTalk |
News |
Chart |
Request a new note
C
A N
S L
I M
|
SFUN
-
NYSE
Soufun Hldgs Ltd Ads A
INTERNET - Internet Information Providers
|
$24.76
|
-1.01
-3.92% |
$25.99
|
347,557
100.22% of 50 DAV
50 DAV is 346,800
|
$29.16
-15.09%
|
2/11/2013
|
$27.46
|
PP = $29.26
|
|
MB = $30.72
|
Most Recent Note - 3/8/2013 1:18:50 PM
Still sputtering below its 50 DMA line which may now act as resistance. It did not trigger any recent technical buy signal. The recent low ($23.24 on 3/05/13) defines important near-term support where any further deterioration would raise greater concerns and trigger additional sell signals. Based on weak action it will be dropped from the Featured Stocks list tonight. Only a prompt rebound above its 50 DMA line would help its technical stance.
>>> The latest Featured Stock Update with an annotated graph appeared on 2/11/2013. Click here.
View all notes |
Alert me of new notes |
CANSLIM.net Company Profile |
SEC |
Zacks Reports |
StockTalk |
News |
Chart |
Request a new note
C
A N
S L
I M
|
SLCA
-
NYSE
U S Silica Holdings Inc
CHEMICALS - Specialty Chemicals
|
$26.43
|
+0.78
3.04% |
$27.86
|
1,192,860
235.19% of 50 DAV
50 DAV is 507,200
|
$26.99
-2.07%
|
2/26/2013
|
$22.23
|
PP = $21.50
|
|
MB = $22.58
|
Most Recent Note - 3/8/2013 1:21:55 PM
G - Adding to its spurt of volume-driven gains and hitting a yet another new 52-week high with today's considerable gain. Very extended from its prior base, but having rallied more than +20% in the first 2-3 weeks after its breakout, the investment system rules suggest holding such winners for a minimum of 8 weeks.
>>> The latest Featured Stock Update with an annotated graph appeared on 2/26/2013. Click here.
View all notes |
Alert me of new notes |
CANSLIM.net Company Profile |
SEC |
Zacks Reports |
StockTalk |
News |
Chart |
Request a new note
C
A N
S L
I M
|
Symbol/Exchange
Company Name
Industry Group |
PRICE |
CHANGE
(%Change) |
Day High |
Volume
(% DAV)
(% 50 day avg vol) |
52 Wk Hi
% From Hi |
Featured
Date |
Price
Featured |
Pivot Featured |
|
Max Buy |
VRX
-
NYSE
Valeant Pharmaceuticals
DRUGS - Drug Manufacturers - Other
|
$70.78
|
+0.94
1.35% |
$70.85
|
1,181,583
90.94% of 50 DAV
50 DAV is 1,299,300
|
$70.25
0.75%
|
12/20/2012
|
$60.24
|
PP = $61.21
|
|
MB = $64.27
|
Most Recent Note - 3/5/2013 1:50:31 PM
Y - Hitting another new 52-week high with today's 5th consecutive gain. A valid secondary buy point exists following the successful test of support at its 10-week moving average up to as high as +5% above the recent high ($67.98 plus 5% or $71.38). Color code is changed to yellow however no new pivot point is cited since a new base was not formed. The 50 DMA line and recent low ($64.05 on 2/21/13) define the next important support area to watch.
>>> The latest Featured Stock Update with an annotated graph appeared on 2/15/2013. Click here.
View all notes |
Alert me of new notes |
CANSLIM.net Company Profile |
SEC |
Zacks Reports |
StockTalk |
News |
Chart |
Request a new note
C
A N
S L
I M
|
|
|
|
THESE ARE NOT BUY RECOMMENDATIONS!
Comments contained in the body of this report are technical
opinions only. The material herein has been obtained
from sources believed to be reliable and accurate, however,
its accuracy and completeness cannot be guaranteed.
This site is not an investment advisor, hence it does
not endorse or recommend any securities or other investments.
Any recommendation contained in this report may not
be suitable for all investors and it is not to be deemed
an offer or solicitation on our part with respect to
the purchase or sale of any securities. All trademarks,
service marks and trade names appearing in this report
are the property of their respective owners, and are
likewise used for identification purposes only.
This report is a service available
only to active Paid Premium Members.
You may opt-out of receiving report notifications
at any time. Questions or comments may be submitted
by writing to Premium Membership Services 665 S.E. 10 Street, Suite 201 Deerfield Beach, FL 33441-5634 or by calling 1-800-965-8307
or 954-785-1121.
|
|
|

