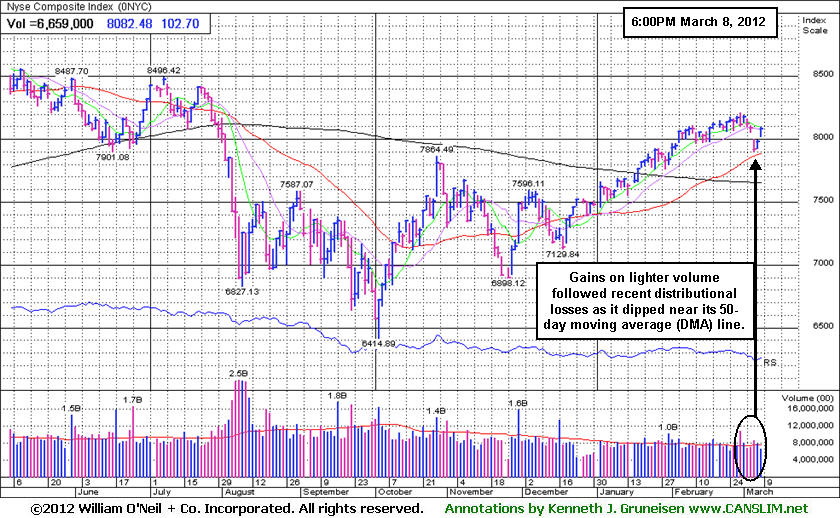
Symbol/Exchange
Company Name
Industry Group |
PRICE |
CHANGE
(%Change) |
Day High |
Volume
(% DAV)
(% 50 day avg vol) |
52 Wk Hi
% From Hi |
Featured
Date |
Price
Featured |
Pivot Featured |
| Max Buy |
ADS - NYSE
Alliance Data Sys Corp
COMPUTER SOFTWARE and SERVICES - Information and Delivery Service |
$122.29 |
+1.14
0.94% |
$123.46 |
470,916
65.92% of 50 DAV
50 DAV is 714,400 |
$122.62
-0.27%
|
1/17/2012 |
$108.24 |
PP = $107.43 |
| MB = $112.80 |
Most Recent Note - 3/7/2012 6:48:06 PM
G - Posted a small gain today with twice its average volume total. Fundamental concerns were raised by earnings reported +9%, well below the +25% minimum guideline in the latest quarter ended December 31, 2011.
>>> The latest Featured Stock Update with an annotated graph appeared on 2/29/2012. Click here.
View all notes | Alert me of new notes | CANSLIM.net Company Profile | SEC | Zacks Reports | StockTalk | News | Chart |
Request a new note C A N S L I M    |
ALXN - NASDAQ
Alexion Pharmaceuticals
DRUGS - Drug Manufacturers - Other |
$84.91 |
+1.06
1.26% |
$85.46 |
954,181
78.20% of 50 DAV
50 DAV is 1,220,200 |
$87.63
-3.10%
|
11/30/2011 |
$68.66 |
PP = $70.52 |
| MB = $74.05 |
Most Recent Note - 3/7/2012 6:50:20 PM
G - Still holding its ground stubbornly in a tight range near its all-time high with volume totals cooling. Support to watch is its 50 DMA line (now $78).
>>> The latest Featured Stock Update with an annotated graph appeared on 2/24/2012. Click here.
View all notes | Alert me of new notes | CANSLIM.net Company Profile | SEC | Zacks Reports | StockTalk | News | Chart |
Request a new note C A N S L I M |
BODY - NASDAQ
Body Central Corp
RETAIL - Catalog andamp; Mail Order Houses |
$28.70 |
-0.04
-0.14% |
$29.25 |
111,978
60.40% of 50 DAV
50 DAV is 185,400 |
$29.49
-2.68%
|
1/27/2012 |
$26.69 |
PP = $25.46 |
| MB = $26.73 |
Most Recent Note - 3/7/2012 6:52:07 PM
G - Below average volume was behind today's 3rd consecutive gain. It is extended from its prior base. An upward trendline connecting its Nov-Feb lows defines initial chart support to watch above its 50 DMA line and prior highs in the $26 area.
>>> The latest Featured Stock Update with an annotated graph appeared on 1/27/2012. Click here.
View all notes | Alert me of new notes | CANSLIM.net Company Profile | SEC | Zacks Reports | StockTalk | News | Chart |
Request a new note C A N S L I M |
CATM - NASDAQ
Cardtronics Inc
DIVERSIFIED SERVICES - Business/Management Services |
$27.41 |
-0.09
-0.33% |
$27.63 |
176,727
42.86% of 50 DAV
50 DAV is 412,300 |
$28.74
-4.63%
|
2/24/2012 |
$27.94 |
PP = $28.30 |
| MB = $29.72 |
Most Recent Note - 3/2/2012 4:09:36 PM
Y - Pulled back today while perched near its pivot point cited, not yet triggering a technical buy signal by clearing its "double bottom" base formed over the past 10 weeks during which it found prompt support at its 200 DMA line. Disciplined investors resist the urge to get in early while confirming gains are still needed.
>>> The latest Featured Stock Update with an annotated graph appeared on 1/30/2012. Click here.
View all notes | Alert me of new notes | CANSLIM.net Company Profile | SEC | Zacks Reports | StockTalk | News | Chart |
Request a new note C A N S L I M |
CDNS - NASDAQ
Cadence Design Systems
COMPUTER SOFTWARE and SERVICES - Technical and System Software |
$11.96 |
+0.46
4.00% |
$12.00 |
7,244,213
233.47% of 50 DAV
50 DAV is 3,102,900 |
$12.11
-1.24%
|
2/3/2012 |
$11.66 |
PP = $11.15 |
| MB = $11.71 |
 Most Recent Note - 3/8/2012 12:06:52 PM Most Recent Note - 3/8/2012 12:06:52 PM
Y - Gapped up today and rallied back above its "max buy" level. Color code remains yellow because a secondary buy point the experts teach in the Certification allows buying from the first test of support at the 10-week moving average up to +5% above the latest high ($12.11 plus another +5% in this example) following an earlier technical breakout.
>>> The latest Featured Stock Update with an annotated graph appeared on 2/3/2012. Click here.
View all notes | Alert me of new notes | CANSLIM.net Company Profile | SEC | Zacks Reports | StockTalk | News | Chart |
Request a new note C A N S L I M |
Symbol/Exchange
Company Name
Industry Group |
PRICE |
CHANGE
(%Change) |
Day High |
Volume
(% DAV)
(% 50 day avg vol) |
52 Wk Hi
% From Hi |
Featured
Date |
Price
Featured |
Pivot Featured |
| Max Buy |
CELG - NASDAQ
Celgene Corp
DRUGS - Drug Manufacturers - Major |
$74.24 |
+1.68
2.32% |
$74.52 |
2,408,101
78.28% of 50 DAV
50 DAV is 3,076,200 |
$76.09
-2.43%
|
2/2/2012 |
$74.16 |
PP = $75.21 |
| MB = $78.97 |
Most Recent Note - 3/8/2012 2:15:56 PM
Y - Rising with light volume after a pullback tested its 50 DMA line and prior lows in the $71 area previously noted as important chart support to watch. Within striking distance of its all-time high ($77.39 in Aug '08). Any subsequent volume-driven gains would be a reassuring sign of fresh institutional demand
>>> The latest Featured Stock Update with an annotated graph appeared on 2/2/2012. Click here.
View all notes | Alert me of new notes | CANSLIM.net Company Profile | SEC | Zacks Reports | StockTalk | News | Chart |
Request a new note C A N S L I M |
DISH - NASDAQ
Dish Network Corp Cl A
CONSUMER DURABLES - Electronic Equipment |
$31.35 |
+0.13
0.42% |
$31.54 |
3,662,887
135.84% of 50 DAV
50 DAV is 2,696,500 |
$32.57
-3.73%
|
3/7/2012 |
$30.83 |
PP = $30.10 |
| MB = $31.61 |
Most Recent Note - 3/7/2012 6:55:51 PM
Y - Finished strong today with a solid gain backed by 2 times average volume clinching a technical buy signal. Quarterly earnings increases in recent comparisons have been above the +25% guideline satisfying the C criteria. Hit a new 52-week high, rising from an orderly consolidation above its 50 DMA line. Color code was changed to yellow with pivot point cited based on its 1/19/12 high plus 10 cents when featured in the mid-day report earlier today and noted - "No resistance remains due to overhead supply. Prior earnings history included a downturn in FY '09, a flaw with respect to the A criteria. Increasing ownership by top-rated funds is reassuring concerning the I criteria."

There are no Featured Stock Updates™ available for this stock at this time. You may request one by clicking the Request a New Note link below
View all notes | Alert me of new notes | CANSLIM.net Company Profile | SEC | Zacks Reports | StockTalk | News | Chart |
Request a new note C A N S L I M |
ECHO - NASDAQ
Echo Global Logistics
DIVERSIFIED SERVICES - Business/Management Services |
$18.01 |
+0.11
0.61% |
$18.11 |
77,203
99.23% of 50 DAV
50 DAV is 77,800 |
$19.38
-7.07%
|
2/22/2012 |
$18.50 |
PP = $18.63 |
| MB = $19.56 |
Most Recent Note - 3/6/2012 12:11:24 PM
Y - Slumping near its 50 DMA line today following 2 damaging volume-driven gaps down in the past week. Gaps down are considered signs of distributional pressure. It has slumped below its pivot point, raising concerns.
>>> The latest Featured Stock Update with an annotated graph appeared on 2/23/2012. Click here.
View all notes | Alert me of new notes | CANSLIM.net Company Profile | SEC | Zacks Reports | StockTalk | News | Chart |
Request a new note C A N S L I M |
FEIC - NASDAQ
F E I Co
ELECTRONICS - Diversified Electronics |
$44.40 |
+2.15
5.09% |
$44.54 |
372,756
119.51% of 50 DAV
50 DAV is 311,900 |
$48.31
-8.09%
|
12/7/2011 |
$41.41 |
PP = $42.35 |
| MB = $44.47 |
Most Recent Note - 3/8/2012 2:03:18 PM
G - Considerable gain today, rebounding back above its 50 DMA line and helping its technical stance improve. However, it recently reported +21% earnings for Dec '11 quarter, below the +25% minimum guideline for earnings growth.
>>> The latest Featured Stock Update with an annotated graph appeared on 1/25/2012. Click here.
View all notes | Alert me of new notes | CANSLIM.net Company Profile | SEC | Zacks Reports | StockTalk | News | Chart |
Request a new note C A N S L I M |
GNC - NYSE
G N C Holdings Inc
RETAIL - Drug Stores |
$31.80 |
+0.51
1.63% |
$31.91 |
694,429
71.46% of 50 DAV
50 DAV is 971,800 |
$33.70
-5.64%
|
1/19/2012 |
$28.99 |
PP = $29.60 |
| MB = $31.08 |
Most Recent Note - 3/6/2012 1:29:43 PM
G - Pulling back today, consolidating well above prior highs in the $29.50 area and its 50 DMA line defining near-term support to watch.
>>> The latest Featured Stock Update with an annotated graph appeared on 3/5/2012. Click here.
View all notes | Alert me of new notes | CANSLIM.net Company Profile | SEC | Zacks Reports | StockTalk | News | Chart |
Request a new note C A N S L I M |
Symbol/Exchange
Company Name
Industry Group |
PRICE |
CHANGE
(%Change) |
Day High |
Volume
(% DAV)
(% 50 day avg vol) |
52 Wk Hi
% From Hi |
Featured
Date |
Price
Featured |
Pivot Featured |
| Max Buy |
GOLD - NASDAQ
Randgold Resources Adr
METALS and MINING - Gold |
$111.66 |
+2.36
2.16% |
$112.62 |
517,224
116.13% of 50 DAV
50 DAV is 445,400 |
$120.73
-7.51%
|
2/7/2012 |
$116.21 |
PP = $120.83 |
| MB = $126.87 |
Most Recent Note - 3/6/2012 1:33:30 PM
G - Color code is changed to green after a small gap down today violated its 50 DMA line, and it also sank below its prior low ($108.63 on 2/16/12), raising concerns and triggering technical sell signals.
>>> The latest Featured Stock Update with an annotated graph appeared on 2/8/2012. Click here.
View all notes | Alert me of new notes | CANSLIM.net Company Profile | SEC | Zacks Reports | StockTalk | News | Chart |
Request a new note C A N S L I M |
HLF - NYSE
Herbalife Ltd
DRUGS - Nutrition and Weight Management |
$66.88 |
+0.96
1.46% |
$67.34 |
1,035,972
81.68% of 50 DAV
50 DAV is 1,268,300 |
$68.01
-1.66%
|
2/22/2012 |
$65.90 |
PP = $63.50 |
| MB = $66.68 |
Most Recent Note - 3/8/2012 2:10:40 PM
G - Still stubbornly holding its ground in a very tight range since its 2/22/12 gain triggered a technical buy signal. Color code was changed to green after rising above its "max buy" level, getting extended from its prior base pattern. Prior highs in the $63 area define support to watch on pullbacks.
>>> The latest Featured Stock Update with an annotated graph appeared on 2/22/2012. Click here.
View all notes | Alert me of new notes | CANSLIM.net Company Profile | SEC | Zacks Reports | StockTalk | News | Chart |
Request a new note C A N S L I M |
ISRG - NASDAQ
Intuitive Surgical Inc
HEALTH SERVICES - Medical Appliances and Equipment |
$516.86 |
+8.61
1.69% |
$519.70 |
196,484
54.28% of 50 DAV
50 DAV is 362,000 |
$523.10
-1.19%
|
12/20/2011 |
$442.43 |
PP = $449.16 |
| MB = $471.62 |
Most Recent Note - 3/8/2012 2:12:59 PM
G - Recently wedged to new all-time highs without great volume conviction and it is consolidating in a very tight trading range near its high for the past few weeks. December '11 quarterly earnings increased by just below the borderline +25% minimum guideline for ideal buy candidates.
>>> The latest Featured Stock Update with an annotated graph appeared on 3/1/2012. Click here.
View all notes | Alert me of new notes | CANSLIM.net Company Profile | SEC | Zacks Reports | StockTalk | News | Chart |
Request a new note C A N S L I M |
LULU - NASDAQ
Lululemon Athletica
MANUFACTURING - Textile Manufacturing |
$70.94 |
+2.27
3.31% |
$72.00 |
2,369,112
100.16% of 50 DAV
50 DAV is 2,365,400 |
$71.41
-0.66%
|
1/10/2012 |
$60.97 |
PP = $59.46 |
| MB = $62.43 |
Most Recent Note - 3/8/2012 2:05:05 PM
G - Gapped up today and touched a new all-time high. It is extended from any sound base. Prior highs in the $61-64 area and its 50 DMA line define chart support to watch on pullbacks.
>>> The latest Featured Stock Update with an annotated graph appeared on 2/21/2012. Click here.
View all notes | Alert me of new notes | CANSLIM.net Company Profile | SEC | Zacks Reports | StockTalk | News | Chart |
Request a new note C A N S L I M |
MA - NYSE
Mastercard Inc Cl A
DIVERSIFIED SERVICES - Business/Management Services |
$417.26 |
+5.52
1.34% |
$418.93 |
708,748
64.64% of 50 DAV
50 DAV is 1,096,400 |
$428.57
-2.64%
|
2/2/2012 |
$379.05 |
PP = $381.32 |
| MB = $400.39 |
Most Recent Note - 3/6/2012 10:54:18 AM
G - Small gap down today, retreating from its all-time high hit last week. Prior highs in the $381-384 area define support to watch on pullbacks.
>>> The latest Featured Stock Update with an annotated graph appeared on 2/17/2012. Click here.
View all notes | Alert me of new notes | CANSLIM.net Company Profile | SEC | Zacks Reports | StockTalk | News | Chart |
Request a new note C A N S L I M |
Symbol/Exchange
Company Name
Industry Group |
PRICE |
CHANGE
(%Change) |
Day High |
Volume
(% DAV)
(% 50 day avg vol) |
52 Wk Hi
% From Hi |
Featured
Date |
Price
Featured |
Pivot Featured |
| Max Buy |
MELI - NASDAQ
Mercadolibre Inc
INTERNET - Internet Software and; Services |
$95.23 |
+0.58
0.61% |
$96.32 |
426,818
80.58% of 50 DAV
50 DAV is 529,700 |
$104.50
-8.87%
|
2/6/2012 |
$97.09 |
PP = $95.58 |
| MB = $100.36 |
Most Recent Note - 3/6/2012 10:58:27 AM
Y - Gapped down today, slumping under its pivot point and under prior highs in the $95 area, also violating an upward trendline connecting its October-February lows, raising concerns. Its 50 DMA line defines the next important support level to watch.
>>> The latest Featured Stock Update with an annotated graph appeared on 2/6/2012. Click here.
View all notes | Alert me of new notes | CANSLIM.net Company Profile | SEC | Zacks Reports | StockTalk | News | Chart |
Request a new note C A N S L I M |
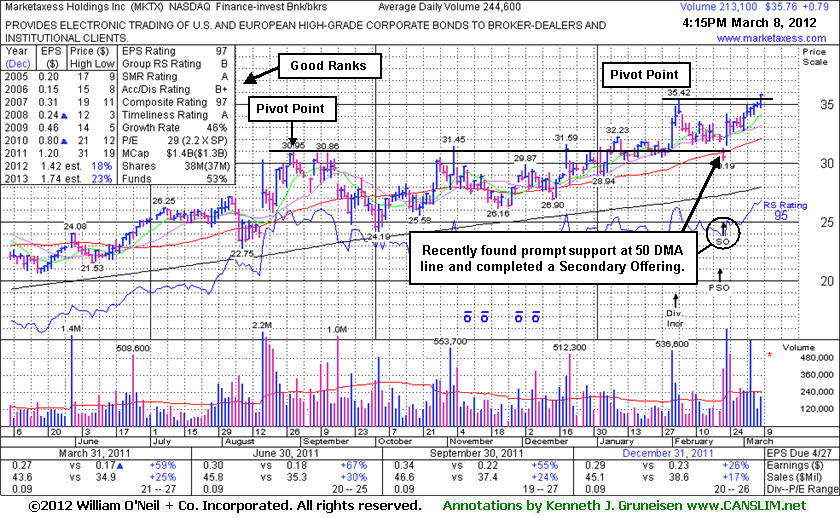
MKTX - NASDAQ
Marketaxess Holdings Inc
FINANCIAL SERVICES - Investment Brokerage - Nationa |
$35.72 |
+0.75
2.14% |
$35.84 |
250,639
102.47% of 50 DAV
50 DAV is 244,600 |
$35.42
0.85%
|
3/8/2012 |
$35.80 |
PP = $35.52 |
| MB = $37.30 |
Most Recent Note - 3/8/2012 4:58:55 PM
Y - Rose to a new all-time high with today's gain backed by below average volume. Color code is changed to yellow with new pivot point cited based on its 2/03/12 high plus 10 cents. A gain above the pivot point backed at least +40% above average volume, ideally more, is needed to trigger a proper technical buy signal. See the latest FSU analysis for more details and a new annotated graph.
>>> The latest Featured Stock Update with an annotated graph appeared on 3/8/2012. Click here.
View all notes | Alert me of new notes | CANSLIM.net Company Profile | SEC | Zacks Reports | StockTalk | News | Chart |
Request a new note C A N S L I M |
RAX - NYSE
Rackspace Hosting Inc
INTERNET - Internet Software and; Services |
$53.83 |
+2.30
4.46% |
$54.13 |
1,900,834
96.36% of 50 DAV
50 DAV is 1,972,600 |
$56.94
-5.46%
|
2/2/2012 |
$46.69 |
PP = $45.55 |
| MB = $47.83 |
Most Recent Note - 3/8/2012 2:09:03 PM
G - Rebounding without great volume behind gains following damaging losses earlier this week. Stayed well above its 50 DMA line and prior highs in the $46 area that define important near-term support to watch.
>>> The latest Featured Stock Update with an annotated graph appeared on 2/16/2012. Click here.
View all notes | Alert me of new notes | CANSLIM.net Company Profile | SEC | Zacks Reports | StockTalk | News | Chart |
Request a new note C A N S L I M |
RRTS - NYSE
Roadrunner Trans Systems
TRANSPORTATION - Air Delivery and Freight Service |
$17.77 |
+0.34
1.95% |
$17.78 |
57,812
42.60% of 50 DAV
50 DAV is 135,700 |
$18.44
-3.63%
|
2/10/2012 |
$17.40 |
PP = $17.50 |
| MB = $18.38 |
Most Recent Note - 3/2/2012 4:33:06 PM
Y - Slumped to a close near its 2-week low and near its pivot point today with a loss on light volume. Prior highs in the $17 area define initial support to watch on pullbacks.
>>> The latest Featured Stock Update with an annotated graph appeared on 2/13/2012. Click here.
View all notes | Alert me of new notes | CANSLIM.net Company Profile | SEC | Zacks Reports | StockTalk | News | Chart |
Request a new note C A N S L I M |
SHFL - NASDAQ
Shuffle Master Inc
MANUFACTURING - Diversified Machinery |
$16.70 |
+0.17
1.03% |
$16.88 |
366,829
69.07% of 50 DAV
50 DAV is 531,100 |
$17.49
-4.52%
|
3/6/2012 |
$17.07 |
PP = $15.25 |
| MB = $16.01 |
Most Recent Note - 3/7/2012 12:50:08 PM
G - Up today after a finish in the lower half of its intra-day range on the prior session, and its color code is changed to green while quickly getting too extended. The 3 latest quarterly comparisons showed strong earnings increases (C criteria) and its annual earnings growth (A criteria) has been strong after FY '09. It was featured in the 3/06/12 mid-day report with heavy volume behind its gain as it technically broke out from the previously noted advanced "3-weeks tight" base pattern with pivot point based on its 2/17/12 high plus 10 cents. No resistance remains due to overhead supply.

There are no Featured Stock Updates™ available for this stock at this time. You may request one by clicking the Request a New Note link below
View all notes | Alert me of new notes | CANSLIM.net Company Profile | SEC | Zacks Reports | StockTalk | News | Chart |
Request a new note C A N S L I M |
Symbol/Exchange
Company Name
Industry Group |
PRICE |
CHANGE
(%Change) |
Day High |
Volume
(% DAV)
(% 50 day avg vol) |
52 Wk Hi
% From Hi |
Featured
Date |
Price
Featured |
Pivot Featured |
| Max Buy |
SWI - NYSE
Solarwinds Inc
COMPUTER SOFTWARE and SERVICES - Application Software |
$37.19 |
+0.61
1.67% |
$37.55 |
1,182,644
104.50% of 50 DAV
50 DAV is 1,131,700 |
$39.75
-6.44%
|
1/26/2012 |
$32.36 |
PP = $33.78 |
| MB = $35.47 |
Most Recent Note - 3/6/2012 11:07:14 AM
G - Small gap down today slumping back toward its "max buy" level after recently wedging higher without great volume conviction. Earnings below the +25% guideline for the Dec '11 quarter raised fundamental concerns.
>>> The latest Featured Stock Update with an annotated graph appeared on 1/26/2012. Click here.
View all notes | Alert me of new notes | CANSLIM.net Company Profile | SEC | Zacks Reports | StockTalk | News | Chart |
Request a new note C A N S L I M |
SXCI - NASDAQ
S X C Health Solutions
COMPUTER SOFTWARE and SERVICES - Healthcare Information Service |
$72.54 |
-0.70
-0.96% |
$74.37 |
375,601
98.12% of 50 DAV
50 DAV is 382,800 |
$73.34
-1.09%
|
2/23/2012 |
$68.24 |
PP = $66.05 |
| MB = $69.35 |
Most Recent Note - 3/7/2012 7:00:01 PM
G - Finished near the session high with a gain on lighter volume for another new all-time high. Prior highs in the $66 area define support to watch on pullbacks.
>>> The latest Featured Stock Update with an annotated graph appeared on 3/6/2012. Click here.
View all notes | Alert me of new notes | CANSLIM.net Company Profile | SEC | Zacks Reports | StockTalk | News | Chart |
Request a new note C A N S L I M |
TDG - NYSE
Transdigm Group Inc
AEROSPACE/DEFENSE - Aerospace/Defense Products and; Services |
$113.94 |
+1.36
1.21% |
$114.87 |
381,296
99.35% of 50 DAV
50 DAV is 383,800 |
$121.48
-6.21%
|
2/29/2012 |
$120.10 |
PP = $118.93 |
| MB = $124.88 |
Most Recent Note - 3/6/2012 11:12:18 AM
Y - Gapped down today, encountering more distributional pressure. Its 50 DMA line defines important chart support to watch above prior highs in the $102 area.
>>> The latest Featured Stock Update with an annotated graph appeared on 2/10/2012. Click here.
View all notes | Alert me of new notes | CANSLIM.net Company Profile | SEC | Zacks Reports | StockTalk | News | Chart |
Request a new note C A N S L I M |
TNGO - NASDAQ
Tangoe Inc
COMPUTER SOFTWARE and SERVICES - Technical and System Software |
$18.74 |
+0.61
3.36% |
$18.84 |
211,470
65.88% of 50 DAV
50 DAV is 321,000 |
$19.90
-5.83%
|
2/13/2012 |
$15.39 |
PP = $16.51 |
| MB = $17.34 |
Most Recent Note - 3/6/2012 11:41:19 AM
G - Small gap down today. Still consolidating above its "max buy" level and still too extended from prior highs in the $16 area to be considered buyable under the fact-based investment system's guidelines.
>>> The latest Featured Stock Update with an annotated graph appeared on 2/14/2012. Click here.
View all notes | Alert me of new notes | CANSLIM.net Company Profile | SEC | Zacks Reports | StockTalk | News | Chart |
Request a new note C A N S L I M |
TSCO - NASDAQ
Tractor Supply Co
SPECIALTY RETAIL - Specialty Retail, Other |
$87.47 |
-0.03
-0.03% |
$88.00 |
422,343
58.24% of 50 DAV
50 DAV is 725,200 |
$88.65
-1.33%
|
1/12/2012 |
$79.12 |
PP = $75.58 |
| MB = $79.36 |
Most Recent Note - 3/7/2012 7:03:59 PM
G - Up today on near average volume while matching its best-ever close. It is extended from a sound base after tallying 5 weekly gains in the span of 6 weeks. Its 50 DMA line defines support to watch on pullbacks.
>>> The latest Featured Stock Update with an annotated graph appeared on 2/27/2012. Click here.
View all notes | Alert me of new notes | CANSLIM.net Company Profile | SEC | Zacks Reports | StockTalk | News | Chart |
Request a new note C A N S L I M |
Symbol/Exchange
Company Name
Industry Group |
PRICE |
CHANGE
(%Change) |
Day High |
Volume
(% DAV)
(% 50 day avg vol) |
52 Wk Hi
% From Hi |
Featured
Date |
Price
Featured |
Pivot Featured |
| Max Buy |
UA - NYSE
Under Armour Inc Cl A
CONSUMER NON-DURABLES - Textile - Apparel Clothing |
$92.85 |
+1.83
2.01% |
$93.36 |
876,909
69.64% of 50 DAV
50 DAV is 1,259,200 |
$93.12
-0.29%
|
2/15/2012 |
$85.77 |
PP = $84.86 |
| MB = $89.10 |
Most Recent Note - 3/7/2012 7:01:47 PM
G - Color code is changed to green again after rising back above its "max buy" level with a gain on lighter than average volume today. Recent gains above its pivot point did not have volume sufficient to trigger a proper technical buy signal. Pyramiding into a stock can help investors avoid chasing them too far above their pivot point.
>>> The latest Featured Stock Update with an annotated graph appeared on 2/15/2012. Click here.
View all notes | Alert me of new notes | CANSLIM.net Company Profile | SEC | Zacks Reports | StockTalk | News | Chart |
Request a new note C A N S L I M |
UBNT - NASDAQ
Ubiquiti Networks Inc
TELECOMMUNICATIONS - Diversified Communication Serv |
$25.11 |
+0.48
1.95% |
$25.69 |
154,598
50.57% of 50 DAV
50 DAV is 305,700 |
$28.97
-13.32%
|
1/27/2012 |
$22.25 |
PP = $23.14 |
| MB = $24.30 |
Most Recent Note - 3/7/2012 6:02:21 PM
Y - Up today with lighter (yet still above average) volume, closing back above its "max buy" level. No new pivot point is cited and it remains color coded yellow, as they teach in the Certification that a stock may be bought from its 10-week moving average (WMA) up to +5% above the latest high ($28.97 on 2/28/12 plus another 5%) following an earlier technical breakout.
>>> The latest Featured Stock Update with an annotated graph appeared on 2/1/2012. Click here.
View all notes | Alert me of new notes | CANSLIM.net Company Profile | SEC | Zacks Reports | StockTalk | News | Chart |
Request a new note C A N S L I M |
ULTA - NASDAQ
Ulta Salon Cosm & Frag
SPECIALTY RETAIL - Specialty Retail, Other |
$89.27 |
+1.35
1.54% |
$90.36 |
1,555,273
211.60% of 50 DAV
50 DAV is 735,000 |
$88.68
0.67%
|
1/11/2012 |
$71.97 |
PP = $75.80 |
| MB = $79.59 |
Most Recent Note - 3/8/2012 1:01:15 PM
G - Up with above average volume yet again today for another new all-time high. It is extended from any sound base pattern, meanwhile its prior highs near $75 and its 50 DMA line define important chart support.
>>> The latest Featured Stock Update with an annotated graph appeared on 2/28/2012. Click here.
View all notes | Alert me of new notes | CANSLIM.net Company Profile | SEC | Zacks Reports | StockTalk | News | Chart |
Request a new note C A N S L I M |
V - NYSE
Visa Inc Cl A
DIVERSIFIED SERVICES - Business/Management Services |
$117.97 |
+2.33
2.01% |
$118.18 |
2,380,077
62.11% of 50 DAV
50 DAV is 3,831,900 |
$119.36
-1.16%
|
2/2/2012 |
$105.43 |
PP = $104.30 |
| MB = $109.52 |
Most Recent Note - 3/7/2012 6:45:03 PM
G - Recently wedged to new high territory with below average volume conviction behind its gains. Prior highs in the $103-104 area define support to watch. See the latest FSU analysis for more details and a new annotated weekly graph.
>>> The latest Featured Stock Update with an annotated graph appeared on 3/7/2012. Click here.
View all notes | Alert me of new notes | CANSLIM.net Company Profile | SEC | Zacks Reports | StockTalk | News | Chart |
Request a new note C A N S L I M |