You are not logged in.
This means you
CAN ONLY VIEW reports that were published prior to Monday, April 14, 2025.
You
MUST UPGRADE YOUR MEMBERSHIP if you want to see any current reports.
AFTER MARKET UPDATE - MONDAY, MARCH 8TH, 2010
Previous After Market Report Next After Market Report >>>
|
|
|
|
DOW |
-13.68 |
10,552.52 |
-0.13% |
|
Volume |
905,233,450 |
-14% |
|
Volume |
2,211,316,910 |
-6% |
|
NASDAQ |
+5.86 |
2,332.21 |
+0.25% |
|
Advancers |
1,789 |
57% |
|
Advancers |
1,464 |
52% |
|
S&P 500 |
-0.20 |
1,138.50 |
-0.02% |
|
Decliners |
1,251 |
40% |
|
Decliners |
1,254 |
44% |
|
Russell 2000 |
+1.09 |
667.11 |
+0.16% |
|
52 Wk Highs |
470 |
|
|
52 Wk Highs |
241 |
|
|
S&P 600 |
+0.98 |
353.86 |
+0.28% |
|
52 Wk Lows |
5 |
|
|
52 Wk Lows |
5 |
|
|
 |
Major Averages End Quiet Session Mixed And Little Changed
Adam Sarhan, Contributing Writer,
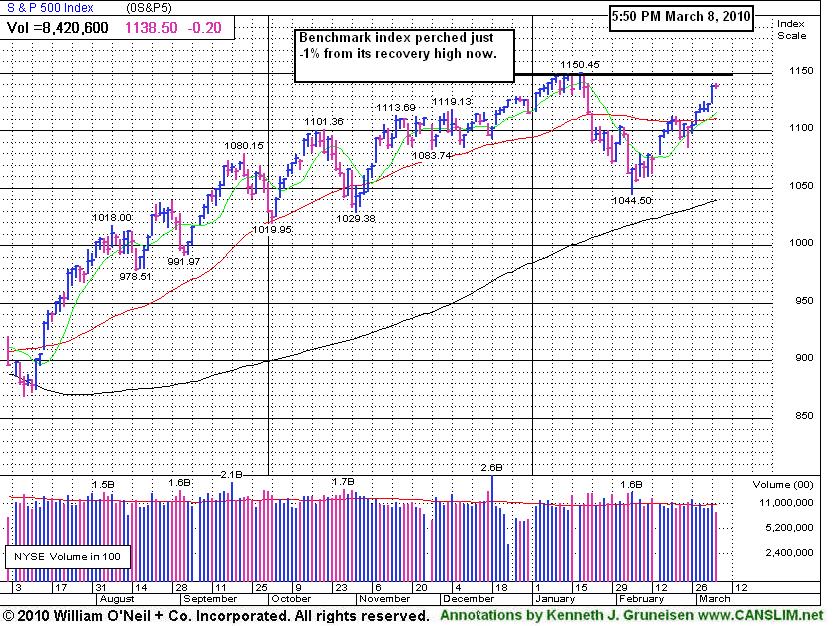
The major averages ended Monday's session mixed after trading between positive and negative territory as investors digested last week's impressive move high. Volume, a critical gauge of institutional demand, was reported lower than the prior session on the Nasdaq exchange and on the NYSE, offering a reassuring sign that institutional investors were not aggressively dumping stocks. Advancers led decliners by a 3-to-2 ratio on the NYSE and by a narrower 7-to-6 ratio on the Nasdaq exchange. There were 76 high-ranked companies from the CANSLIM.net Leaders List that made a new 52-week high and appeared on the CANSLIM.net BreakOuts Page, down from the 59 issues that appeared on the prior session. New 52-week highs again overwhelmingly trumped new lows on both exchanges while new lows were in the single digits.
A slew of drug companies tumbled after President Barack Obama gave what appeared to be a final push to overhaul our troubled health-care system. Pfizer (PFE -0.74%), the world’s largest drug manufacturer, UnitedHealth (UNH -1.90%), the largest US health insurer by revenue, and a host of other companies fell after Obama began a series of road trips to the Philadelphia area today and St. Louis on March 10 to rally public support.
This week marks the one-year anniversary of the end of the last bear market that sent the S&P 500 plunging to a 12-year low of 666.79. A follow-through day (FTD) was produced on March 12, 2009 which helped confirm the rally which sent the benchmark average soaring +68% in the span of 12 months. A large portion of that rally was due to the enormous amount of cash fund managers raised during the horrific bear market. The latest study from the Investment Company Institute shows that equity mutual funds are burning through their cash reserves at the fastest rate since 1992. The report shows that cash reserves at equity mutual funds are at their lowest rate since 2007. Cash fell to 3.6% of assets, down from 5.7% in January 2009. The figures showed portfolio managers are left with about $172 billion in cash following the fastest drop in cash holdings since 1991.
Since last Monday's FTD the market and a batch of leading stocks steadily rallied, which is a healthy sign. The fact that we have not seen any serious distribution days since Monday's FTD bodes well for this nascent rally. It is also a welcome sign to see the market continue to improve as investors digest the latest round of stronger than expected economic and earnings data. Remember that now that a new rally has been confirmed, the window is open to start buying high quality breakouts. Trade accordingly.
Professional Money Management Services - A Winning System - Inquire today!
Our skilled team of portfolio managers knows how to follow the rules of this fact-based investment system. We do not follow opinion or the "conviction list" of some large Wall Street institution which would have us fully invested even during horrific bear markets. Instead, we remain fluid and only buy the best stocks when they are triggering proper technical buy signals. If you are not completely satisfied with the way your portfolio is being managed, Click here to get connected with one of our portfolio managers. *Accounts over $250,000 please. ** Serious inquires only, please.
PICTURED: The benchmark S&P 500 Index is perched within -1% of its recovery high. Meanwhile, the S&P 600 Small-Cap and S&P 400 Mid-Cap Indexes (not shown) have already climbed to new recovery highs.
|
|
|
 |
Financials and Retail Index Positives Amid Mixed Group Action
Kenneth J. Gruneisen - Passed the CAN SLIM® Master's Exam
The Broker/Dealer Index ($XBD +1.18%) was a standout gainer on Monday while small gains from the Retail Index ($RLX +0.38%) and Bank Index ($BKX +0.16%) also helped underpin the major averages. Small gains from the Internet Index ($IIX +0.99%) and Networking Index ($NWX +0.38%) were partially offset by the tech sector laggards, the Biotechnology Index ($BTK -0.46%) and Semiconductor Index ($SOX -0.09%). Defensive groups edged lower as the Gold & Silver Index ($XAU -0.94%) and Healthcare Index ($HMO -0.46%) started the week with small losses. The energy indexes were little changed as the Integrated Oil Index ($XOI -0.14%) and Oil Services Index ($OSX +0.14%) had a quiet day.
Charts courtesy www.stockcharts.com
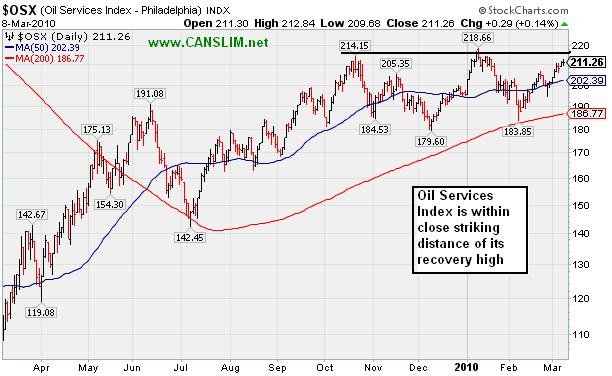
PICTURED: The Oil Services Index ($OSX +0.14%) has risen within close striking distance of its recovery high.
| Oil Services |
$OSX |
211.26 |
+0.29 |
+0.14% |
+8.38% |
| Healthcare |
$HMO |
1,472.25 |
-6.81 |
-0.46% |
-0.05% |
| Integrated Oil |
$XOI |
1,063.10 |
-1.44 |
-0.14% |
-0.48% |
| Semiconductor |
$SOX |
351.21 |
-0.32 |
-0.09% |
-2.42% |
| Networking |
$NWX |
251.00 |
+0.94 |
+0.38% |
+8.63% |
| Internet |
$IIX |
241.35 |
+2.37 |
+0.99% |
+3.20% |
| Broker/Dealer |
$XBD |
118.98 |
+1.39 |
+1.18% |
+3.42% |
| Retail |
$RLX |
436.89 |
+1.67 |
+0.38% |
+6.27% |
| Gold & Silver |
$XAU |
169.21 |
-1.60 |
-0.94% |
+0.57% |
| Bank |
$BKX |
48.69 |
+0.08 |
+0.16% |
+14.00% |
| Biotech |
$BTK |
1,167.88 |
-5.45 |
-0.46% |
+23.96% |
|
|
|
 |
Financial Firm Extended From Base After Recent Bullish Action
Kenneth J. Gruneisen - Passed the CAN SLIM® Master's Exam
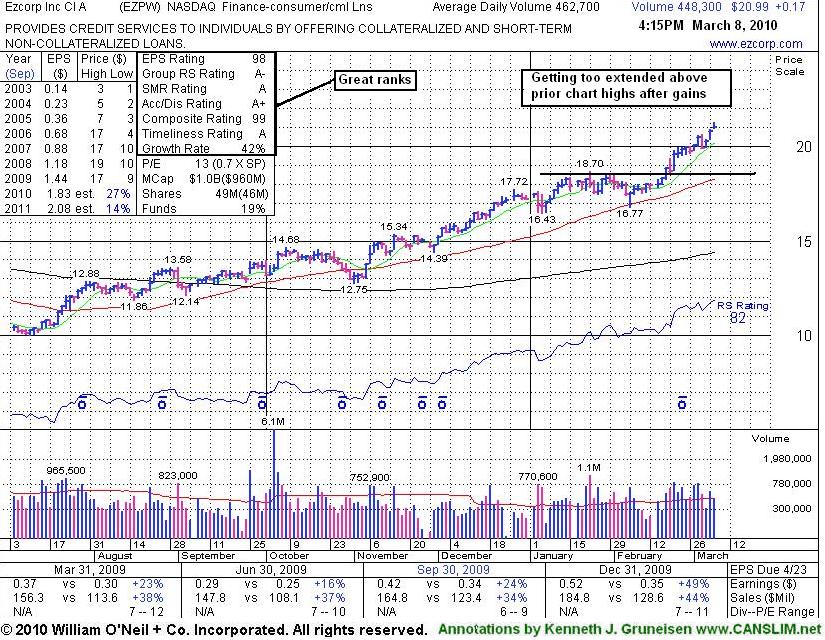
Ezcorp Inc (EZPW +$0.17 or +0.82% to $20.99) gapped up today and posted another small gain today with near average volume. At a new all-time high, it has recently been noted as "getting more extended from any sound base of support." As previously noted, since it managed to top its 2008 all-time high, no resistance remains due to overhead supply, but disciplined investors avoid chasing extended stocks trading more than +5% above prior chart highs.
EZPW was featured in yellow with new pivot point and may buy levels noted in the 2/19/10 mid-day report (read here). It followed a negative reversal on 2/19/10 with a considerable gain on the very next session (2/22/10) with twice average volume triggering a technical buy signal. By the evening of 2/24/10 its color code was changed to green as it had rallied above its "max buy" level. On pullbacks, prior chart highs in the $18 area define an important support level to watch now.
This previously featured Finance - Consumer/Commercial Loans firm was dropped from the Featured Stocks list on 10/09/08, yet it continued to show strong sales and earnings growth (solid fundamentals). Earnings per share increases have shown acceleration along with greater than +25% sales revenues increases in the latest quarterly comparisons (good C criteria) versus the year earlier, and a great annual earnings history (good A criteria).
|
|
|
Color Codes Explained :
Y - Better candidates highlighted by our
staff of experts.
G - Previously featured
in past reports as yellow but may no longer be buyable under the
guidelines.
***Last / Change / Volume quote data in this table corresponds with the timestamp on the note***
Symbol/Exchange
Company Name
Industry Group |
Last |
Chg. |
Vol
% DAV |
Date Featured |
Price Featured |
Latest Pivot Point
Featured |
Status |
| Latest Max Buy Price |
ARUN
- NASDAQ
Aruba Networks Inc
COMPUTER HARDWARE - Networking & Communication Dev
|
$12.58
|
+0.21
|
1,601,933
118% DAV
1,362,800
|
2/19/2010
(Date
Featured) |
$12.71
(Price
Featured) |
PP = $11.94 |
G |
| MB = $12.54 |
Most Recent Note - 3/8/2010 4:44:44 PM
G - Gain today with slightly above average volume for a new high close just above its "max buy" level. Color code is changed to green, and support to watch is now defined by prior chart highs and its 50 DMA line. ARUN was featured in the mid-day report on 2/19/10 as it rose from a flat base-on-base pattern above its 50-day moving average line (read here).
>>> The latest Featured Stock Update with an annotated graph appeared on 2/22/2010. click here.
|
|
C
A
S
I |
News |
Chart |
SEC
View all notes Alert
me of new notes
Company
Profile
|
BIDU
- NASDAQ
Baidu Inc Ads
INTERNET - Internet Information Providers
|
$534.33
|
+13.58
|
1,463,234
76% DAV
1,930,300
|
1/13/2010
(Date
Featured) |
$431.25
(Price
Featured) |
PP = $426.75 |
G |
| MB = $448.09 |
Most Recent Note - 3/8/2010 4:46:00 PM
G - Gain today with below average volume for another new all-time high. Its prior chart high near $470 is the nearest support level while it is extended above its mid-January highs. It rose steadily since the 2/10/10 gap up gain with more than 3 times average volume.
>>> The latest Featured Stock Update with an annotated graph appeared on 3/4/2010. click here.
|
|
C
A
S
I |
News |
Chart |
SEC
View all notes Alert
me of new notes
Company
Profile
|
BRLI
- NASDAQ
Bio Reference Labs Inc
HEALTH SERVICES - Medical Laboratories & Researc
|
$43.37
|
-0.52
|
161,389
176% DAV
91,800
|
2/12/2010
(Date
Featured) |
$39.02
(Price
Featured) |
PP = $40.97 |
G |
| MB = $43.02 |
Most Recent Note - 3/8/2010 4:57:21 PM
G - Pulled back with above average volume today after hitting a new 52-week high on Friday. Color code was changed to green after recent action. Breakout gain on 3/04/10 with 2 times average volume confirmed a technical buy signal. With no overhead supply, its weekly chart is marked by many up weeks with above average volume and few down weeks on volume -very bullish characteristics. This high-ranked Medical-Dental - Services firm was featured in yellow in the 2/12/10 mid-day report (read here).
>>> The latest Featured Stock Update with an annotated graph appeared on 3/1/2010. click here.
|
|
C
A
S
I |
News |
Chart |
SEC
View all notes Alert
me of new notes
Company
Profile
|
CACC
- NASDAQ
Credit Acceptance Corp
FINANCIAL SERVICES - Credit Services
|
$44.31
|
+0.84
|
34,158
58% DAV
58,900
|
9/29/2009
(Date
Featured) |
$33.48
(Price
Featured) |
PP = $37.10 |
G |
| MB = $38.96 |
Most Recent Note - 3/8/2010 4:59:58 PM
G - Posted another small gain on lighter volume today, yet it remains below its 50 DMA line which acted as resistance last week. Recent lows in the $38 area are a nearby chart support level to watch.
>>> The latest Featured Stock Update with an annotated graph appeared on 3/2/2010. click here.
|
|
C
A
S
I |
News |
Chart |
SEC
View all notes Alert
me of new notes
Company
Profile
|
CISG
- NASDAQ
Cninsure Inc Ads
INSURANCE - Insurance Brokers
|
$25.96
|
+0.13
|
429,410
218% DAV
196,800
|
3/3/2010
(Date
Featured) |
$24.38
(Price
Featured) |
PP = $23.10 |
G |
| MB = $24.26 |
Most Recent Note - 3/8/2010 5:03:18 PM
G - Hit a new 52-week high today with a 4th consecutive gain backed by well above average volume. On 3/03/10 broke out with 8 times average volume following its latest earnings report for the quarter ended Dec 31, 2009. It rose from a 20-week double bottom base as it was featured in the 3/03/10 mid-day report (read here).
>>> The latest Featured Stock Update with an annotated graph appeared on 3/3/2010. click here.
|
|
C
A
S
I |
News |
Chart |
SEC
View all notes Alert
me of new notes
Company
Profile
|
CRM
- NYSE
Salesforce.com Inc
INTERNET - Internet Software & Services
|
$72.95
|
+0.67
|
1,461,160
71% DAV
2,057,600
|
3/5/2010
(Date
Featured) |
$72.28
(Price
Featured) |
PP = $75.53 |
Y |
| MB = $79.31 |
Most Recent Note - 3/8/2010 5:06:11 PM
Y - Posted a 3rd consecutive gain today with below average volume, rising further above its 50 DMA line and closing only -3.4% from its all-time high. Color code was changed to yellow with new pivot point cited. Recent chart low ($64.77 on 2/25/10) is now an important support level to watch.
>>> The latest Featured Stock Update with an annotated graph appeared on 3/5/2010. click here.
|
|
C
A
S
I |
News |
Chart |
SEC
View all notes Alert
me of new notes
Company
Profile
|
CTRP
- NASDAQ
Ctrip.com Intl Ltd Adr
LEISURE - Resorts & Casinos
|
$39.40
|
+0.77
|
1,661,644
76% DAV
2,176,200
|
3/1/2010
(Date
Featured) |
$38.23
(Price
Featured) |
PP = $38.50 |
Y |
| MB = $40.43 |
Most Recent Note - 3/8/2010 5:13:31 PM
Y - Gain today with lighter than average volume, wedging further above its pivot point. It proposed and completed an offering of additional shares last week after it was recently featured in the new March 2010 issue of CANSLIM.net News (read here). A gain above its pivot point or its most recent chart highs is still needed to confirm a fresh technical buy signal with +50% above average volume or more.
>>> The latest Featured Stock Update with an annotated graph appeared on 2/28/2010. click here.
|
|
C
A
S
I |
News |
Chart |
SEC
View all notes Alert
me of new notes
Company
Profile
|
EZPW
- NASDAQ
Ezcorp Inc Cl A
SPECIALTY RETAIL - Specialty Retail, Other
|
$20.99
|
+0.17
|
449,325
97% DAV
462,700
|
2/19/2010
(Date
Featured) |
$19.03
(Price
Featured) |
PP = $18.80 |
G |
| MB = $19.74 |
Most Recent Note - 3/8/2010 5:14:20 PM
G - Gain today with near average volume for another new all-time high, getting more extended from any sound base of support. Prior chart highs in the $18 area define an important support level to watch. Featured in yellow in the 2/19/10 mid-day report (read here).
>>> The latest Featured Stock Update with an annotated graph appeared on 3/8/2010. click here.
|
|
C
A
S
I |
News |
Chart |
SEC
View all notes Alert
me of new notes
Company
Profile
|
GMCR
- NASDAQ
Green Mtn Coffee Roastrs
FOOD & BEVERAGE - Processed & Packaged Goods
|
$92.44
|
+4.70
|
2,246,436
166% DAV
1,352,600
|
2/26/2010
(Date
Featured) |
$84.39
(Price
Featured) |
PP = $88.75 |
Y |
| MB = $93.19 |
Most Recent Note - 3/8/2010 5:17:03 PM
Y - Gain today with +66% above average volume while rising above its pivot point triggered a new technical buy signal. Important initial support level to watch is its 50 DMA line and recent lows near the $80 area.
>>> The latest Featured Stock Update with an annotated graph appeared on 2/23/2010. click here.
|
|
C
A
S
I |
News |
Chart |
SEC
View all notes Alert
me of new notes
Company
Profile
|
ISRG
- NASDAQ
Intuitive Surgical Inc
HEALTH SERVICES - Medical Appliances & Equipment
|
$355.97
|
-2.43
|
220,886
43% DAV
515,200
|
1/22/2010
(Date
Featured) |
$340.40
(Price
Featured) |
PP = $314.00 |
G |
| MB = $329.70 |
Most Recent Note - 3/8/2010 5:19:46 PM
G - Down on light volume today, consolidating after quietly touching new all-time high territory last week. ISRG was featured at $340.40 in the 1/22/10 mid-day report following a powerful breakaway gap (read here).
>>> The latest Featured Stock Update with an annotated graph appeared on 2/24/2010. click here.
|
|
C
A
S
I |
News |
Chart |
SEC
View all notes Alert
me of new notes
Company
Profile
|
PCLN
- NASDAQ
Priceline.com Inc
INTERNET - Internet Software & Services
|
$399.55
|
-4.72
|
584,812
N/A
|
11/1/2002
(Date
Featured) |
$399.55
(Price
Featured) |
PP = $428.20 |
Y |
| MB = $449.61 |
Most Recent Note - 1/2/2011
Y - Returns to Featured Stocks list with its appearance in the January 2011 CANSLIM.net News including detailed analysis and annotated daily and weekly graphs.
>>> The latest Featured Stock Update with an annotated graph appeared on 2/18/2010. click here.
|
|
C
A
S
I |
News |
Chart |
SEC
View all notes Alert
me of new notes
Company
Profile
|
PEGA
- NASDAQ
Pegasystems Inc
COMPUTER SOFTWARE & SERVICES - Business Software & Services
|
$36.03
|
+0.17
|
137,804
68% DAV
201,200
|
2/26/2010
(Date
Featured) |
$36.00
(Price
Featured) |
PP = $38.55 |
Y |
| MB = $40.48 |
Most Recent Note - 3/8/2010 5:29:42 PM
Y - Perched within close striking distance of its pivot point, it posted a second consecutive gain today on light volume. Recently finding support at its 50 DMA line, while prior chart lows in the $32 area are the next support level.
>>> The latest Featured Stock Update with an annotated graph appeared on 2/26/2010. click here.
|
|
C
A
S
I |
News |
Chart |
SEC
View all notes Alert
me of new notes
Company
Profile
|
ROVI
- NASDAQ
Rovi Corp
COMPUTER SOFTWARE & SERVICES - Security Software & Services
|
$35.47
|
+0.45
|
781,515
76% DAV
1,025,900
|
2/25/2010
(Date
Featured) |
$33.54
(Price
Featured) |
PP = $34.87 |
Y |
| MB = $36.61 |
Most Recent Note - 3/8/2010 5:32:20 PM
Y - Posted a third consecutive gain, rising on light volume today for a new 52-week high. Considerable 3/02/10 gain with volume more than 2 times average triggered a technical buy signal as it rallied above its pivot point. It announced news after the 3/01/10 close about an expansion of its relationship with Comcast (read here). Featured on 2/25/10 in yellow in the mid-day report (read here).
>>> The latest Featured Stock Update with an annotated graph appeared on 2/25/2010. click here.
|
|
C
A
S
I |
News |
Chart |
SEC
View all notes Alert
me of new notes
Company
Profile
|
SIRO
- NASDAQ
Sirona Dental Systems
HEALTH SERVICES - Medical Instruments & Supplies
|
$37.21
|
-0.04
|
243,526
44% DAV
556,400
|
2/16/2010
(Date
Featured) |
$36.43
(Price
Featured) |
PP = $36.15 |
Y |
| MB = $37.96 |
Most Recent Note - 3/8/2010 5:35:01 PM
Y - Small loss on light volume today leaves it still perched above its pivot point yet below its max buy level. It was featured in yellow in the 2/16/10 mid-day report (read here) as it broke out from a 10-week flat base.
>>> The latest Featured Stock Update with an annotated graph appeared on 2/16/2010. click here.
|
|
C
A
S
I |
News |
Chart |
SEC
View all notes Alert
me of new notes
Company
Profile
|
VPRT
- NASDAQ
Vistaprint Nv
DIVERSIFIED SERVICES - Business/Management Services
|
$61.72
|
+0.64
|
356,525
73% DAV
489,200
|
3/1/2010
(Date
Featured) |
$57.72
(Price
Featured) |
PP = $59.70 |
Y |
| MB = $62.69 |
Most Recent Note - 3/8/2010 5:36:49 PM
Y - Posted a 3rd consecutive gain today on below average volume for a new all-time high above its pivot point, yet still under its max buy level. Its gain on 3/02/10 was below the volume guidelines for buyable breakouts under the investment system. Featured in the March 2010 CANSLIM.net News monthly newsletter (read here).
>>> The latest Featured Stock Update with an annotated graph appeared on 2/28/2010. click here.
|
|
C
A
S
I |
News |
Chart |
SEC
View all notes Alert
me of new notes
Company
Profile
|
|
|
|
THESE ARE NOT BUY RECOMMENDATIONS!
Comments contained in the body of this report are technical
opinions only. The material herein has been obtained
from sources believed to be reliable and accurate, however,
its accuracy and completeness cannot be guaranteed.
This site is not an investment advisor, hence it does
not endorse or recommend any securities or other investments.
Any recommendation contained in this report may not
be suitable for all investors and it is not to be deemed
an offer or solicitation on our part with respect to
the purchase or sale of any securities. All trademarks,
service marks and trade names appearing in this report
are the property of their respective owners, and are
likewise used for identification purposes only.
This report is a service available
only to active Paid Premium Members.
You may opt-out of receiving report notifications
at any time. Questions or comments may be submitted
by writing to Premium Membership Services 665 S.E. 10 Street, Suite 201 Deerfield Beach, FL 33441-5634 or by calling 1-800-965-8307
or 954-785-1121.
|
|
|


