You are not logged in.
This means you
CAN ONLY VIEW reports that were published prior to Monday, March 31, 2025.
You
MUST UPGRADE YOUR MEMBERSHIP if you want to see any current reports.
AFTER MARKET UPDATE - FRIDAY, MARCH 7TH, 2014
Previous After Market Report Next After Market Report >>>
|
|
|
|
DOW |
+30.83 |
16,452.72 |
+0.19% |
|
Volume |
710,466,520 |
+7% |
|
Volume |
2,036,728,630 |
+1% |
|
NASDAQ |
-15.91 |
4,336.22 |
-0.37% |
|
Advancers |
1,262 |
40% |
|
Advancers |
1,265 |
47% |
|
S&P 500 |
+1.01 |
1,878.04 |
+0.05% |
|
Decliners |
1,765 |
56% |
|
Decliners |
1,322 |
49% |
|
Russell 2000 |
-1.23 |
1,203.32 |
-0.10% |
|
52 Wk Highs |
206 |
|
|
52 Wk Highs |
167 |
|
|
S&P 600 |
+0.52 |
681.22 |
+0.08% |
|
52 Wk Lows |
7 |
|
|
52 Wk Lows |
9 |
|
|
 |
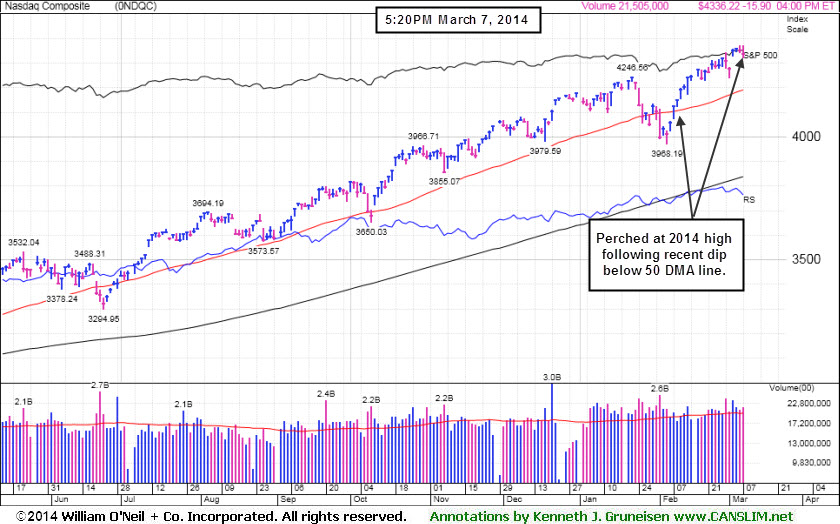
Major Averages Rose For Week and Ended Mixed on Friday
Kenneth J. Gruneisen - Passed the CAN SLIM® Master's Exam
For the week, the Dow advanced +0.8%, the S&P 500 gained +0.9% and the NASDAQ rose +0.6%. Friday the major averages ended mixed on the session. The volume totals were reported slightly higher on the NYSE and on the Nasdaq exchange. Decliners led advancers by a 3-2 margin on the NYSE and by a very narrow margin Nasdaq exchange. There were 69 high-ranked companies from the CANSLIM.net Leaders List that made new 52-week highs and appeared on the CANSLIM.net BreakOuts Page, down from the total of 85 stocks on the prior session. The list of stocks hitting new 52-week highs contracted yet still easily outnumbered new 52-week lows on the Nasdaq exchange and on the NYSE, and new 52-week lows were in the single digits on both major exchanges again. There were gains for 4 of the 12 high-ranked companies currently included on the Featured Stocks Page. The Market (M criteria) environment has been noted as a "Confirmed Uptrend". For any rally to be sustained it is critical for there to be healthy leadership, so it remains crucial for many stocks to continue hitting new 52-week highs.
Stocks toggled between gains and losses throughout Friday's session as lingering tensions between Russia and the Ukraine kept investors sidelined. The latest employment data was largely positive. Specifically, non-farm payrolls grew by 175,000 in February, more than the anticipated gain of 150,000 jobs. Despite the gain, the unemployment rate unexpectedly ticked higher to 6.7%.
Corporate earnings were also a factor in the session. Shares of Foot Locker (FL +8.8%) rose after the company exceeded analysts' estimates in the quarter. Big Lots (LOTS +23%) also ended higher, rallying following their results. On the downside, Fresh Market (TFM -2.5%) fell after posting a weaker-than-anticipated earnings report.
Turning o fixed income markets, Treasuries ended lower along the curve. The benchmark 10-year note was down 7/16 of a point to yield 2.79% and the 30-year bond was lower by 9/16 of a point to yield 3.73%.
The CANSLIM.net Featured Stocks Page shows the most action-worthy candidates and their latest notes and a Headline Link directs members to the latest detailed analysis with data-packed graphs annotated by a Certified expert along with links to additional resources. The Premium Member Homepage includes "dynamic archives" to all prior pay reports published. Watch for an announcement via email concerning the next WEBCAST.
PICTURED: The Nasdaq Composite Index is perched near its 2014 high.
|
 Kenneth J. Gruneisen started out as a licensed stockbroker in August 1987, a couple of months prior to the historic stock market crash that took the Dow Jones Industrial Average down -22.6% in a single day. He has published daily fact-based fundamental and technical analysis on high-ranked stocks online for two decades. Through FACTBASEDINVESTING.COM, Kenneth provides educational articles, news, market commentary, and other information regarding proven investment systems that work in good times and bad.
Comments contained in the body of this report are technical opinions only and are not necessarily those of Gruneisen Growth Corp. The material herein has been obtained from sources believed to be reliable and accurate, however, its accuracy and completeness cannot be guaranteed. Our firm, employees, and customers may effect transactions, including transactions contrary to any recommendation herein, or have positions in the securities mentioned herein or options with respect thereto. Any recommendation contained in this report may not be suitable for all investors and it is not to be deemed an offer or solicitation on our part with respect to the purchase or sale of any securities. |
|
 |
Financial Stocks Underpinned the Major Averages
Kenneth J. Gruneisen - Passed the CAN SLIM® Master's Exam
The Broker/Dealer Index ($XBD +0.44%) and Bank Index ($BKX +0.93%) both posted gains and were a positive influence on the major averages. The Gold & Silver Index ($XAU -2.43%) fell hard as it gave back part of the considerable +22.58% gain it had tallied thus far in 2014. The Networking Index ($NWX -0.49%) posted a modest loss and the Semiconductor Index ($SOX -0.11%) edged lower while the Biotechnology Index ($BTK +0.20%) and the Retail Index ($RLX +0.25%) posted small gains. Energy-related shares were directionless with the Oil Services Index ($OSX +0.01%) and the Integrated Oil Index ($XOI +0.14%) little changed.
Charts courtesy www.stockcharts.com
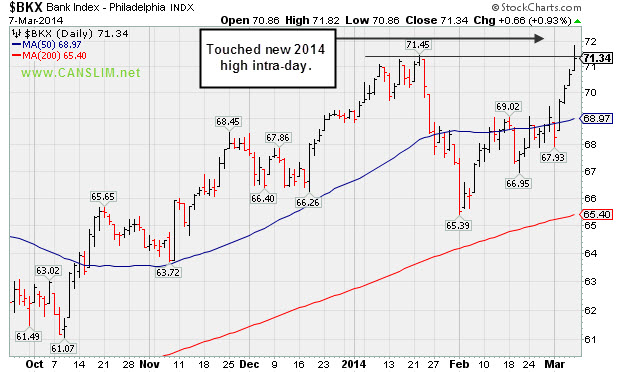
PICTURED: The Bank Index ($BKX +0.93%) touched a new 2014 high. Healthy action in financial stocks is encourgaing news which bodes well for the broader market outlook. Rarely do the major averages suffer bad downdrafts while financial stocks are acting strong.
| Oil Services |
$OSX |
282.48 |
+0.02 |
+0.01% |
+0.52% |
| Integrated Oil |
$XOI |
1,488.11 |
+2.03 |
+0.14% |
-1.00% |
| Semiconductor |
$SOX |
574.39 |
-0.63 |
-0.11% |
+7.36% |
| Networking |
$NWX |
349.66 |
-1.73 |
-0.49% |
+7.94% |
| Broker/Dealer |
$XBD |
164.24 |
+0.72 |
+0.44% |
+2.29% |
| Retail |
$RLX |
941.56 |
+2.37 |
+0.25% |
+0.19% |
| Gold & Silver |
$XAU |
100.64 |
-2.51 |
-2.43% |
+19.60% |
| Bank |
$BKX |
71.34 |
+0.66 |
+0.93% |
+3.00% |
| Biotech |
$BTK |
2,820.44 |
+5.66 |
+0.20% |
+21.03% |
|
|
|
 |
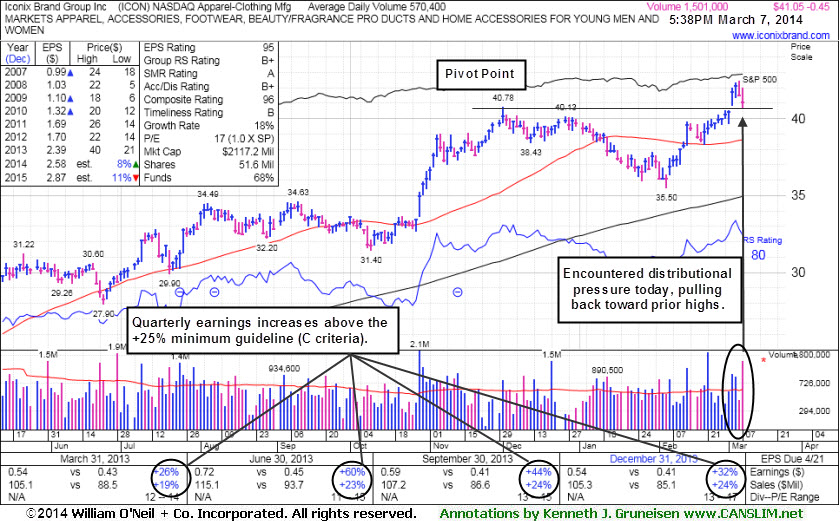
Encountered Distributional Pressure Following Recent Breakout
Kenneth J. Gruneisen - Passed the CAN SLIM® Master's Exam
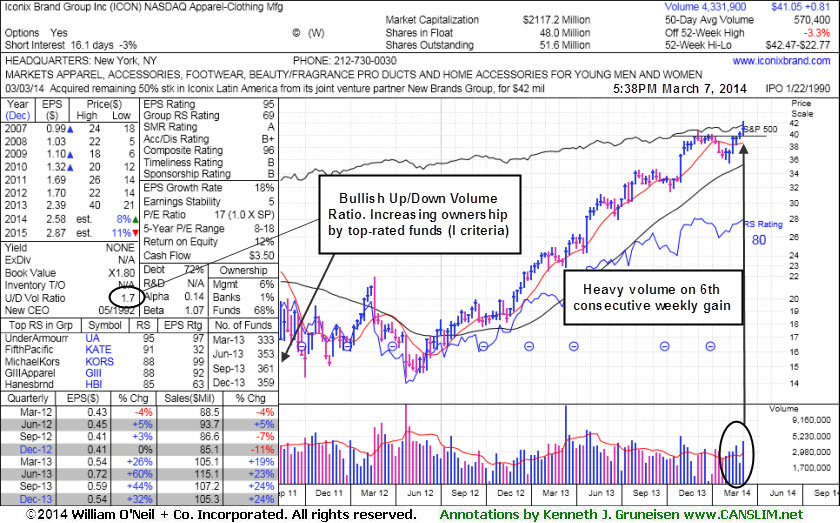
Iconix Brand Group Inc (ICON -$0.45 or -1.08% to $41.05) encountered distributional pressure and suffered a loss with above average volume on Friday after highlighted in yellow with pivot point cited based on its 12/02/13 high plus 10 cents in the earlier mid-day report (read here). The weekly chart shows it was the 6th consecutive weekly gain, and it has the look of a riskier "late-stage" base. Disciplined investors always limit losses by selling any stock that falls more than -7% from their purchase price. It is consolidating above prior highs in the $40 area defining near-term support.
Technically, on 3/04/14 it gapped up for a volume-driven breakout to new high territory. No resistance remains due to overhead supply so it is free to rally unhindered by anxious sellers hoping to break even on a losing trade. The high-ranked Apparel - Clothing Manufacturing firm reported earnings +44% on +24% sales revenues for the Sep '13 quarter, marking its 3rd consecutive quarterly earnings increase above the +25% guideline (C criteria). Its annual earnings (A criteria) history has been steady. The 12/13/13 mid-day report last noted - "Patient investors may watch for a new base of secondary buy point to possibly develop and be noted in the weeks ahead."
The number of top-rated funds owning its shares rose from 333 in Mar '13 to 359 in Dec '13, a reassuring sign concerning the I criteria. Its current Up/Down Volume Ratio of 1.7 is an unbiased indication that its shares have been under accumulation over the past 50 days.
|
|
|
Color Codes Explained :
Y - Better candidates highlighted by our
staff of experts.
G - Previously featured
in past reports as yellow but may no longer be buyable under the
guidelines.
***Last / Change / Volume data in this table is the closing quote data***
Symbol/Exchange
Company Name
Industry Group |
PRICE |
CHANGE
(%Change) |
Day High |
Volume
(% DAV)
(% 50 day avg vol) |
52 Wk Hi
% From Hi |
Featured
Date |
Price
Featured |
Pivot Featured |
|
Max Buy |
EQM
-
NYSE
E Q T Midstream Partners
ENERGY - Oil and Gas Pipelines
|
$65.22
|
-0.54
-0.82% |
$66.73
|
62,972
57.77% of 50 DAV
50 DAV is 109,000
|
$67.80
-3.81%
|
12/12/2013
|
$53.17
|
PP = $56.51
|
|
MB = $59.34
|
Most Recent Note - 3/3/2014 5:44:55 PM
G - Stubbornly holding its ground since reporting earnings -2% on +22% sales revenues for the Dec '13 quarter, below the +25% minimum earnings guideline (C criteria), raising fundamental concerns. Its 50 DMA line defines near-term support where a violation may trigger a technical sell signal. See the latest FSU analysis for more details and new annotated graphs.
>>> FEATURED STOCK ARTICLE : Resilient Despite Fundamental Concerns - 3/3/2014
View all notes |
Set NEW NOTE alert |
CANSLIM.net Company Profile |
SEC
News |
Chart |
Request a new note
C
A N
S L
I M


|
FB
-
NASDAQ
Facebook Inc Cl A
INTERNET
|
$69.80
|
-1.04
-1.47% |
$71.18
|
38,833,731
64.51% of 50 DAV
50 DAV is 60,200,000
|
$71.97
-3.02%
|
12/12/2013
|
$51.40
|
PP = $54.93
|
|
MB = $57.68
|
Most Recent Note - 3/5/2014 5:19:09 PM
G - Gapped up and hit another new all-time high with today's volume-driven gain. Extended from any sound base and its 50 DMA line ($61.13 now) defines near-term support to watch.
>>> FEATURED STOCK ARTICLE : High-Ranked Internet Group Leader is Extended From Base - 2/25/2014
View all notes |
Set NEW NOTE alert |
CANSLIM.net Company Profile |
SEC
News |
Chart |
Request a new note
C
A N
S L
I M
|
FLT
-
NYSE
Fleetcor Technologies
DIVERSIFIED SERVICES - Business/Management Services
|
$125.88
|
-0.65
-0.51% |
$127.68
|
609,197
53.53% of 50 DAV
50 DAV is 1,138,000
|
$132.22
-4.80%
|
3/5/2014
|
$125.40
|
PP = $124.06
|
|
MB = $130.26
|
Most Recent Note - 3/5/2014 5:17:07 PM
Y - Highlighted in yellow in the earlier mid-day report (read here) with pivot point cited based on its 12/02/13 high plus 10 cents. Consolidating above prior highs following a recent spurt of volume-driven gains for new 52-week highs, and technically, it broke out last week. After dropped from the Featured Stocks list on 1/15/14 it rebounded above its 50 DMA line and made gradual progress. Fundamentals remain strong with earnings +32% on +26% sales revenues for the Dec '13 continuing its strong earnings history satisfying the C criteria. See the latest FSU analysis for more details and new annotated graphs.
>>> FEATURED STOCK ARTICLE : Consolidating Following Recent Breakout to New High Territory - 3/5/2014
View all notes |
Set NEW NOTE alert |
CANSLIM.net Company Profile |
SEC
News |
Chart |
Request a new note
C
A N
S L
I M
|
GNRC
-
NYSE
Generac Hldgs Inc
Electrical-Power/Equipmt
|
$59.24
|
+0.24
0.41% |
$59.55
|
456,236
48.54% of 50 DAV
50 DAV is 940,000
|
$59.35
-0.19%
|
2/14/2014
|
$56.50
|
PP = $57.39
|
|
MB = $60.26
|
Most Recent Note - 3/3/2014 5:39:16 PM
Y - Volume totals have been cooling while consolidating near previously stubborn resistance in the $57 area, while no resistance remains due to overhead supply. Volume should be at least +40% above average as a stock rallies above its pivot point to trigger a proper technical buy signal.
>>> FEATURED STOCK ARTICLE : Following Island Reversal Prior Highs May Act as Resistance - 2/14/2014
View all notes |
Set NEW NOTE alert |
CANSLIM.net Company Profile |
SEC
News |
Chart |
Request a new note
C
A N
S L
I M
|
ICON
-
NASDAQ
Iconix Brand Group Inc
CONSUMER NON-DURABLES - Textile - Apparel Footwear
|
$41.05
|
-0.45
-1.08% |
$42.03
|
1,501,043
263.34% of 50 DAV
50 DAV is 570,000
|
$42.47
-3.34%
|
3/7/2014
|
$41.46
|
PP = $40.88
|
|
MB = $42.92
|
 Most Recent Note - 3/7/2014 6:03:41 PM
Y - Encountered distributional pressure today as it suffered a loss with above average volume after highlighted in yellow with pivot point cited based on its 12/02/13 high plus 10 cents in the mid-day report (read here). Consolidating above prior highs in the $40 area defining near-term support following a gap up on 3/04/14 and volume-driven breakout. Reported earnings +44% on +24% sales revenues for the Sep '13 quarter, marking its 3rd consecutive quarterly earnings increase above the +25% guideline (C criteria). See the latest FSU analysis for more details and new annotated daily and weekly graphs.
>>> FEATURED STOCK ARTICLE : Encountered Distributional Pressure Following Recent Breakout - 3/7/2014
View all notes |
Set NEW NOTE alert |
CANSLIM.net Company Profile |
SEC
News |
Chart |
Request a new note
C
A N
S L
I M
|
Symbol/Exchange
Company Name
Industry Group |
PRICE |
CHANGE
(%Change) |
Day High |
Volume
(% DAV)
(% 50 day avg vol) |
52 Wk Hi
% From Hi |
Featured
Date |
Price
Featured |
Pivot Featured |
|
Max Buy |
KORS
-
NYSE
Michael Kors Hldgs Ltd
RETAIL - Apparel Stores
|
$98.28
|
-0.34
-0.34% |
$99.44
|
1,367,747
36.18% of 50 DAV
50 DAV is 3,780,000
|
$101.04
-2.73%
|
2/4/2014
|
$90.92
|
PP = $84.68
|
|
MB = $88.91
|
Most Recent Note - 3/5/2014 5:23:42 PM
G - Holding its ground in a tight range near its 52-week high with volume totals cooling in recent weeks indicating that few investors have headed for the exit. Prior highs in the $84 area define the nearest chart support level.
>>> FEATURED STOCK ARTICLE : Extended From Sound Base and Wedging Higher - 2/19/2014
View all notes |
Set NEW NOTE alert |
CANSLIM.net Company Profile |
SEC
News |
Chart |
Request a new note
C
A N
S L
I M
|
LEAF
-
NYSE
Springleaf Holdings Inc
Finance-Consumer Loans
|
$27.96
|
+0.14
0.50% |
$28.43
|
203,627
69.50% of 50 DAV
50 DAV is 293,000
|
$29.50
-5.22%
|
2/24/2014
|
$28.60
|
PP = $27.44
|
|
MB = $28.81
|
Most Recent Note - 3/5/2014 5:21:17 PM
Y - Gapped down today for a loss with above average volume yet ended in the middle of its intra-day range. Prior highs in the $27 area define initial support to watch following its recent technical breakout. Disciplined investors avoid chasing extended stocks more than +5% above prior highs and always limit losses by selling any stock that falls more than -7% from their purchase price. See the annotated daily graph below this note and details with a weekly graph in the latest FSU analysis.

>>> FEATURED STOCK ARTICLE : Breakout Backed by Four Times Average Volume - 2/24/2014
View all notes |
Set NEW NOTE alert |
CANSLIM.net Company Profile |
SEC
News |
Chart |
Request a new note
C
A N
S L
I M
|
PCLN
-
NASDAQ
Priceline.com Inc
INTERNET - Internet Software and Services
|
$1,358.04
|
-6.36
-0.47% |
$1,373.89
|
559,615
73.73% of 50 DAV
50 DAV is 759,000
|
$1,378.96
-1.52%
|
12/18/2013
|
$1,156.20
|
PP = $1,198.85
|
|
MB = $1,258.79
|
Most Recent Note - 3/3/2014 2:47:31 PM
G - Holding its ground near its 52-week high today with volume totals cooling after an impressive streak of gains. Rallied with no resistance due to overhead supply, and it is extended from any sound base.
>>> FEATURED STOCK ARTICLE : Extended From Prior Highs After 6th Straight Gain - 2/13/2014
View all notes |
Set NEW NOTE alert |
CANSLIM.net Company Profile |
SEC
News |
Chart |
Request a new note
C
A N
S L
I M
|
PSIX
-
NASDAQ
Power Solutions Intl Inc
Machinery-Gen Industrial
|
$84.27
|
+3.49
4.32% |
$84.97
|
80,240
138.34% of 50 DAV
50 DAV is 58,000
|
$81.47
3.44%
|
2/28/2014
|
$74.65
|
PP = $76.93
|
|
MB = $80.78
|
Most Recent Note - 3/7/2014 4:00:13 PM
G - Hit another new 52-week high today's considerable volume-driven gain and its color code is changed to green after rallying beyond its "max buy" level. The prior gain above the pivot point was backed by +92% above average volume triggering a technical buy signal.

>>> FEATURED STOCK ARTICLE : Earnings Solid and Forming a Cup-With-Handle - 2/28/2014
View all notes |
Set NEW NOTE alert |
CANSLIM.net Company Profile |
SEC
News |
Chart |
Request a new note
C
A N
S L
I M
|
SILC
-
NASDAQ
Silicom Ltd
COMPUTER HARDWARE - Networking andamp; Communication Dev
|
$69.15
|
-0.89
-1.27% |
$70.14
|
97,745
122.18% of 50 DAV
50 DAV is 80,000
|
$73.44
-5.84%
|
12/23/2013
|
$44.62
|
PP = $46.25
|
|
MB = $48.56
|
Most Recent Note - 3/7/2014 1:12:45 PM
G - Pulling back from all-time highs after getting extended from any sound base with 11 consecutive weekly gains. Patient investors may watch for a new base or secondary buy point to possibly develop and be noted in the weeks ahead.
>>> FEATURED STOCK ARTICLE : Very Extended From Prior Base After 11 Straight Weekly Gains - 3/6/2014
View all notes |
Set NEW NOTE alert |
CANSLIM.net Company Profile |
SEC
News |
Chart |
Request a new note
C
A N
S L
I M
|
Symbol/Exchange
Company Name
Industry Group |
PRICE |
CHANGE
(%Change) |
Day High |
Volume
(% DAV)
(% 50 day avg vol) |
52 Wk Hi
% From Hi |
Featured
Date |
Price
Featured |
Pivot Featured |
|
Max Buy |
ULTI
-
NASDAQ
Ultimate Software Group
INTERNET - Internet Software and Services
|
$159.65
|
-3.30
-2.03% |
$164.74
|
186,908
123.78% of 50 DAV
50 DAV is 151,000
|
$171.96
-7.16%
|
1/27/2014
|
$153.75
|
PP = $162.98
|
|
MB = $171.13
|
Most Recent Note - 3/5/2014 5:24:56 PM
Y - Still hovering above its pivot point and below its "max buy" level. Found support above its 50 DMA line following a worrisome "negative reversal" on 2/05/14.
>>> FEATURED STOCK ARTICLE : Near 52--Week High Following Another Volume-Driven Gain - 3/4/2014
View all notes |
Set NEW NOTE alert |
CANSLIM.net Company Profile |
SEC
News |
Chart |
Request a new note
C
A N
S L
I M
|
VRX
-
NYSE
Valeant Pharmaceuticals
DRUGS - Drug Manufacturers - Other
|
$141.37
|
+2.82
2.04% |
$141.66
|
3,634,072
228.13% of 50 DAV
50 DAV is 1,593,000
|
$153.10
-7.66%
|
9/11/2013
|
$100.26
|
PP = $105.50
|
|
MB = $110.78
|
Most Recent Note - 3/7/2014 1:16:35 PM
G - Testing its 50 DMA line ($134) which defines near-term support. A more damaging violation may raise serious concerns and trigger a more worrisome technical sell signal.
>>> FEATURED STOCK ARTICLE : Strong Earnings Report; On Track for 9th Weekly Gain in 10 Weeks - 2/27/2014
View all notes |
Set NEW NOTE alert |
CANSLIM.net Company Profile |
SEC
News |
Chart |
Request a new note
C
A N
S L
I M
|
|
|
|
THESE ARE NOT BUY RECOMMENDATIONS!
Comments contained in the body of this report are technical
opinions only. The material herein has been obtained
from sources believed to be reliable and accurate, however,
its accuracy and completeness cannot be guaranteed.
This site is not an investment advisor, hence it does
not endorse or recommend any securities or other investments.
Any recommendation contained in this report may not
be suitable for all investors and it is not to be deemed
an offer or solicitation on our part with respect to
the purchase or sale of any securities. All trademarks,
service marks and trade names appearing in this report
are the property of their respective owners, and are
likewise used for identification purposes only.
This report is a service available
only to active Paid Premium Members.
You may opt-out of receiving report notifications
at any time. Questions or comments may be submitted
by writing to Premium Membership Services 665 S.E. 10 Street, Suite 201 Deerfield Beach, FL 33441-5634 or by calling 1-800-965-8307
or 954-785-1121.
|
|
|

