You are not logged in.
This means you
CAN ONLY VIEW reports that were published prior to Monday, March 10, 2025.
You
MUST UPGRADE YOUR MEMBERSHIP if you want to see any current reports.
AFTER MARKET UPDATE - THURSDAY, MARCH 7TH, 2013
Previous After Market Report Next After Market Report >>>
|
|
|
|
DOW |
+33.25 |
14,329.49 |
+0.23% |
|
Volume |
708,441,050 |
+4% |
|
Volume |
1,618,231,930 |
-5% |
|
NASDAQ |
+9.72 |
3,232.09 |
+0.30% |
|
Advancers |
1,751 |
56% |
|
Advancers |
1,492 |
58% |
|
S&P 500 |
+2.80 |
1,544.26 |
+0.18% |
|
Decliners |
1,270 |
40% |
|
Decliners |
962 |
37% |
|
Russell 2000 |
+4.61 |
934.57 |
+0.50% |
|
52 Wk Highs |
246 |
|
|
52 Wk Highs |
192 |
|
|
S&P 600 |
+2.43 |
521.48 |
+0.47% |
|
52 Wk Lows |
7 |
|
|
52 Wk Lows |
12 |
|
|
 |
Major Averages Post Fourth Straight Day of Gains
Kenneth J. Gruneisen - Passed the CAN SLIM® Master's Exam
The major averages extended their winning streak to four consecutive gains on Thursday. Volume totals were reported mixed, slighty higher than the prior session total on the NYSE, but lower on the Nasdaq exchange. Breadth was positive as advancers led decliners by a 3-2 margin on the NYSE and on the Nasdaq exchange. The total number of stocks hitting new 52-week highs (leadership) contracted, yet new highs still solidly outnumbered new 52-week lows on the NYSE and on the Nasdaq exchange. There were 60 high-ranked companies from the CANSLIM.net Leaders List making new 52-week highs and appearing on the CANSLIM.net BreakOuts Page, down from the prior session's total of 99 stocks. There were gains for 8 of the 16 high-ranked companies currently included on the Featured Stocks Page, a list that has recently expanded with a few new added leaders. Coupled with solid leadership, the Nasdaq Composite Index's solid +1.32% gain on higher volume Tuesday was considered a follow-through day, shifting the market's (M criteria) direction to a confirmed rally again after a brief correction.
Employment data once again helped lift the market. Ahead of Friday's non-farm payrolls report, jobless claims surprisingly fell last week by 7,000 to a six-week low of 340,000 and the four-week average dropped to a five-year low. Meanwhile, the U.S. trade deficit widened more than expected in January amid a rebound in demand for oil imports. The gap expanded by 16.5% to $44.4 billion from the smallest reading in three years set back in December. Upbeat comments from the ECB added to the positive tone. The central bank's leader President Mario Draghi said recent data suggests euro zone economic activity should gradually improve this year while inflationary pressures remain contained.
Overall, most sectors gained ground in early action. Treasury prices fell for a fourth day. Consumer discretionary stocks were notable performers as retailers advanced. Costco Wholesale Corp (COST -0.58%) and Limited Brands Inc (LTD -0.40%) ended lower after both companies posted better-than-expected same-store sales results. PetSmart Inc (PETM -6.57%) fell and Vail Resorts Inc (MTN +7.27%) in reaction to their latest earnings reports.
Any sustainable rally requires a healthy crop of companies hitting new 52-week highs, so it is always essential to see meaningful leadership (stocks hitting new 52-week highs). New buying efforts are justified under the fact-based system since Nasdaq Composite Index's solid gain on higher volume may be considered a follow-through day, shifting the market's (M criteria) direction to a confirmed rally again after a brief correction.
Watch for an announcement via email concerning the next WEBCAST. The webcast will also be available via an updated link highlighted at the top of the Premium Member Homepage.
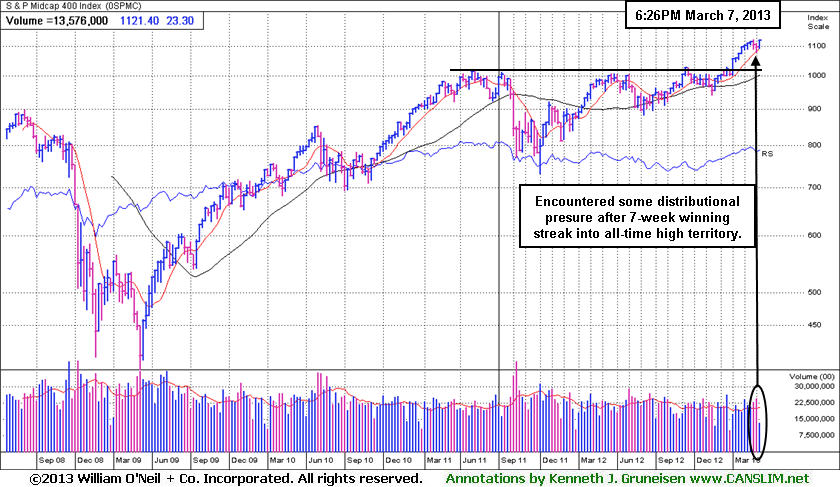
PICTURED: The S&P 400 Mid-Cap Index found support near its 10-week moving average (WMA) line when enduring distributional pressure after rallying into new all-time high territory with a streak of 7 consecutive weekly gains.
|
 Kenneth J. Gruneisen started out as a licensed stockbroker in August 1987, a couple of months prior to the historic stock market crash that took the Dow Jones Industrial Average down -22.6% in a single day. He has published daily fact-based fundamental and technical analysis on high-ranked stocks online for two decades. Through FACTBASEDINVESTING.COM, Kenneth provides educational articles, news, market commentary, and other information regarding proven investment systems that work in good times and bad.
Comments contained in the body of this report are technical opinions only and are not necessarily those of Gruneisen Growth Corp. The material herein has been obtained from sources believed to be reliable and accurate, however, its accuracy and completeness cannot be guaranteed. Our firm, employees, and customers may effect transactions, including transactions contrary to any recommendation herein, or have positions in the securities mentioned herein or options with respect thereto. Any recommendation contained in this report may not be suitable for all investors and it is not to be deemed an offer or solicitation on our part with respect to the purchase or sale of any securities. |
|
 |
Financial and Tech Indexes Led Gainers
Kenneth J. Gruneisen - Passed the CAN SLIM® Master's Exam
Financial shares were a positive influence on the major averages as the Broker/Dealer Index ($XBD +0.91%) and the Bank Index ($BKX +1.22%) each posted a solid gain. The Networking Index ($NWX +2.46%) led the tech sector higher while the Biotechnology Index ($BTK +0.62%), Internet Index ($IIX +0.73%), and Semiconductor Index ($SOX +0.40%) posted smaller gains. The Healthcare Index ($HMO +0.75%) showed some strength. The Retail Index ($RLX -0.20%) edged lower while energy-related shares had a slightly positive bias as the Integrated Oil Index ($XOI +0.04%) and Oil Services Index ($OSX +0.33%) posted small gains. The Gold & Silver Index ($XAU -1.25%) gave up some of the prior session's big gain.
Charts courtesy www.stockcharts.com
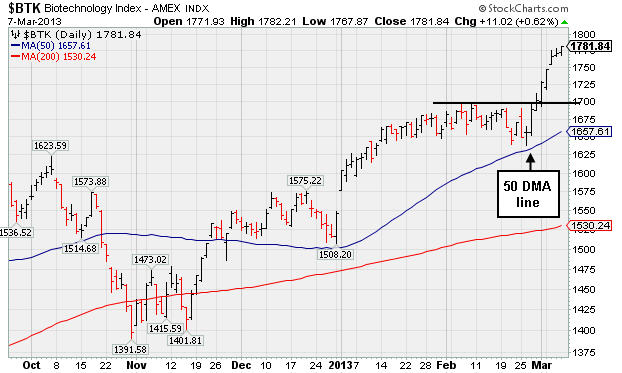
PICTURED: The Biotechnology Index ($BTK +0.62%) stayed above its 50-day moving average (DMA) line during the recent consolidation and sprinted to new highs with a streak of 8 consecutive gains.
| Oil Services |
$OSX |
242.54 |
+0.80 |
+0.33% |
+10.17% |
| Healthcare |
$HMO |
2,730.21 |
+20.36 |
+0.75% |
+8.59% |
| Integrated Oil |
$XOI |
1,347.54 |
+0.55 |
+0.04% |
+8.51% |
| Semiconductor |
$SOX |
434.68 |
+1.72 |
+0.40% |
+13.18% |
| Networking |
$NWX |
242.08 |
+5.82 |
+2.46% |
+6.85% |
| Internet |
$IIX |
368.27 |
+2.67 |
+0.73% |
+12.62% |
| Broker/Dealer |
$XBD |
109.50 |
+0.99 |
+0.91% |
+16.09% |
| Retail |
$RLX |
720.93 |
-1.42 |
-0.20% |
+10.39% |
| Gold & Silver |
$XAU |
132.61 |
-1.68 |
-1.25% |
-19.92% |
| Bank |
$BKX |
56.27 |
+0.68 |
+1.22% |
+9.73% |
| Biotech |
$BTK |
1,781.84 |
+11.02 |
+0.62% |
+15.18% |
|
|
|
 |
Secondary Offering May Hinder Progress Yet Attract Institutional Interest
Kenneth J. Gruneisen - Passed the CAN SLIM® Master's Exam
Often, when a leading stock is setting up to breakout of a solid base it is highlighted in CANSLIM.net's Mid-Day Breakouts Report. The most relevant factors are noted in the report which alerts prudent CANSLIM oriented investors to place the issue in their watch list. After doing any necessary backup research, the investor is prepared to act after the stock triggers a technical buy signal (breaks above its pivot point on more than +50% average turnover) but before it gets too extended from a sound base. In the event the stock fails to trigger a technical buy signal and its price declines then it will simply be removed from the watch list. Disciplined investors know to buy as near as possible to the pivot point and avoid chasing stocks after they have rallied more than +5% above their pivot point. It is crucial to always limit losses whenever any stock heads the wrong direction, and disciplined investors sell if a struggling stock ever falls more than -7% from their purchase price.
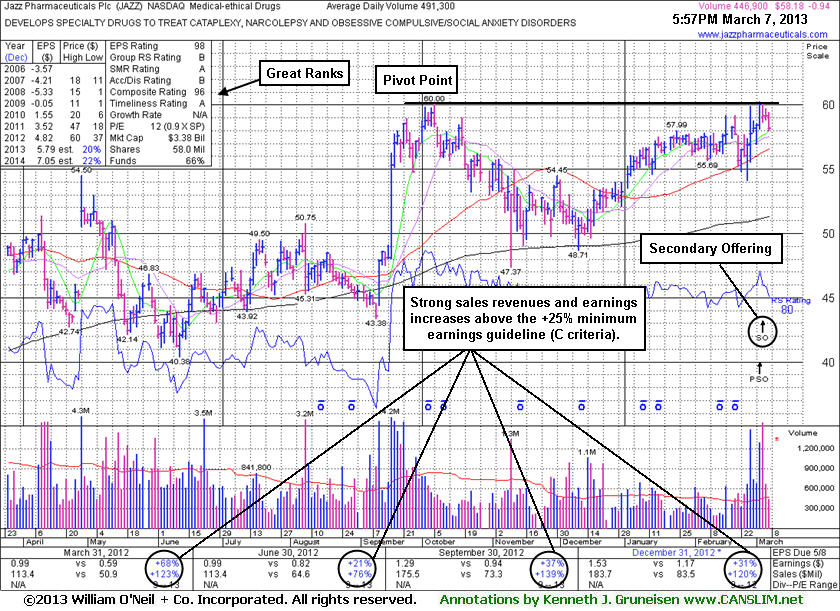
Jazz Pharmaceuticals Plc (JAZZ -$0.94 or -1.59% to $58.18) was highlighted in yellow with a pivot point cited based on its 10/05/12 high plus 10 cents in the 3/05/13 mid-day report (read here). Disciplined investors note that it has rallied near an area of previous resistance. Proof of fresh institutional buying demand is necessary to confirm a proper technical buy signal before taking action may be appropriate. It could spend more time basing, whereas a gain with at least +40% above average volume while rising above its pivot point may clinch a technical buy signal. The stock found support at its 200-day moving average (DMA) line in recent months and rebounded to its 52-week high before completing a Secondary Offering. Such offerings often are a short-term hindrance to upward price progress yet typically result in broader institutional ownership interest.
Fundamentals remain strong (C and A criteria) today with its strong sales and earnings increases continuing through the Dec '12 quarter. Based on technical weakness it was dropped from the Featured Stocks list back on 5/15/12 while enduring damaging distributional pressure shortly after its appearance in this FSU section on 4/27/12 with an annotated graph under the headline, "Four Times Average Volume While Rising From Double Bottom Base". It undercut its 200 DMA line and took months to rebound, yet when it blasted to new highs it made limited headway before again retreating to its 200 DMA line. It found support near that long-term average in a manner which indicates that the institutional crowd believes in the company. Its annual earnings (A criteria) history includes big FY '10, '11, and '12 earnings after a history of losses. The number of top-rated funds owning its shares rose from 351 in Mar '12 to 422 in Dec '12, a very reassuring sign concerning the I criteria. The Medical - Ethical Drugs group is currently showing good leadership (L criteria) while coming in with a B rating for its Group Relative Strength.
|
|
|
Color Codes Explained :
Y - Better candidates highlighted by our
staff of experts.
G - Previously featured
in past reports as yellow but may no longer be buyable under the
guidelines.
***Last / Change / Volume data in this table is the closing quote data***
Symbol/Exchange
Company Name
Industry Group |
PRICE |
CHANGE
(%Change) |
Day High |
Volume
(% DAV)
(% 50 day avg vol) |
52 Wk Hi
% From Hi |
Featured
Date |
Price
Featured |
Pivot Featured |
|
Max Buy |
CELG
-
NASDAQ
Celgene Corp
DRUGS - Drug Manufacturers - Major
|
$110.18
|
+0.15
0.14% |
$110.37
|
2,609,463
66.71% of 50 DAV
50 DAV is 3,911,700
|
$110.80
-0.56%
|
12/11/2012
|
$82.24
|
PP = $81.34
|
|
MB = $85.41
|
Most Recent Note - 3/5/2013 1:52:36 PM
G - Hitting new all-time highs yet again with today's gain, getting extended from any sound base. Recent lows in the $96 area define near-term support above its 50 DMA line.
>>> The latest Featured Stock Update with an annotated graph appeared on 2/28/2013. Click here.
View all notes |
Alert me of new notes |
CANSLIM.net Company Profile |
SEC |
Zacks Reports |
StockTalk |
News |
Chart |
Request a new note
C
A N
S L
I M


|
CFNL
-
NASDAQ
Cardinal Financial Corp
BANKING - Regional - Southeast Banks
|
$17.31
|
+0.35
2.06% |
$17.42
|
518,707
268.76% of 50 DAV
50 DAV is 193,000
|
$16.96
2.06%
|
3/7/2013
|
$17.27
|
PP = $16.77
|
|
MB = $17.61
|
 Most Recent Note - 3/7/2013 12:06:33 PM
Y - New pivot point is cited based upon its 2/15/13 high as it rises from a "double bottom" base. Volume is running at a higher above average pace today while on track for its 6th consecutive gain and hitting new 52-week highs. The prior session's gain had only +17% above average volume, however gains must be backed by at least +40% above average volume as a stock rises above its pivot point to trigger a proper technical buy signal under the fact-based system.
>>> The latest Featured Stock Update with an annotated graph appeared on 2/21/2013. Click here.
View all notes |
Alert me of new notes |
CANSLIM.net Company Profile |
SEC |
Zacks Reports |
StockTalk |
News |
Chart |
Request a new note
C
A N
S L
I M
|
CMCSA
-
NASDAQ
Comcast Corp Cl A
MEDIA - CATV Systems
|
$40.62
|
-0.23
-0.56% |
$40.99
|
6,673,825
48.04% of 50 DAV
50 DAV is 13,891,600
|
$42.00
-3.29%
|
12/3/2012
|
$37.08
|
PP = $38.06
|
|
MB = $39.96
|
Most Recent Note - 3/5/2013 1:41:04 PM
G - Volume totals have been cooling in the past week while consolidating above support at its 50 DMA line and still perched very near its 52-week high. Reported earnings +11% on +6% sales revenues for the Dec '12 quarter, below the +25% minimum earnings guideline (C criteria), raising fundamental concerns
>>> The latest Featured Stock Update with an annotated graph appeared on 2/19/2013. Click here.
View all notes |
Alert me of new notes |
CANSLIM.net Company Profile |
SEC |
Zacks Reports |
StockTalk |
News |
Chart |
Request a new note
C
A N
S L
I M
|
EVER
-
NYSE
Everbank Financial Corp
BANKING
|
$16.97
|
+0.26
1.56% |
$17.25
|
1,904,292
288.35% of 50 DAV
50 DAV is 660,400
|
$17.29
-1.85%
|
3/4/2013
|
$15.38
|
PP = $15.83
|
|
MB = $16.62
|
Most Recent Note - 3/7/2013 12:20:32 PM
G - Gapped up today, adding to its streak of 7 consecutive gains and getting extended from the prior base. Prior highs in the $16 area define initial chart support to watch on pullbacks. Disciplined investors avoid chasing stocks more than +5% above their pivot point and always limit losses by selling if any stock falls more than -7% from their purchase price.
>>> The latest Featured Stock Update with an annotated graph appeared on 3/4/2013. Click here.
View all notes |
Alert me of new notes |
CANSLIM.net Company Profile |
SEC |
Zacks Reports |
StockTalk |
News |
Chart |
Request a new note
C
A N
S L
I M
|
JAZZ
-
NASDAQ
Jazz Pharmaceuticals Plc
DRUGS - Biotechnology
|
$58.18
|
-0.94
-1.59% |
$59.44
|
448,914
91.37% of 50 DAV
50 DAV is 491,300
|
$60.25
-3.44%
|
3/5/2013
|
$59.10
|
PP = $60.10
|
|
MB = $63.11
|
Most Recent Note - 3/7/2013 7:05:01 PM
Y - Pulled back with light volume today. On 3/05/13 it completed a Secondary Offering and was highlighted in yellow with new pivot point cited based on its 10/05/12 high plus 10 cents in the mid-day report (read here). Volume-driven gains above the pivot point may trigger a technical buy signal. See the latest FSU analysis for more details and a new annotated graph.
>>> The latest Featured Stock Update with an annotated graph appeared on 3/7/2013. Click here.
View all notes |
Alert me of new notes |
CANSLIM.net Company Profile |
SEC |
Zacks Reports |
StockTalk |
News |
Chart |
Request a new note
C
A N
S L
I M
|
Symbol/Exchange
Company Name
Industry Group |
PRICE |
CHANGE
(%Change) |
Day High |
Volume
(% DAV)
(% 50 day avg vol) |
52 Wk Hi
% From Hi |
Featured
Date |
Price
Featured |
Pivot Featured |
|
Max Buy |
KORS
-
NYSE
Michael Kors Hldgs Ltd
RETAIL - Apparel Stores
|
$58.21
|
-2.98
-4.87% |
$61.33
|
7,995,914
144.26% of 50 DAV
50 DAV is 5,542,800
|
$65.10
-10.58%
|
1/23/2013
|
$54.98
|
PP = $58.72
|
|
MB = $61.66
|
Most Recent Note - 3/7/2013 2:08:46 PM
Y - Color code is changed to yellow while consolidating below its "max buy" level and above prior highs in the $58 area which define important support above its 50 DMA line (now $56.33). Completed another Secondary Offering 2/20/13 while perched near its all-time high.
>>> The latest Featured Stock Update with an annotated graph appeared on 2/7/2013. Click here.
View all notes |
Alert me of new notes |
CANSLIM.net Company Profile |
SEC |
Zacks Reports |
StockTalk |
News |
Chart |
Request a new note
C
A N
S L
I M
|
LNKD
-
NYSE
Linkedin Corp Class A
INTERNET - Internet Information Providers
|
$175.36
|
+1.71
0.98% |
$175.74
|
1,533,275
64.66% of 50 DAV
50 DAV is 2,371,300
|
$179.35
-2.22%
|
2/8/2013
|
$147.04
|
PP = $127.55
|
|
MB = $133.93
|
Most Recent Note - 3/4/2013 3:51:00 PM
G - Considerable volume-driven gain today for yet another new all-time high, getting very extended from any sound base. Previously noted - "Disciplined investors may watch for secondary buy points or additional bases to possibly form and be noted in the weeks ahead."
>>> The latest Featured Stock Update with an annotated graph appeared on 2/8/2013. Click here.
View all notes |
Alert me of new notes |
CANSLIM.net Company Profile |
SEC |
Zacks Reports |
StockTalk |
News |
Chart |
Request a new note
C
A N
S L
I M
|
LOPE
-
NASDAQ
Grand Canyon Education
DIVERSIFIED SERVICES - Education and; Training Services
|
$23.73
|
-0.02
-0.08% |
$23.81
|
364,632
77.93% of 50 DAV
50 DAV is 467,900
|
$27.18
-12.69%
|
2/20/2013
|
$26.44
|
PP = $25.10
|
|
MB = $26.36
|
Most Recent Note - 3/5/2013 6:39:20 PM
G - Rebounded near its 50 DMA line with today's gain on lighter (near average) volume. That short-term average may now act as resistance. It quickly negated its recent technical breakout.
>>> The latest Featured Stock Update with an annotated graph appeared on 2/20/2013. Click here.
View all notes |
Alert me of new notes |
CANSLIM.net Company Profile |
SEC |
Zacks Reports |
StockTalk |
News |
Chart |
Request a new note
C
A N
S L
I M
|
MIDD
-
NASDAQ
Middleby Corp
MANUFACTURING - Diversified Machinery
|
$148.82
|
-0.89
-0.59% |
$150.20
|
57,495
62.49% of 50 DAV
50 DAV is 92,000
|
$154.74
-3.83%
|
10/8/2012
|
$118.46
|
PP = $122.67
|
|
MB = $128.80
|
Most Recent Note - 3/5/2013 1:44:24 PM
G - Hovering near all-time highs today. Fundamental concerns were recently noted and prior reports cautioned members that it is extended from any sound base. Its 50 DMA line defines important near-term chart support above prior highs in the $134-135 area.
>>> The latest Featured Stock Update with an annotated graph appeared on 2/25/2013. Click here.
View all notes |
Alert me of new notes |
CANSLIM.net Company Profile |
SEC |
Zacks Reports |
StockTalk |
News |
Chart |
Request a new note
C
A N
S L
I M
|
MWIV
-
NASDAQ
M W I Veterinary Supply
HEALTH SERVICES - Medical Instruments and; Supplies
|
$134.88
|
-1.41
-1.03% |
$137.10
|
109,684
205.79% of 50 DAV
50 DAV is 53,300
|
$137.18
-1.68%
|
3/4/2013
|
$130.90
|
PP = $129.45
|
|
MB = $135.92
|
Most Recent Note - 3/6/2013 6:35:22 PM
G - Color code is changed to green after rallying beyond its "max buy" level with another volume-driven gain. See the latest FSU analysis for more details and a new annotated graph.
>>> The latest Featured Stock Update with an annotated graph appeared on 3/6/2013. Click here.
View all notes |
Alert me of new notes |
CANSLIM.net Company Profile |
SEC |
Zacks Reports |
StockTalk |
News |
Chart |
Request a new note
C
A N
S L
I M
|
Symbol/Exchange
Company Name
Industry Group |
PRICE |
CHANGE
(%Change) |
Day High |
Volume
(% DAV)
(% 50 day avg vol) |
52 Wk Hi
% From Hi |
Featured
Date |
Price
Featured |
Pivot Featured |
|
Max Buy |
N
-
NYSE
Netsuite Inc
DIVERSIFIED SERVICES - Business/Management Services
|
$74.68
|
-0.05
-0.07% |
$74.98
|
255,930
74.77% of 50 DAV
50 DAV is 342,300
|
$75.75
-1.41%
|
12/12/2012
|
$64.75
|
PP = $67.12
|
|
MB = $70.48
|
Most Recent Note - 3/4/2013 12:36:15 PM
G - Challenging its 52-week and all-time high with today's 5th consecutive volume-driven gain. See the latest FSU analysis for more details and a new annotated graph.
>>> The latest Featured Stock Update with an annotated graph appeared on 3/1/2013. Click here.
View all notes |
Alert me of new notes |
CANSLIM.net Company Profile |
SEC |
Zacks Reports |
StockTalk |
News |
Chart |
Request a new note
C
A N
S L
I M
|
NSR
-
NYSE
Neustar Inc
TELECOMMUNICATIONS - Diversified Communication Serv
|
$44.83
|
+0.36
0.81% |
$44.96
|
413,169
91.17% of 50 DAV
50 DAV is 453,200
|
$47.24
-5.10%
|
12/11/2012
|
$41.85
|
PP = $41.41
|
|
MB = $43.48
|
Most Recent Note - 3/1/2013 4:02:14 PM
G - Holding is ground just below its 50 DMA line today but enduring more distributional pressure. The damaging loss on 2/21/13 with heavy volume raised concerns and triggered a technical sell signal.
>>> The latest Featured Stock Update with an annotated graph appeared on 2/27/2013. Click here.
View all notes |
Alert me of new notes |
CANSLIM.net Company Profile |
SEC |
Zacks Reports |
StockTalk |
News |
Chart |
Request a new note
C
A N
S L
I M
|
QIHU
-
NYSE
Qihoo 360 Technology Ads
INTERNET - Internet Service Providers
|
$31.97
|
-0.22
-0.68% |
$32.46
|
2,352,523
93.94% of 50 DAV
50 DAV is 2,504,200
|
$34.90
-8.40%
|
3/5/2013
|
$34.63
|
PP = $34.47
|
|
MB = $36.19
|
Most Recent Note - 3/6/2013 11:16:26 AM
G - Gapped down today after reporting earnings +10% on +65% sales revenues for the Dec '12 quarter, below the +25% minimum earnings guideline (C criteria) raising fundamental concerns. Color code is changed to green based the sub par results and the abrupt reversal from its new 52-week high hit on the prior session. Prior mid-day reports cautioned - "Deceleration in its sales revenues and earnings growth rate in sequential quarterly comparisons through Sep '12 is cause for concern. Faces additional overhead supply up through the $36 area. Found support at its 200 DMA line in recent weeks This Chinese Computer Software - Security firm's quarterly earnings (C criteria) and sales revenues increases have been strong." See the latest FSU analysis for more details and a new annotated graph under the headline, "Earnings Below Guideline Raised Concerns After Technical Breakout".
>>> The latest Featured Stock Update with an annotated graph appeared on 3/5/2013. Click here.
View all notes |
Alert me of new notes |
CANSLIM.net Company Profile |
SEC |
Zacks Reports |
StockTalk |
News |
Chart |
Request a new note
C
A N
S L
I M
|
SFUN
-
NYSE
Soufun Hldgs Ltd Ads A
INTERNET - Internet Information Providers
|
$25.77
|
+0.69
2.75% |
$25.87
|
344,677
98.17% of 50 DAV
50 DAV is 351,100
|
$29.16
-11.63%
|
2/11/2013
|
$27.46
|
PP = $29.26
|
|
MB = $30.72
|
Most Recent Note - 3/5/2013 1:39:04 PM
G - Rebounding with a solid gain today, however it remains below its 50 DMA line which may now act as resistance. It did not trigger any recent technical buy signal.
>>> The latest Featured Stock Update with an annotated graph appeared on 2/11/2013. Click here.
View all notes |
Alert me of new notes |
CANSLIM.net Company Profile |
SEC |
Zacks Reports |
StockTalk |
News |
Chart |
Request a new note
C
A N
S L
I M
|
SLCA
-
NYSE
U S Silica Holdings Inc
CHEMICALS - Specialty Chemicals
|
$25.65
|
+0.08
0.31% |
$26.99
|
715,402
142.45% of 50 DAV
50 DAV is 502,200
|
$26.41
-2.88%
|
2/26/2013
|
$22.23
|
PP = $21.50
|
|
MB = $22.58
|
Most Recent Note - 3/7/2013 10:44:07 AM
G - Adding to its spurt of volume-driven gains and hitting a new 52-week high today, getting extended from its prior base. Prior highs define initial support to watch on pullbacks.
>>> The latest Featured Stock Update with an annotated graph appeared on 2/26/2013. Click here.
View all notes |
Alert me of new notes |
CANSLIM.net Company Profile |
SEC |
Zacks Reports |
StockTalk |
News |
Chart |
Request a new note
C
A N
S L
I M
|
Symbol/Exchange
Company Name
Industry Group |
PRICE |
CHANGE
(%Change) |
Day High |
Volume
(% DAV)
(% 50 day avg vol) |
52 Wk Hi
% From Hi |
Featured
Date |
Price
Featured |
Pivot Featured |
|
Max Buy |
VRX
-
NYSE
Valeant Pharmaceuticals
DRUGS - Drug Manufacturers - Other
|
$69.84
|
+1.32
1.93% |
$69.87
|
1,151,356
87.28% of 50 DAV
50 DAV is 1,319,100
|
$70.25
-0.58%
|
12/20/2012
|
$60.24
|
PP = $61.21
|
|
MB = $64.27
|
Most Recent Note - 3/5/2013 1:50:31 PM
Y - Hitting another new 52-week high with today's 5th consecutive gain. A valid secondary buy point exists following the successful test of support at its 10-week moving average up to as high as +5% above the recent high ($67.98 plus 5% or $71.38). Color code is changed to yellow however no new pivot point is cited since a new base was not formed. The 50 DMA line and recent low ($64.05 on 2/21/13) define the next important support area to watch.
>>> The latest Featured Stock Update with an annotated graph appeared on 2/15/2013. Click here.
View all notes |
Alert me of new notes |
CANSLIM.net Company Profile |
SEC |
Zacks Reports |
StockTalk |
News |
Chart |
Request a new note
C
A N
S L
I M
|
|
|
|
THESE ARE NOT BUY RECOMMENDATIONS!
Comments contained in the body of this report are technical
opinions only. The material herein has been obtained
from sources believed to be reliable and accurate, however,
its accuracy and completeness cannot be guaranteed.
This site is not an investment advisor, hence it does
not endorse or recommend any securities or other investments.
Any recommendation contained in this report may not
be suitable for all investors and it is not to be deemed
an offer or solicitation on our part with respect to
the purchase or sale of any securities. All trademarks,
service marks and trade names appearing in this report
are the property of their respective owners, and are
likewise used for identification purposes only.
This report is a service available
only to active Paid Premium Members.
You may opt-out of receiving report notifications
at any time. Questions or comments may be submitted
by writing to Premium Membership Services 665 S.E. 10 Street, Suite 201 Deerfield Beach, FL 33441-5634 or by calling 1-800-965-8307
or 954-785-1121.
|
|
|

