***Last / Change / Volume data in this table is the closing quote data***
Symbol/Exchange
Company Name
Industry Group |
PRICE |
CHANGE
(%Change) |
Day High |
Volume
(% DAV)
(% 50 day avg vol) |
52 Wk Hi
% From Hi |
Featured
Date |
Price
Featured |
Pivot Featured |
|
Max Buy |
BIDU
-
NASDAQ
Baidu Inc Ads
INTERNET - Internet Information Providers
|
$120.18
|
-2.16
-1.77% |
$123.23
|
5,143,434
77.73% of 50 DAV
50 DAV is 6,616,700
|
$131.63
-8.70%
|
2/1/2011
|
$117.74
|
PP = $112.08
|
|
MB = $117.68
|
Most Recent Note - 3/3/2011 4:23:57 PM
G - Recent gains have been backed by below average volume. Its 50 DMA line and 2/23/11 low define important chart support levels to watch.
>>> The latest Featured Stock Update with an annotated graph appeared on 2/2/2011. Click here.
View all notes |
Alert me of new notes |
CANSLIM.net Company Profile |
SEC |
Zacks Reports |
StockTalk |
News |
Chart |
Request a new note
C
A N
S L
I M


|
CMG
-
NYSE
Chipotle Mexican Grill
LEISURE - Restaurants
|
$252.56
|
-2.44
-0.96% |
$258.64
|
1,080,506
104.19% of 50 DAV
50 DAV is 1,037,100
|
$275.00
-8.16%
|
2/11/2011
|
$271.15
|
PP = $262.87
|
|
MB = $276.01
|
Most Recent Note - 3/4/2011 4:10:13 PM
G - Up for a 3rd consecutive gain since finding support at its 50 DMA line and prior highs in the $237 area. A violation and damaging loss would raise greater concerns and trigger a technical sell signal.
>>> The latest Featured Stock Update with an annotated graph appeared on 2/11/2011. Click here.
View all notes |
Alert me of new notes |
CANSLIM.net Company Profile |
SEC |
Zacks Reports |
StockTalk |
News |
Chart |
Request a new note
C
A N
S L
I M
|
CRUS
-
NASDAQ
Cirrus Logic Inc
ELECTRONICS - Semiconductor - Specialized
|
$23.12
|
-1.44
-5.86% |
$24.64
|
4,580,140
132.44% of 50 DAV
50 DAV is 3,458,300
|
$25.48
-9.26%
|
1/28/2011
|
$20.69
|
PP = $19.17
|
|
MB = $20.13
|
 Most Recent Note - 3/7/2011 5:21:23 PM
G - Today it led the 30 Semiconductor Index components lower with a loss on higher volume. Recently found support above prior chart resistance. Its recent low (2/23/11 low $21.17) and much earlier high close ($20.54 on 7/26/10) define chart support to watch along with its 50 DMA line.
>>> The latest Featured Stock Update with an annotated graph appeared on 3/4/2011. Click here.
View all notes |
Alert me of new notes |
CANSLIM.net Company Profile |
SEC |
Zacks Reports |
StockTalk |
News |
Chart |
Request a new note
C
A N
S L
I M
|
CTSH
-
NASDAQ
Cognizant Tech Sol Cl A
COMPUTER SOFTWARE and SERVICES - Business Software and Services
|
$75.91
|
-0.41
-0.54% |
$76.81
|
2,364,043
108.27% of 50 DAV
50 DAV is 2,183,400
|
$77.74
-2.35%
|
2/7/2011
|
$75.09
|
PP = $76.46
|
|
MB = $80.28
|
Most Recent Note - 3/3/2011 4:03:37 PM
Y - Up today on lighter volume, rising from support at its 50 DMA line. No overhead supply remains to hinder its progress. It stalled after its 2/08/11 breakout with bare minimum volume. Subsequent confirming gains for new highs with above average volume would be a welcome reassurance of institutional accumulation.
>>> The latest Featured Stock Update with an annotated graph appeared on 2/8/2011. Click here.
View all notes |
Alert me of new notes |
CANSLIM.net Company Profile |
SEC |
Zacks Reports |
StockTalk |
News |
Chart |
Request a new note
C
A N
S L
I M
|
DECK
-
NASDAQ
Deckers Outdoor Corp
CONSUMER NON-DURABLES - Textile - Apparel Footwear
|
$87.42
|
+0.24
0.28% |
$90.21
|
1,776,104
109.27% of 50 DAV
50 DAV is 1,625,400
|
$94.70
-7.69%
|
2/3/2011
|
$79.61
|
PP = $82.67
|
|
MB = $86.80
|
Most Recent Note - 3/3/2011 4:44:18 PM
G - Posted 2 consecutive gains on light or near average volume after recent losses on above average volume. Churning above average volume action without meaningful price progress has been noted as indicative of distributional pressure following its 2/17/11 technical breakout. Support to watch is at its pivot point and 50 DMA line (now $81.68).
>>> The latest Featured Stock Update with an annotated graph appeared on 3/3/2011. Click here.
View all notes |
Alert me of new notes |
CANSLIM.net Company Profile |
SEC |
Zacks Reports |
StockTalk |
News |
Chart |
Request a new note
C
A N
S L
I M
|
Symbol/Exchange
Company Name
Industry Group |
PRICE |
CHANGE
(%Change) |
Day High |
Volume
(% DAV)
(% 50 day avg vol) |
52 Wk Hi
% From Hi |
Featured
Date |
Price
Featured |
Pivot Featured |
|
Max Buy |
EBIX
-
NASDAQ
Ebix Inc
COMPUTER SOFTWARE and SERVICES - Business Software and Services
|
$28.59
|
-0.31
-1.07% |
$29.49
|
960,014
181.37% of 50 DAV
50 DAV is 529,300
|
$29.61
-3.44%
|
2/28/2011
|
$25.70
|
PP = $25.97
|
|
MB = $27.27
|
Most Recent Note - 3/7/2011 12:23:45 PM
G - Pulling back from its 52-week high today. Color code was changed to green after getting extended beyond the "max buy" level +5% above the pivot point recently cited. Prior highs in the $25-26 area define initial support to watch above its 50 DMA line.
>>> The latest Featured Stock Update with an annotated graph appeared on 2/28/2011. Click here.
View all notes |
Alert me of new notes |
CANSLIM.net Company Profile |
SEC |
Zacks Reports |
StockTalk |
News |
Chart |
Request a new note
C
A N
S L
I M
|
EZCH
-
NASDAQ
Ezchip Semiconductor Ltd
ELECTRONICS - Semiconductor - Specialized
|
$29.61
|
-0.61
-2.02% |
$30.40
|
244,991
64.18% of 50 DAV
50 DAV is 381,700
|
$33.48
-11.56%
|
12/2/2010
|
$27.53
|
PP = $26.00
|
|
MB = $27.30
|
Most Recent Note - 3/7/2011 5:47:29 PM
G - Pulling back after its 50 DMA line recently acted as resistance while volume totals have cooled. A convincing rebound above its short-term average would help its outlook, meanwhile it faces overhead supply up through the $33 area which may hinder its ability to rally.
>>> The latest Featured Stock Update with an annotated graph appeared on 3/1/2011. Click here.
View all notes |
Alert me of new notes |
CANSLIM.net Company Profile |
SEC |
Zacks Reports |
StockTalk |
News |
Chart |
Request a new note
C
A N
S L
I M
|
EZPW
-
NASDAQ
Ezcorp Inc Cl A
SPECIALTY RETAIL - Specialty Retail, Other
|
$28.43
|
-0.53
-1.83% |
$29.19
|
207,491
55.64% of 50 DAV
50 DAV is 372,900
|
$29.94
-5.04%
|
2/18/2011
|
$27.94
|
PP = $30.04
|
|
MB = $31.54
|
Most Recent Note - 3/7/2011 5:46:05 PM
Y - Down on light volume today, finishing -5.0% off its 52-week high. Consolidating just above its 50 DMA line showing resilience. Subsequent gains with heavy volume above its pivot point may trigger a new (or add-on) technical buy signal. Recent low ($25.56 on 1/25/11) defines an important support level now.
>>> The latest Featured Stock Update with an annotated graph appeared on 2/3/2011. Click here.
View all notes |
Alert me of new notes |
CANSLIM.net Company Profile |
SEC |
Zacks Reports |
StockTalk |
News |
Chart |
Request a new note
C
A N
S L
I M
|
FOSL
-
NASDAQ
Fossil Inc
CONSUMER DURABLES - Recreational Goods, Other
|
$83.05
|
+2.22
2.75% |
$83.39
|
1,878,501
221.13% of 50 DAV
50 DAV is 849,500
|
$83.68
-0.75%
|
2/1/2011
|
$73.30
|
PP = $74.44
|
|
MB = $78.16
|
Most Recent Note - 3/7/2011 12:25:43 PM
G - Perched -3.6% off its all-time high today, extended from its prior base. It found support at its 50 DMA line while consolidating above prior resistance in the $74 area.
>>> The latest Featured Stock Update with an annotated graph appeared on 2/24/2011. Click here.
View all notes |
Alert me of new notes |
CANSLIM.net Company Profile |
SEC |
Zacks Reports |
StockTalk |
News |
Chart |
Request a new note
C
A N
S L
I M
|
GSIT
-
NASDAQ
G S I Technology Inc
ELECTRONICS - Semiconductor - Broad Line
|
$9.00
|
-0.61
-6.35% |
$9.63
|
210,531
87.79% of 50 DAV
50 DAV is 239,800
|
$10.20
-11.76%
|
2/18/2011
|
$10.08
|
PP = $10.25
|
|
MB = $10.76
|
Most Recent Note - 3/7/2011 5:19:04 PM
G - Violated and closed below its 50 DMA line today, raising concerns while slumping near prior lows in the $8.60-8.80 range that define important chart support. A rally and strong close above its 2/18/11 close ($9.78) would help its outlook following its damaging 2/22/11 gap down.
>>> The latest Featured Stock Update with an annotated graph appeared on 2/18/2011. Click here.
View all notes |
Alert me of new notes |
CANSLIM.net Company Profile |
SEC |
Zacks Reports |
StockTalk |
News |
Chart |
Request a new note
C
A N
S L
I M
|
Symbol/Exchange
Company Name
Industry Group |
PRICE |
CHANGE
(%Change) |
Day High |
Volume
(% DAV)
(% 50 day avg vol) |
52 Wk Hi
% From Hi |
Featured
Date |
Price
Featured |
Pivot Featured |
|
Max Buy |
HMSY
-
NASDAQ
H M S Holdings Corp
COMPUTER SOFTWARE and SERVICES - Healthcare Information Service
|
$79.00
|
-0.13
-0.16% |
$79.99
|
281,832
176.81% of 50 DAV
50 DAV is 159,400
|
$79.78
-0.98%
|
11/19/2010
|
$61.89
|
PP = $63.01
|
|
MB = $66.16
|
Most Recent Note - 3/7/2011 12:26:50 PM
G - Perched at its all-time high today after 21 gains in the past 23 sessions, extended from any sound base pattern. Support to watch is defined by prior chart highs and its 50 DMA line in the $67 area.
>>> The latest Featured Stock Update with an annotated graph appeared on 2/16/2011. Click here.
View all notes |
Alert me of new notes |
CANSLIM.net Company Profile |
SEC |
Zacks Reports |
StockTalk |
News |
Chart |
Request a new note
C
A N
S L
I M
|
JOBS
-
NASDAQ
Fifty One Job Inc Ads
DIVERSIFIED SERVICES - Staffing and; Outsourcing Service
|
$57.72
|
-2.64
-4.37% |
$60.40
|
290,575
235.28% of 50 DAV
50 DAV is 123,500
|
$64.55
-10.58%
|
2/7/2011
|
$59.23
|
PP = $61.38
|
|
MB = $64.45
|
Most Recent Note - 3/7/2011 5:27:54 PM
G - Loss today with higher volume was indicative of distributional pressure and its color code is changed to green. Recently churned above average volume and stalled near its pivot point noted nearly a month ago. Gains for new highs with well above average volume would be a reassuring sign of accumulation by institutional investors, meanwhile its recent low ($52.58 on 1/28/11) defines support below its 50 DMA line where violations would trigger technical sell signals.
>>> The latest Featured Stock Update with an annotated graph appeared on 2/7/2011. Click here.
View all notes |
Alert me of new notes |
CANSLIM.net Company Profile |
SEC |
Zacks Reports |
StockTalk |
News |
Chart |
Request a new note
C
A N
S L
I M
|
LULU
-
NASDAQ
Lululemon Athletica
MANUFACTURING - Textile Manufacturing
|
$75.18
|
-2.08
-2.69% |
$78.60
|
1,886,049
96.61% of 50 DAV
50 DAV is 1,952,200
|
$85.28
-11.84%
|
1/26/2011
|
$68.11
|
PP = $74.70
|
|
MB = $78.44
|
Most Recent Note - 3/7/2011 5:43:07 PM
Y - Loss today has it testing support at its 50 DMA line again. A violation of that important short-term average may trigger a technical sell signal. A close below a significant prior high close ($73.51 on 12/21/10) would completely negate its latest breakout, raising more serious concerns.
>>> The latest Featured Stock Update with an annotated graph appeared on 2/25/2011. Click here.
View all notes |
Alert me of new notes |
CANSLIM.net Company Profile |
SEC |
Zacks Reports |
StockTalk |
News |
Chart |
Request a new note
C
A N
S L
I M
|
MWIV
-
NASDAQ
M W I Veterinary Supply
HEALTH SERVICES - Medical Instruments and; Supplies
|
$73.17
|
+1.59
2.22% |
$73.50
|
150,924
208.17% of 50 DAV
50 DAV is 72,500
|
$72.27
1.25%
|
11/4/2010
|
$61.79
|
PP = $59.60
|
|
MB = $62.58
|
Most Recent Note - 3/7/2011 5:44:12 PM
G - Up today with above above average volume for a new all-time high. Found support near prior highs and its 50 DMA line recently but did not build a sound new base pattern.
>>> The latest Featured Stock Update with an annotated graph appeared on 2/2/2011. Click here.
View all notes |
Alert me of new notes |
CANSLIM.net Company Profile |
SEC |
Zacks Reports |
StockTalk |
News |
Chart |
Request a new note
C
A N
S L
I M
|
OPEN
-
NASDAQ
Opentable Inc
INTERNET - Internet Software and Services
|
$86.58
|
-3.41
-3.79% |
$90.48
|
1,081,735
104.54% of 50 DAV
50 DAV is 1,034,800
|
$95.97
-9.78%
|
1/5/2011
|
$74.05
|
PP = $76.79
|
|
MB = $80.63
|
Most Recent Note - 3/7/2011 10:59:27 AM
G - Consolidating above prior resistance near $82 and above its 50 DMA line. Its brief consolidation of about 4 weeks has the look of a bullish base-on-base type pattern forming, but a proper "flat base" should be a minimum of 5 weeks in length.
>>> The latest Featured Stock Update with an annotated graph appeared on 2/15/2011. Click here.
View all notes |
Alert me of new notes |
CANSLIM.net Company Profile |
SEC |
Zacks Reports |
StockTalk |
News |
Chart |
Request a new note
C
A N
S L
I M
|
Symbol/Exchange
Company Name
Industry Group |
PRICE |
CHANGE
(%Change) |
Day High |
Volume
(% DAV)
(% 50 day avg vol) |
52 Wk Hi
% From Hi |
Featured
Date |
Price
Featured |
Pivot Featured |
|
Max Buy |
ORCL
-
NASDAQ
Oracle Corp
COMPUTER SOFTWARE and SERVICES - Application Software
|
$32.10
|
-0.67
-2.03% |
$33.06
|
20,547,257
88.21% of 50 DAV
50 DAV is 23,294,200
|
$33.71
-4.78%
|
1/20/2011
|
$32.31
|
PP = $32.37
|
|
MB = $33.99
|
Most Recent Note - 3/7/2011 5:41:39 PM
Y - Loss today on light volume led to a close below its 50 DMA line again. Its prior low previously noted ($30.80 on 1/10/11) defines the next important chart support level to watch.
>>> The latest Featured Stock Update with an annotated graph appeared on 2/22/2011. Click here.
View all notes |
Alert me of new notes |
CANSLIM.net Company Profile |
SEC |
Zacks Reports |
StockTalk |
News |
Chart |
Request a new note
C
A N
S L
I M
|
PAY
-
NYSE
Verifone Systems Inc
COMPUTER HARDWARE - Transaction Automation Systems
|
$48.91
|
-1.00
-2.00% |
$50.15
|
2,088,640
129.13% of 50 DAV
50 DAV is 1,617,500
|
$50.17
-2.51%
|
1/27/2011
|
$41.77
|
PP = $44.97
|
|
MB = $47.22
|
Most Recent Note - 3/7/2011 5:48:48 PM
G - Hovering at its 52-week and all-time highs today, pausing after 3 consecutive gains with above average volume. No resistance remains due to overhead supply, but it is extended from a sound base pattern.
>>> The latest Featured Stock Update with an annotated graph appeared on 3/2/2011. Click here.
View all notes |
Alert me of new notes |
CANSLIM.net Company Profile |
SEC |
Zacks Reports |
StockTalk |
News |
Chart |
Request a new note
C
A N
S L
I M
|
PCLN
-
NASDAQ
Priceline.Com Inc
INTERNET - Internet Software and Services
|
$466.69
|
-2.44
-0.52% |
$474.74
|
1,449,990
131.55% of 50 DAV
50 DAV is 1,102,200
|
$469.74
-0.65%
|
1/3/2011
|
$399.55
|
PP = $428.20
|
|
MB = $449.61
|
Most Recent Note - 3/7/2011 5:50:08 PM
G - Paused today after 3 consecutive gains with above average volume hitting new 52-week highs. It is extended from a sound base, and found impressive support near its 50 DMA line in recent months .
>>> The latest Featured Stock Update with an annotated graph appeared on 2/14/2011. Click here.
View all notes |
Alert me of new notes |
CANSLIM.net Company Profile |
SEC |
Zacks Reports |
StockTalk |
News |
Chart |
Request a new note
C
A N
S L
I M
|
RAX
-
NYSE
Rackspace Hosting Inc
INTERNET - Internet Software and; Services
|
$36.75
|
-1.03
-2.73% |
$37.74
|
2,231,154
125.15% of 50 DAV
50 DAV is 1,782,800
|
$40.62
-9.53%
|
1/10/2011
|
$22.84
|
PP = $32.76
|
|
MB = $34.40
|
Most Recent Note - 3/7/2011 10:53:14 AM
G - Down today, slumping -10% off its all-time high. Consolidating just above prior highs near $35 previously noted as defining support to watch above its 50 DMA line.
>>> The latest Featured Stock Update with an annotated graph appeared on 2/9/2011. Click here.
View all notes |
Alert me of new notes |
CANSLIM.net Company Profile |
SEC |
Zacks Reports |
StockTalk |
News |
Chart |
Request a new note
C
A N
S L
I M
|
TIBX
-
NASDAQ
Tibco Software Inc
COMPUTER SOFTWARE and SERVICES - Business Software and Services
|
$24.10
|
-1.03
-4.08% |
$25.39
|
2,026,757
76.23% of 50 DAV
50 DAV is 2,658,600
|
$25.94
-7.09%
|
2/1/2011
|
$24.35
|
PP = $22.18
|
|
MB = $23.29
|
Most Recent Note - 3/7/2011 5:30:27 PM
G - Pulling back today with below average volume, finishing -7.1% off its 52-week high. Recently found support above prior highs in the $22 area and well above its 50 DMA line.
>>> The latest Featured Stock Update with an annotated graph appeared on 2/10/2011. Click here.
View all notes |
Alert me of new notes |
CANSLIM.net Company Profile |
SEC |
Zacks Reports |
StockTalk |
News |
Chart |
Request a new note
C
A N
S L
I M
|
Symbol/Exchange
Company Name
Industry Group |
PRICE |
CHANGE
(%Change) |
Day High |
Volume
(% DAV)
(% 50 day avg vol) |
52 Wk Hi
% From Hi |
Featured
Date |
Price
Featured |
Pivot Featured |
|
Max Buy |
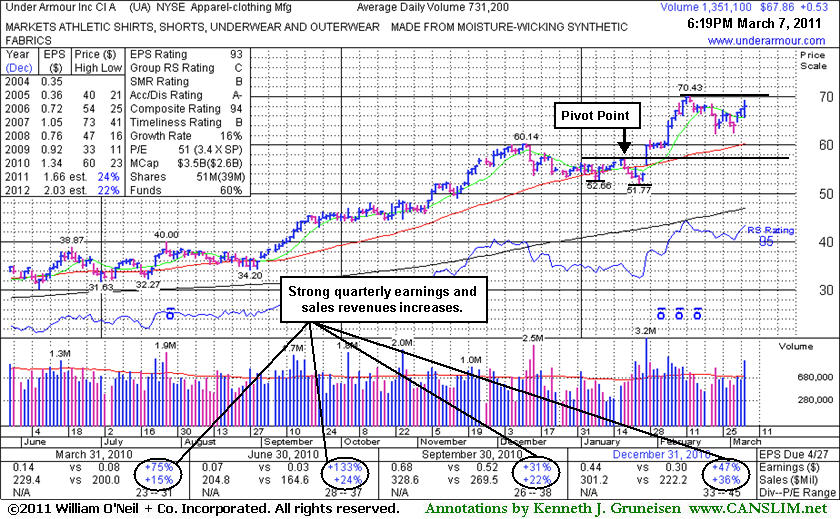
UA
-
NYSE
Under Armour Inc Cl A
CONSUMER NON-DURABLES - Textile - Apparel Clothing
|
$67.86
|
+0.53
0.79% |
$67.48
|
1,357,045
185.59% of 50 DAV
50 DAV is 731,200
|
$70.43
-3.65%
|
1/27/2011
|
$58.31
|
PP = $56.99
|
|
MB = $59.84
|
Most Recent Note - 3/7/2011 5:34:46 PM
G - Solid gain with above average volume today. Prior resistance and its 50 DMA line in the $60 area define chart support to watch. Its brief consolidation has been healthy, but it needs more time to potentially form a sound base-on-base type pattern.
>>> The latest Featured Stock Update with an annotated graph appeared on 3/7/2011. Click here.
View all notes |
Alert me of new notes |
CANSLIM.net Company Profile |
SEC |
Zacks Reports |
StockTalk |
News |
Chart |
Request a new note
C
A N
S L
I M
|
ULTA
-
NASDAQ
Ulta Salon Cosm & Frag
SPECIALTY RETAIL - Specialty Retail, Other
|
$41.27
|
-0.71
-1.69% |
$42.22
|
707,111
148.71% of 50 DAV
50 DAV is 475,500
|
$44.06
-6.33%
|
1/6/2011
|
$36.12
|
PP = $37.34
|
|
MB = $39.21
|
Most Recent Note - 3/7/2011 5:40:25 PM
G - Loss on higher volume today, finishing -6.3% off its all-time high. Its Up/Down Volume Ratio of 1.7 is a sign of accumulation, but it has not built a sound new base pattern. Prior highs in the $37-38 area define chart support to watch above its 50 DMA line.
>>> The latest Featured Stock Update with an annotated graph appeared on 2/17/2011. Click here.
View all notes |
Alert me of new notes |
CANSLIM.net Company Profile |
SEC |
Zacks Reports |
StockTalk |
News |
Chart |
Request a new note
C
A N
S L
I M
|