You are not logged in.
This means you
CAN ONLY VIEW reports that were published prior to Monday, April 14, 2025.
You
MUST UPGRADE YOUR MEMBERSHIP if you want to see any current reports.
AFTER MARKET UPDATE - WEDNESDAY, MARCH 6TH, 2013
Previous After Market Report Next After Market Report >>>
|
|
|
|
DOW |
+42.47 |
14,296.24 |
+0.30% |
|
Volume |
683,887,150 |
+0% |
|
Volume |
1,704,727,810 |
-7% |
|
NASDAQ |
-1.76 |
3,222.37 |
-0.05% |
|
Advancers |
1,665 |
53% |
|
Advancers |
1,357 |
53% |
|
S&P 500 |
+1.67 |
1,541.46 |
+0.11% |
|
Decliners |
1,328 |
43% |
|
Decliners |
1,100 |
43% |
|
Russell 2000 |
+2.56 |
929.96 |
+0.28% |
|
52 Wk Highs |
327 |
|
|
52 Wk Highs |
203 |
|
|
S&P 600 |
+1.75 |
519.05 |
+0.34% |
|
52 Wk Lows |
27 |
|
|
52 Wk Lows |
27 |
|
|
 |
Major Averages Pared Early Gains; Dow Hit Another Record High
Kenneth J. Gruneisen - Passed the CAN SLIM® Master's Exam
The major averages pared early gains to finish the session mostly higher following a better-than-expected labor report on Wednesday. Volume was reported near the prior session total on the NYSE and lower on the Nasdaq exchange. Breadth was slightly positive as advancers led decliners by a 7-6 margin on the NYSE and on the Nasdaq exchange. The total number of stocks hitting new 52-week highs (leadership) easily outnumbered new 52-week lows on the NYSE and on the Nasdaq exchange. There were 99 high-ranked companies from the CANSLIM.net Leaders List making new 52-week highs and appearing on the CANSLIM.net BreakOuts Page, down from the prior session's total of 142 stocks. There were gains for 10 of the 16 high-ranked companies currently included on the Featured Stocks Page, a list that has recently expanded with a few new added leaders. Coupled with solid leadership, the Nasdaq Composite Index's solid +1.32% gain on higher volume Tuesday was considered a follow-through day, shifting the market's (M criteria) direction to a confirmed rally again after a brief correction.
Before the open, ADP's report showed companies unexpectedly added 198,000 workers in February after an upwardly revised 215,000 gain in December. The Fed's Beige Book added to signs that the economy is improving amid rising demand for homes and autos. However, a weak factory orders report tempered investor enthusiasm as bookings dropped in January by the most since August 2012.
Overall, most sectors finished higher as the Dow added 42 points to close at a new record high of 14,296. The S&P 500 Index ended perched -1.5% below its all-time high close of 1,565 set on October 9, 2007.
Material stocks were the best performing group on the session as Freeport-McMoRan Copper & Gold Inc (FCX +4.12%). Defensive groups held the market back as utilities and telecommunication stocks fell. Spectra Energy Corp (SE -0.99%) and AT&T Inc (T -0.85%) lost ground. After the closing bell, notable profit tallies were out from PetSmart Inc (PETM +0.93%) and Vail Resorts Inc (MTN -0.37%).
Treasuries were lower for a third day. The 10-year note was down 12/32 to yield 1.94% and the 30-year bond lost 30/32 to yield 3.16%.
Any sustainable rally requires a healthy crop of companies hitting new 52-week highs, so it is always essential to see meaningful leadership (stocks hitting new 52-week highs). New buying efforts are justified under the fact-based system since Nasdaq Composite Index's solid gain on higher volume may be considered a follow-through day, shifting the market's (M criteria) direction to a confirmed rally again after a brief correction.
Watch for an announcement via email concerning the next WEBCAST. The webcast will also be available via an updated link highlighted at the top of the Premium Member Homepage.
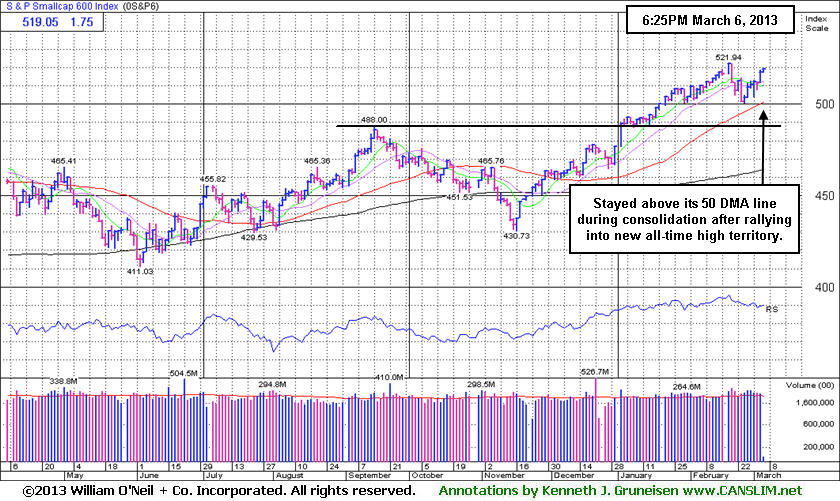
PICTURED: The S&P 600 Small Cap Index stayed above its 50-day moving average (DMA) line during its consolidation after rallying into new all-time high territory.
|
 Kenneth J. Gruneisen started out as a licensed stockbroker in August 1987, a couple of months prior to the historic stock market crash that took the Dow Jones Industrial Average down -22.6% in a single day. He has published daily fact-based fundamental and technical analysis on high-ranked stocks online for two decades. Through FACTBASEDINVESTING.COM, Kenneth provides educational articles, news, market commentary, and other information regarding proven investment systems that work in good times and bad.
Comments contained in the body of this report are technical opinions only and are not necessarily those of Gruneisen Growth Corp. The material herein has been obtained from sources believed to be reliable and accurate, however, its accuracy and completeness cannot be guaranteed. Our firm, employees, and customers may effect transactions, including transactions contrary to any recommendation herein, or have positions in the securities mentioned herein or options with respect thereto. Any recommendation contained in this report may not be suitable for all investors and it is not to be deemed an offer or solicitation on our part with respect to the purchase or sale of any securities. |
|
 |
Gold & Silver Index Bounced Back and Financial Shares Posted Gains
Kenneth J. Gruneisen - Passed the CAN SLIM® Master's Exam
Weakness in the Retail Index ($RLX -0.41%) was a negative influence on the major averages while strength in financial shares helped provide some lift on Wednesday as the Broker/Dealer Index ($XBD +0.80%) and the Bank Index ($BKX +1.07%) posted solid gains. Energy-related shares were quiet as the Oil Services Index ($OSX -0.03%) finished flat and the Integrated Oil Index ($XOI +0.17%) edged higher. The Semiconductor Index ($SOX +0.13%) and Biotechnology Index ($BTK +0.25%) were outpaced by slightly better gains in the Internet Index ($IIX +0.44%) and the Networking Index ($NWX +0.49%). Defensive groups were some of the strongest performers as the Healthcare Index ($HMO +1.11%) rose, yet it was the Gold & Silver Index ($XAU +4.19%) which was the standout gainer of the session. Regular readers should have noted prior reports illustrating how the classic "safe haven" group has clearly lagged while growth-oriented groups have made impressive progress in recent months
Charts courtesy www.stockcharts.com
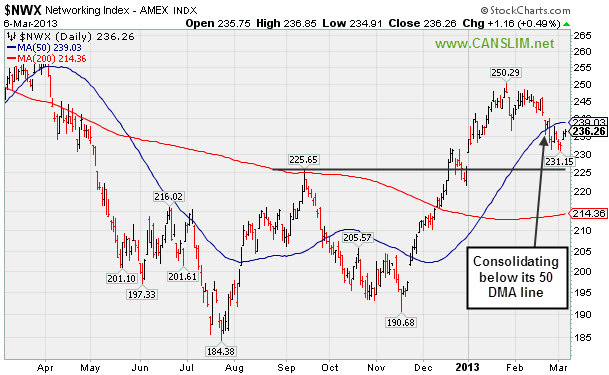
PICTURED: The Networking Index ($NWX +0.49%) is consolidating below its 50-day moving average (DMA) line. All of the other tech sector indexes regularly covered in the "Industry Group Watch" section have done better than the Networking Index year-to-date. The Semiconductor Index, Biotechnology Index, and the Internet Index have stayed well above their respective 50 DMA lines.
| Oil Services |
$OSX |
241.74 |
-0.08 |
-0.03% |
+9.80% |
| Healthcare |
$HMO |
2,709.85 |
+29.82 |
+1.11% |
+7.78% |
| Integrated Oil |
$XOI |
1,346.99 |
+2.25 |
+0.17% |
+8.47% |
| Semiconductor |
$SOX |
432.96 |
+0.57 |
+0.13% |
+12.73% |
| Networking |
$NWX |
236.26 |
+1.16 |
+0.49% |
+4.28% |
| Internet |
$IIX |
365.60 |
+1.60 |
+0.44% |
+11.80% |
| Broker/Dealer |
$XBD |
108.52 |
+0.86 |
+0.80% |
+15.04% |
| Retail |
$RLX |
722.35 |
-2.98 |
-0.41% |
+10.61% |
| Gold & Silver |
$XAU |
134.29 |
+5.40 |
+4.19% |
-18.91% |
| Bank |
$BKX |
55.59 |
+0.59 |
+1.07% |
+8.40% |
| Biotech |
$BTK |
1,770.83 |
+4.38 |
+0.25% |
+14.47% |
|
|
|
 |
Getting Extended From "3-Weeks Tight" Base With Streak of Volume-Driven Gains
Kenneth J. Gruneisen - Passed the CAN SLIM® Master's Exam
Often, when a leading stock is breaking out of a solid base it is highlighted in CANSLIM.net's Mid-Day Breakouts Report. The most relevant factors are noted in the report which alerts prudent CANSLIM oriented investors. After doing any necessary backup research, the investor is prepared to act. Disciplined investors know to buy as near as possible to the pivot point and avoid chasing stocks after they have rallied more than +5% above their pivot point. It is crucial to always limit losses whenever any stock heads the wrong direction, and disciplined investors sell if a struggling stock ever falls more than -7% from their purchase price.
M W I Veterinary Supply (MWIV +$0.86 or +0.64% to $136.29) was highlighted in yellow with pivot point based on its 2/05/13 high plus 10 cents in the 3/04/13 mid-day report (read here) and it touched another new 52-week high today while adding to its spurt of volume-driven gains. Gains in the major averages and strong leadership on 3/05/13 helped the market (M criteria) to produce a new confirmed rally with a follow-through day following a brief correction (noted in prior Market Commentaries). Last week it cleared an advanced "3-weeks tight" base pattern formed since it technically broke out of a sound base on 2/04/13. Its color code was changed to green after rallying above the "max buy" level.
The high-ranked Medical - Wholesale Drug/Supplies firm reported earnings +26% on +24% sales revenues for the quarter ended December 31, 2012 versus the year ago period, continuing its trend of recent quarterly earnings increases near the +25% minimum guideline (C criteria). MWIV has shown resilience in recent months after rebounding impressively from its lows since dropped from the Featured Stocks list on 8/05/11. Its last appearance in this FSU section with an annotated graph was back on 6/30/11 under the headline, "50-Day Moving Average Still Acting as Resistance". The price recently hitting new highs, solidly satisfies the N criteria.
Its solid annual earnings history satisfies the A criteria. Its small supply (S criteria) of only 12.8 million shares outstanding could contribute to greater volatility in the event of institutional buying or selling. The number of top-rated funds owning its shares rose from 266 in Mar '12 to 294 in Dec '12, a reassuring sign of support from the institutional (I criteria) crowd.

|
|
|
Color Codes Explained :
Y - Better candidates highlighted by our
staff of experts.
G - Previously featured
in past reports as yellow but may no longer be buyable under the
guidelines.
***Last / Change / Volume data in this table is the closing quote data***
Symbol/Exchange
Company Name
Industry Group |
PRICE |
CHANGE
(%Change) |
Day High |
Volume
(% DAV)
(% 50 day avg vol) |
52 Wk Hi
% From Hi |
Featured
Date |
Price
Featured |
Pivot Featured |
|
Max Buy |
CELG
-
NASDAQ
Celgene Corp
DRUGS - Drug Manufacturers - Major
|
$110.03
|
+1.66
1.53% |
$110.80
|
4,750,729
123.00% of 50 DAV
50 DAV is 3,862,500
|
$108.51
1.40%
|
12/11/2012
|
$82.24
|
PP = $81.34
|
|
MB = $85.41
|
Most Recent Note - 3/5/2013 1:52:36 PM
G - Hitting new all-time highs yet again with today's gain, getting extended from any sound base. Recent lows in the $96 area define near-term support above its 50 DMA line.
>>> The latest Featured Stock Update with an annotated graph appeared on 2/28/2013. Click here.
View all notes |
Alert me of new notes |
CANSLIM.net Company Profile |
SEC |
Zacks Reports |
StockTalk |
News |
Chart |
Request a new note
C
A N
S L
I M


|
CFNL
-
NASDAQ
Cardinal Financial Corp
BANKING - Regional - Southeast Banks
|
$16.96
|
+0.38
2.29% |
$16.96
|
224,460
116.85% of 50 DAV
50 DAV is 192,100
|
$16.90
0.36%
|
12/3/2012
|
$15.20
|
PP = $16.31
|
|
MB = $17.13
|
Most Recent Note - 3/1/2013 3:59:51 PM
Y - Rebounding above its 50 DMA line and its color code is changed to yellow with today's gain helping its outlook improve.
>>> The latest Featured Stock Update with an annotated graph appeared on 2/21/2013. Click here.
View all notes |
Alert me of new notes |
CANSLIM.net Company Profile |
SEC |
Zacks Reports |
StockTalk |
News |
Chart |
Request a new note
C
A N
S L
I M
|
CMCSA
-
NASDAQ
Comcast Corp Cl A
MEDIA - CATV Systems
|
$40.85
|
-0.10
-0.24% |
$41.31
|
7,831,810
56.08% of 50 DAV
50 DAV is 13,965,700
|
$42.00
-2.74%
|
12/3/2012
|
$37.08
|
PP = $38.06
|
|
MB = $39.96
|
Most Recent Note - 3/5/2013 1:41:04 PM
G - Volume totals have been cooling in the past week while consolidating above support at its 50 DMA line and still perched very near its 52-week high. Reported earnings +11% on +6% sales revenues for the Dec '12 quarter, below the +25% minimum earnings guideline (C criteria), raising fundamental concerns
>>> The latest Featured Stock Update with an annotated graph appeared on 2/19/2013. Click here.
View all notes |
Alert me of new notes |
CANSLIM.net Company Profile |
SEC |
Zacks Reports |
StockTalk |
News |
Chart |
Request a new note
C
A N
S L
I M
|
EVER
-
NYSE
Everbank Financial Corp
BANKING
|
$16.71
|
+0.57
3.53% |
$17.29
|
4,686,807
805.29% of 50 DAV
50 DAV is 582,000
|
$16.56
0.91%
|
3/4/2013
|
$15.38
|
PP = $15.83
|
|
MB = $16.62
|
 Most Recent Note - 3/6/2013 12:18:14 PM
G - Spiked further into new 52-week high territory and traded beyond it "max buy" level before erasing much of its early gain. A volume-driven gain above the pivot point cleared the previously noted "double bottom" base pattern and clinched a proper technical buy signal on 3/05/13 as the major averages' gains also confirmed a new rally with a follow-through-day (M criteria). Disciplined investors avoid chasing stocks more than +5% above their pivot point and always limit losses by selling if any stock falls more than -7% from their purchase price.
>>> The latest Featured Stock Update with an annotated graph appeared on 3/4/2013. Click here.
View all notes |
Alert me of new notes |
CANSLIM.net Company Profile |
SEC |
Zacks Reports |
StockTalk |
News |
Chart |
Request a new note
C
A N
S L
I M
|
JAZZ
-
NASDAQ
Jazz Pharmaceuticals Plc
DRUGS - Biotechnology
|
$59.12
|
-0.01
-0.02% |
$59.73
|
672,306
137.32% of 50 DAV
50 DAV is 489,600
|
$60.25
-1.88%
|
3/5/2013
|
$59.10
|
PP = $60.10
|
|
MB = $63.11
|
Most Recent Note - 3/5/2013 12:57:49 PM
Y - Color code is changed to yellow with new pivot point cited based on its 10/05/12 high plus 10 cents. Volume-driven gains above the pivot point may trigger a technical buy signal. Found support at its 200 DMA line in recent months and rebounded to its 52-week high before proposing yet another Secondary Offering on the prior session. Fundamentals remain strong (C and A criteria). Based on technical weakness it was dropped from the Featured Stocks list on 5/15/13.
>>> The latest Featured Stock Update with an annotated graph appeared on 4/27/2012. Click here.
View all notes |
Alert me of new notes |
CANSLIM.net Company Profile |
SEC |
Zacks Reports |
StockTalk |
News |
Chart |
Request a new note
C
A N
S L
I M
|
Symbol/Exchange
Company Name
Industry Group |
PRICE |
CHANGE
(%Change) |
Day High |
Volume
(% DAV)
(% 50 day avg vol) |
52 Wk Hi
% From Hi |
Featured
Date |
Price
Featured |
Pivot Featured |
|
Max Buy |
KORS
-
NYSE
Michael Kors Hldgs Ltd
RETAIL - Apparel Stores
|
$61.19
|
+0.67
1.11% |
$61.25
|
6,988,179
127.11% of 50 DAV
50 DAV is 5,497,800
|
$65.10
-6.01%
|
1/23/2013
|
$54.98
|
PP = $58.72
|
|
MB = $61.66
|
Most Recent Note - 3/5/2013 1:43:15 PM
G - Volume totals have cooled since halting its slide above prior highs in the $58 area. Completed another Secondary Offering 2/20/13 while perched near its all-time high.
>>> The latest Featured Stock Update with an annotated graph appeared on 2/7/2013. Click here.
View all notes |
Alert me of new notes |
CANSLIM.net Company Profile |
SEC |
Zacks Reports |
StockTalk |
News |
Chart |
Request a new note
C
A N
S L
I M
|
LNKD
-
NYSE
Linkedin Corp Class A
INTERNET - Internet Information Providers
|
$173.65
|
-2.34
-1.33% |
$178.29
|
1,789,038
75.86% of 50 DAV
50 DAV is 2,358,200
|
$179.35
-3.18%
|
2/8/2013
|
$147.04
|
PP = $127.55
|
|
MB = $133.93
|
Most Recent Note - 3/4/2013 3:51:00 PM
G - Considerable volume-driven gain today for yet another new all-time high, getting very extended from any sound base. Previously noted - "Disciplined investors may watch for secondary buy points or additional bases to possibly form and be noted in the weeks ahead."
>>> The latest Featured Stock Update with an annotated graph appeared on 2/8/2013. Click here.
View all notes |
Alert me of new notes |
CANSLIM.net Company Profile |
SEC |
Zacks Reports |
StockTalk |
News |
Chart |
Request a new note
C
A N
S L
I M
|
LOPE
-
NASDAQ
Grand Canyon Education
DIVERSIFIED SERVICES - Education and; Training Services
|
$23.75
|
+0.05
0.21% |
$23.85
|
254,956
54.49% of 50 DAV
50 DAV is 467,900
|
$27.18
-12.62%
|
2/20/2013
|
$26.44
|
PP = $25.10
|
|
MB = $26.36
|
Most Recent Note - 3/5/2013 6:39:20 PM
G - Rebounded near its 50 DMA line with today's gain on lighter (near average) volume. That short-term average may now act as resistance. It quickly negated its recent technical breakout.
>>> The latest Featured Stock Update with an annotated graph appeared on 2/20/2013. Click here.
View all notes |
Alert me of new notes |
CANSLIM.net Company Profile |
SEC |
Zacks Reports |
StockTalk |
News |
Chart |
Request a new note
C
A N
S L
I M
|
MIDD
-
NASDAQ
Middleby Corp
MANUFACTURING - Diversified Machinery
|
$149.71
|
-0.07
-0.05% |
$151.09
|
42,299
45.00% of 50 DAV
50 DAV is 94,000
|
$154.74
-3.25%
|
10/8/2012
|
$118.46
|
PP = $122.67
|
|
MB = $128.80
|
Most Recent Note - 3/5/2013 1:44:24 PM
G - Hovering near all-time highs today. Fundamental concerns were recently noted and prior reports cautioned members that it is extended from any sound base. Its 50 DMA line defines important near-term chart support above prior highs in the $134-135 area.
>>> The latest Featured Stock Update with an annotated graph appeared on 2/25/2013. Click here.
View all notes |
Alert me of new notes |
CANSLIM.net Company Profile |
SEC |
Zacks Reports |
StockTalk |
News |
Chart |
Request a new note
C
A N
S L
I M
|
MWIV
-
NASDAQ
M W I Veterinary Supply
HEALTH SERVICES - Medical Instruments and; Supplies
|
$136.29
|
+0.86
0.64% |
$137.18
|
77,311
147.26% of 50 DAV
50 DAV is 52,500
|
$136.64
-0.26%
|
3/4/2013
|
$130.90
|
PP = $129.45
|
|
MB = $135.92
|
Most Recent Note - 3/6/2013 6:35:22 PM
G - Color code is changed to green after rallying beyond its "max buy" level with another volume-driven gain. See the latest FSU analysis for more details and a new annotated graph.
>>> The latest Featured Stock Update with an annotated graph appeared on 3/6/2013. Click here.
View all notes |
Alert me of new notes |
CANSLIM.net Company Profile |
SEC |
Zacks Reports |
StockTalk |
News |
Chart |
Request a new note
C
A N
S L
I M
|
Symbol/Exchange
Company Name
Industry Group |
PRICE |
CHANGE
(%Change) |
Day High |
Volume
(% DAV)
(% 50 day avg vol) |
52 Wk Hi
% From Hi |
Featured
Date |
Price
Featured |
Pivot Featured |
|
Max Buy |
N
-
NYSE
Netsuite Inc
DIVERSIFIED SERVICES - Business/Management Services
|
$74.73
|
+0.73
0.99% |
$75.67
|
455,624
134.01% of 50 DAV
50 DAV is 340,000
|
$75.75
-1.35%
|
12/12/2012
|
$64.75
|
PP = $67.12
|
|
MB = $70.48
|
Most Recent Note - 3/4/2013 12:36:15 PM
G - Challenging its 52-week and all-time high with today's 5th consecutive volume-driven gain. See the latest FSU analysis for more details and a new annotated graph.
>>> The latest Featured Stock Update with an annotated graph appeared on 3/1/2013. Click here.
View all notes |
Alert me of new notes |
CANSLIM.net Company Profile |
SEC |
Zacks Reports |
StockTalk |
News |
Chart |
Request a new note
C
A N
S L
I M
|
NSR
-
NYSE
Neustar Inc
TELECOMMUNICATIONS - Diversified Communication Serv
|
$44.47
|
+0.21
0.47% |
$44.75
|
371,745
81.58% of 50 DAV
50 DAV is 455,700
|
$47.24
-5.86%
|
12/11/2012
|
$41.85
|
PP = $41.41
|
|
MB = $43.48
|
Most Recent Note - 3/1/2013 4:02:14 PM
G - Holding is ground just below its 50 DMA line today but enduring more distributional pressure. The damaging loss on 2/21/13 with heavy volume raised concerns and triggered a technical sell signal.
>>> The latest Featured Stock Update with an annotated graph appeared on 2/27/2013. Click here.
View all notes |
Alert me of new notes |
CANSLIM.net Company Profile |
SEC |
Zacks Reports |
StockTalk |
News |
Chart |
Request a new note
C
A N
S L
I M
|
QIHU
-
NYSE
Qihoo 360 Technology Ads
INTERNET - Internet Service Providers
|
$32.19
|
-2.63
-7.55% |
$33.43
|
6,210,326
254.70% of 50 DAV
50 DAV is 2,438,300
|
$34.90
-7.77%
|
3/5/2013
|
$34.63
|
PP = $34.47
|
|
MB = $36.19
|
Most Recent Note - 3/6/2013 11:16:26 AM
G - Gapped down today after reporting earnings +10% on +65% sales revenues for the Dec '12 quarter, below the +25% minimum earnings guideline (C criteria) raising fundamental concerns. Color code is changed to green based the sub par results and the abrupt reversal from its new 52-week high hit on the prior session. Prior mid-day reports cautioned - "Deceleration in its sales revenues and earnings growth rate in sequential quarterly comparisons through Sep '12 is cause for concern. Faces additional overhead supply up through the $36 area. Found support at its 200 DMA line in recent weeks This Chinese Computer Software - Security firm's quarterly earnings (C criteria) and sales revenues increases have been strong." See the latest FSU analysis for more details and a new annotated graph under the headline, "Earnings Below Guideline Raised Concerns After Technical Breakout".
>>> The latest Featured Stock Update with an annotated graph appeared on 3/5/2013. Click here.
View all notes |
Alert me of new notes |
CANSLIM.net Company Profile |
SEC |
Zacks Reports |
StockTalk |
News |
Chart |
Request a new note
C
A N
S L
I M
|
SFUN
-
NYSE
Soufun Hldgs Ltd Ads A
INTERNET - Internet Information Providers
|
$25.08
|
+0.28
1.13% |
$25.43
|
452,159
127.30% of 50 DAV
50 DAV is 355,200
|
$29.16
-13.99%
|
2/11/2013
|
$27.46
|
PP = $29.26
|
|
MB = $30.72
|
Most Recent Note - 3/5/2013 1:39:04 PM
G - Rebounding with a solid gain today, however it remains below its 50 DMA line which may now act as resistance. It did not trigger any recent technical buy signal.
>>> The latest Featured Stock Update with an annotated graph appeared on 2/11/2013. Click here.
View all notes |
Alert me of new notes |
CANSLIM.net Company Profile |
SEC |
Zacks Reports |
StockTalk |
News |
Chart |
Request a new note
C
A N
S L
I M
|
SLCA
-
NYSE
U S Silica Holdings Inc
CHEMICALS - Specialty Chemicals
|
$25.57
|
+1.10
4.50% |
$25.94
|
688,406
137.90% of 50 DAV
50 DAV is 499,200
|
$26.41
-3.18%
|
2/26/2013
|
$22.23
|
PP = $21.50
|
|
MB = $22.58
|
Most Recent Note - 3/1/2013 12:42:18 PM
G - Gapped down today, pulling back after a spurt of considerable volume-driven gains this week for new 52-week highs. Disciplined investors do not chase stocks extended from their prior base more than +5% above their pivot point or prior chart highs. See the latest FSU analysis for more details and an new annotated weekly graph.
>>> The latest Featured Stock Update with an annotated graph appeared on 2/26/2013. Click here.
View all notes |
Alert me of new notes |
CANSLIM.net Company Profile |
SEC |
Zacks Reports |
StockTalk |
News |
Chart |
Request a new note
C
A N
S L
I M
|
Symbol/Exchange
Company Name
Industry Group |
PRICE |
CHANGE
(%Change) |
Day High |
Volume
(% DAV)
(% 50 day avg vol) |
52 Wk Hi
% From Hi |
Featured
Date |
Price
Featured |
Pivot Featured |
|
Max Buy |
VRX
-
NYSE
Valeant Pharmaceuticals
DRUGS - Drug Manufacturers - Other
|
$68.52
|
-1.27
-1.82% |
$70.25
|
894,908
66.21% of 50 DAV
50 DAV is 1,351,600
|
$70.10
-2.25%
|
12/20/2012
|
$60.24
|
PP = $61.21
|
|
MB = $64.27
|
Most Recent Note - 3/5/2013 1:50:31 PM
Y - Hitting another new 52-week high with today's 5th consecutive gain. A valid secondary buy point exists following the successful test of support at its 10-week moving average up to as high as +5% above the recent high ($67.98 plus 5% or $71.38). Color code is changed to yellow however no new pivot point is cited since a new base was not formed. The 50 DMA line and recent low ($64.05 on 2/21/13) define the next important support area to watch.
>>> The latest Featured Stock Update with an annotated graph appeared on 2/15/2013. Click here.
View all notes |
Alert me of new notes |
CANSLIM.net Company Profile |
SEC |
Zacks Reports |
StockTalk |
News |
Chart |
Request a new note
C
A N
S L
I M
|
|
|
|
THESE ARE NOT BUY RECOMMENDATIONS!
Comments contained in the body of this report are technical
opinions only. The material herein has been obtained
from sources believed to be reliable and accurate, however,
its accuracy and completeness cannot be guaranteed.
This site is not an investment advisor, hence it does
not endorse or recommend any securities or other investments.
Any recommendation contained in this report may not
be suitable for all investors and it is not to be deemed
an offer or solicitation on our part with respect to
the purchase or sale of any securities. All trademarks,
service marks and trade names appearing in this report
are the property of their respective owners, and are
likewise used for identification purposes only.
This report is a service available
only to active Paid Premium Members.
You may opt-out of receiving report notifications
at any time. Questions or comments may be submitted
by writing to Premium Membership Services 665 S.E. 10 Street, Suite 201 Deerfield Beach, FL 33441-5634 or by calling 1-800-965-8307
or 954-785-1121.
|
|
|

