Symbol/Exchange
Company Name
Industry Group |
PRICE |
CHANGE
(%Change) |
Day High |
Volume
(% DAV)
(% 50 day avg vol) |
52 Wk Hi
% From Hi |
Featured
Date |
Price
Featured |
Pivot Featured |
| Max Buy |
ADS - NYSE
Alliance Data Sys Corp
COMPUTER SOFTWARE and SERVICES - Information and Delivery Service |
$120.05 |
-1.55
-1.27% |
$121.17 |
543,944
79.02% of 50 DAV
50 DAV is 688,400 |
$122.62
-2.10%
|
1/17/2012 |
$108.24 |
PP = $107.43 |
| MB = $112.80 |
 Most Recent Note - 3/6/2012 1:36:22 PM Most Recent Note - 3/6/2012 1:36:22 PM
G - Still quietly holding its ground near its all-time high, consolidating in a tight range for the past 3 weeks. Fundamental concerns were raised by earnings below the +25% guideline in the latest quarter ended December 31, 2011.
>>> The latest Featured Stock Update with an annotated graph appeared on 2/29/2012. Click here.
View all notes | Alert me of new notes | CANSLIM.net Company Profile | SEC | Zacks Reports | StockTalk | News | Chart |
Request a new note C A N S L I M    |
ALXN - NASDAQ
Alexion Pharmaceuticals
DRUGS - Drug Manufacturers - Other |
$83.28 |
-0.92
-1.09% |
$84.73 |
964,835
78.62% of 50 DAV
50 DAV is 1,227,200 |
$87.63
-4.96%
|
11/30/2011 |
$68.66 |
PP = $70.52 |
| MB = $74.05 |
Most Recent Note - 3/1/2012 5:13:44 PM
G - Holding its ground stubbornly with volume totals cooling after volume-driven gains for new all-time highs last week. It is extended from its prior base, and near-term support to watch is its 50 DMA line.
>>> The latest Featured Stock Update with an annotated graph appeared on 2/24/2012. Click here.
View all notes | Alert me of new notes | CANSLIM.net Company Profile | SEC | Zacks Reports | StockTalk | News | Chart |
Request a new note C A N S L I M |
BODY - NASDAQ
Body Central Corp
RETAIL - Catalog andamp; Mail Order Houses |
$28.08 |
+0.09
0.32% |
$28.10 |
134,841
72.85% of 50 DAV
50 DAV is 185,100 |
$29.49
-4.78%
|
1/27/2012 |
$26.69 |
PP = $25.46 |
| MB = $26.73 |
Most Recent Note - 3/2/2012 4:03:05 PM
G - Abruptly reversing the prior session's gain with a loss today on above average volume. It is extended from its prior base. An upward trendline connecting its Nov-Feb lows defines initial chart support to watch above its 50 DMA line and prior highs in the $26 area.
>>> The latest Featured Stock Update with an annotated graph appeared on 1/27/2012. Click here.
View all notes | Alert me of new notes | CANSLIM.net Company Profile | SEC | Zacks Reports | StockTalk | News | Chart |
Request a new note C A N S L I M |
CATM - NASDAQ
Cardtronics Inc
DIVERSIFIED SERVICES - Business/Management Services |
$27.65 |
-0.32
-1.14% |
$27.92 |
458,245
111.36% of 50 DAV
50 DAV is 411,500 |
$28.74
-3.79%
|
2/24/2012 |
$27.94 |
PP = $28.30 |
| MB = $29.72 |
Most Recent Note - 3/2/2012 4:09:36 PM
Y - Pulled back today while perched near its pivot point cited, not yet triggering a technical buy signal by clearing its "double bottom" base formed over the past 10 weeks during which it found prompt support at its 200 DMA line. Disciplined investors resist the urge to get in early while confirming gains are still needed.
>>> The latest Featured Stock Update with an annotated graph appeared on 1/30/2012. Click here.
View all notes | Alert me of new notes | CANSLIM.net Company Profile | SEC | Zacks Reports | StockTalk | News | Chart |
Request a new note C A N S L I M |
CDNS - NASDAQ
Cadence Design Systems
COMPUTER SOFTWARE and SERVICES - Technical and System Software |
$11.32 |
-0.19
-1.65% |
$11.57 |
3,066,849
98.69% of 50 DAV
50 DAV is 3,107,500 |
$12.11
-6.52%
|
2/3/2012 |
$11.66 |
PP = $11.15 |
| MB = $11.71 |
Most Recent Note - 3/2/2012 4:13:40 PM
Y - Recently stalled after rallying to new highs, clear of overhead supply. Color code is changed to yellow after a light volume loss today, finishing below its "max buy" level, while no new pivot point is cited.
>>> The latest Featured Stock Update with an annotated graph appeared on 2/3/2012. Click here.
View all notes | Alert me of new notes | CANSLIM.net Company Profile | SEC | Zacks Reports | StockTalk | News | Chart |
Request a new note C A N S L I M |
Symbol/Exchange
Company Name
Industry Group |
PRICE |
CHANGE
(%Change) |
Day High |
Volume
(% DAV)
(% 50 day avg vol) |
52 Wk Hi
% From Hi |
Featured
Date |
Price
Featured |
Pivot Featured |
| Max Buy |
CELG - NASDAQ
Celgene Corp
DRUGS - Drug Manufacturers - Major |
$72.28 |
-0.79
-1.08% |
$72.83 |
2,688,467
86.89% of 50 DAV
50 DAV is 3,094,200 |
$76.09
-5.01%
|
2/2/2012 |
$74.16 |
PP = $75.21 |
| MB = $78.97 |
Most Recent Note - 3/2/2012 4:15:54 PM
Y - Encountered mild distributional pressure this week while slumping below its pivot point. Within striking distance of its all-time high ($77.39 in Aug '08). Any subsequent volume-driven gains would be a reassuring sign of fresh institutional demand, meanwhile its 50 DMA line and prior lows in the $71 area now coincide and define important chart support to watch.
>>> The latest Featured Stock Update with an annotated graph appeared on 2/2/2012. Click here.
View all notes | Alert me of new notes | CANSLIM.net Company Profile | SEC | Zacks Reports | StockTalk | News | Chart |
Request a new note C A N S L I M |
ECHO - NASDAQ
Echo Global Logistics
DIVERSIFIED SERVICES - Business/Management Services |
$18.20 |
+0.15
0.83% |
$18.24 |
186,410
250.55% of 50 DAV
50 DAV is 74,400 |
$19.38
-6.09%
|
2/22/2012 |
$18.50 |
PP = $18.63 |
| MB = $19.56 |
Most Recent Note - 3/6/2012 12:11:24 PM
Y - Slumping near its 50 DMA line today following 2 damaging volume-driven gaps down in the past week. Gaps down are considered signs of distributional pressure. It has slumped below its pivot point, raising concerns.
>>> The latest Featured Stock Update with an annotated graph appeared on 2/23/2012. Click here.
View all notes | Alert me of new notes | CANSLIM.net Company Profile | SEC | Zacks Reports | StockTalk | News | Chart |
Request a new note C A N S L I M |
FEIC - NASDAQ
F E I Co
ELECTRONICS - Diversified Electronics |
$42.03 |
-0.29
-0.69% |
$42.44 |
1,174,339
403.83% of 50 DAV
50 DAV is 290,800 |
$48.31
-13.00%
|
12/7/2011 |
$41.41 |
PP = $42.35 |
| MB = $44.47 |
Most Recent Note - 3/2/2012 4:22:25 PM
G - Slumped below its 50 DMA line today and finished near the session low with a loss on average volume, raising concerns. Only a prompt rebound above its short term average would help its outlook, and any further deterioration may trigger a more worrisome technical sell signal. Recently reported +21% earnings for Dec '11 quarter, below the +25% minimum guideline for earnings growth.
>>> The latest Featured Stock Update with an annotated graph appeared on 1/25/2012. Click here.
View all notes | Alert me of new notes | CANSLIM.net Company Profile | SEC | Zacks Reports | StockTalk | News | Chart |
Request a new note C A N S L I M |
GNC - NYSE
G N C Holdings Inc
RETAIL - Drug Stores |
$31.75 |
-0.77
-2.37% |
$32.31 |
486,919
50.79% of 50 DAV
50 DAV is 958,700 |
$33.70
-5.79%
|
1/19/2012 |
$28.99 |
PP = $29.60 |
| MB = $31.08 |
Most Recent Note - 3/6/2012 1:29:43 PM
G - Pulling back today, consolidating well above prior highs in the $29.50 area and its 50 DMA line defining near-term support to watch.
>>> The latest Featured Stock Update with an annotated graph appeared on 3/5/2012. Click here.
View all notes | Alert me of new notes | CANSLIM.net Company Profile | SEC | Zacks Reports | StockTalk | News | Chart |
Request a new note C A N S L I M |
GOLD - NASDAQ
Randgold Resources Adr
METALS and MINING - Gold |
$108.48 |
-2.69
-2.42% |
$108.92 |
537,456
121.35% of 50 DAV
50 DAV is 442,900 |
$120.73
-10.15%
|
2/7/2012 |
$116.21 |
PP = $120.83 |
| MB = $126.87 |
Most Recent Note - 3/6/2012 1:33:30 PM
G - Color code is changed to green after a small gap down today violated its 50 DMA line, and it also sank below its prior low ($108.63 on 2/16/12), raising concerns and triggering technical sell signals.
>>> The latest Featured Stock Update with an annotated graph appeared on 2/8/2012. Click here.
View all notes | Alert me of new notes | CANSLIM.net Company Profile | SEC | Zacks Reports | StockTalk | News | Chart |
Request a new note C A N S L I M |
Symbol/Exchange
Company Name
Industry Group |
PRICE |
CHANGE
(%Change) |
Day High |
Volume
(% DAV)
(% 50 day avg vol) |
52 Wk Hi
% From Hi |
Featured
Date |
Price
Featured |
Pivot Featured |
| Max Buy |
HLF - NYSE
Herbalife Ltd
DRUGS - Nutrition and Weight Management |
$65.51 |
-1.46
-2.18% |
$66.49 |
1,359,323
108.75% of 50 DAV
50 DAV is 1,249,900 |
$68.01
-3.68%
|
2/22/2012 |
$65.90 |
PP = $63.50 |
| MB = $66.68 |
Most Recent Note - 3/1/2012 5:26:08 PM
G - Small gain today with above average volume, inching higher after stubbornly holding its ground in a very tight range since its 2/22/12 gain triggered a technical buy signal. Color code is changed to green after rising above its "max buy" level, getting extended from its prior base pattern. Prior highs in the $63 area define support to watch on pullbacks.
>>> The latest Featured Stock Update with an annotated graph appeared on 2/22/2012. Click here.
View all notes | Alert me of new notes | CANSLIM.net Company Profile | SEC | Zacks Reports | StockTalk | News | Chart |
Request a new note C A N S L I M |
ISRG - NASDAQ
Intuitive Surgical Inc
HEALTH SERVICES - Medical Appliances and Equipment |
$506.64 |
-6.79
-1.32% |
$511.50 |
271,580
74.67% of 50 DAV
50 DAV is 363,700 |
$523.10
-3.15%
|
12/20/2011 |
$442.43 |
PP = $449.16 |
| MB = $471.62 |
Most Recent Note - 3/1/2012 6:28:51 PM
G - Recently wedged to new all-time highs without great volume conviction and it is extended from prior highs in the $475 area that define support to watch on pullbacks. December '11 quarterly earnings increased by just below the borderline +25% minimum guideline for ideal buy candidates. See the latest FSU analysis for more details and a new annotated graph.
>>> The latest Featured Stock Update with an annotated graph appeared on 3/1/2012. Click here.
View all notes | Alert me of new notes | CANSLIM.net Company Profile | SEC | Zacks Reports | StockTalk | News | Chart |
Request a new note C A N S L I M |
LULU - NASDAQ
Lululemon Athletica
MANUFACTURING - Textile Manufacturing |
$66.05 |
-2.77
-4.02% |
$67.41 |
2,363,317
100.32% of 50 DAV
50 DAV is 2,355,800 |
$71.41
-7.51%
|
1/10/2012 |
$60.97 |
PP = $59.46 |
| MB = $62.43 |
Most Recent Note - 3/6/2012 10:52:48 AM
G - Gapped down today while on track for a 3rd consecutive loss after reversing from its all-time high. Prior highs in the $61-64 area and its 50 DMA line define chart support to watch on pullbacks.
>>> The latest Featured Stock Update with an annotated graph appeared on 2/21/2012. Click here.
View all notes | Alert me of new notes | CANSLIM.net Company Profile | SEC | Zacks Reports | StockTalk | News | Chart |
Request a new note C A N S L I M |
MA - NYSE
Mastercard Inc Cl A
DIVERSIFIED SERVICES - Business/Management Services |
$408.34 |
-9.28
-2.22% |
$412.13 |
935,779
85.42% of 50 DAV
50 DAV is 1,095,500 |
$428.57
-4.72%
|
2/2/2012 |
$379.05 |
PP = $381.32 |
| MB = $400.39 |
Most Recent Note - 3/6/2012 10:54:18 AM
G - Small gap down today, retreating from its all-time high hit last week. Prior highs in the $381-384 area define support to watch on pullbacks.
>>> The latest Featured Stock Update with an annotated graph appeared on 2/17/2012. Click here.
View all notes | Alert me of new notes | CANSLIM.net Company Profile | SEC | Zacks Reports | StockTalk | News | Chart |
Request a new note C A N S L I M |
MELI - NASDAQ
Mercadolibre Inc
INTERNET - Internet Software and; Services |
$93.05 |
-4.48
-4.59% |
$95.96 |
778,206
146.97% of 50 DAV
50 DAV is 529,500 |
$104.50
-10.96%
|
2/6/2012 |
$97.09 |
PP = $95.58 |
| MB = $100.36 |
Most Recent Note - 3/6/2012 10:58:27 AM
Y - Gapped down today, slumping under its pivot point and under prior highs in the $95 area, also violating an upward trendline connecting its October-February lows, raising concerns. Its 50 DMA line defines the next important support level to watch.
>>> The latest Featured Stock Update with an annotated graph appeared on 2/6/2012. Click here.
View all notes | Alert me of new notes | CANSLIM.net Company Profile | SEC | Zacks Reports | StockTalk | News | Chart |
Request a new note C A N S L I M |
Symbol/Exchange
Company Name
Industry Group |
PRICE |
CHANGE
(%Change) |
Day High |
Volume
(% DAV)
(% 50 day avg vol) |
52 Wk Hi
% From Hi |
Featured
Date |
Price
Featured |
Pivot Featured |
| Max Buy |
MKTX - NASDAQ
Marketaxess Holdings Inc
FINANCIAL SERVICES - Investment Brokerage - Nationa |
$34.80 |
+0.21
0.61% |
$35.08 |
240,121
95.89% of 50 DAV
50 DAV is 250,400 |
$35.42
-1.75%
|
10/28/2011 |
$29.79 |
PP = $31.05 |
| MB = $32.60 |
Most Recent Note - 3/5/2012 1:03:38 PM
G - Churning high volume today without making price progress, a sign of distributional pressure while perched near its all-time high with no resistance remaining. It completed a Secondary Offering on 2/22/12 and found prompt support near its 50 DMA line during its 4-week consolidation.
>>> The latest Featured Stock Update with an annotated graph appeared on 1/24/2012. Click here.
View all notes | Alert me of new notes | CANSLIM.net Company Profile | SEC | Zacks Reports | StockTalk | News | Chart |
Request a new note C A N S L I M |
RAX - NYSE
Rackspace Hosting Inc
INTERNET - Internet Software and; Services |
$51.32 |
-1.31
-2.49% |
$51.72 |
2,844,096
144.50% of 50 DAV
50 DAV is 1,968,300 |
$56.94
-9.87%
|
2/2/2012 |
$46.69 |
PP = $45.55 |
| MB = $47.83 |
Most Recent Note - 3/6/2012 11:03:59 AM
G - Gapped down today, raising concerns while completing a worrisome "island reversal" pattern following its considerable 2/14/12 gap up gain. Its 50 DMA line and prior highs in the $46 area define important near-term support to watch.
>>> The latest Featured Stock Update with an annotated graph appeared on 2/16/2012. Click here.
View all notes | Alert me of new notes | CANSLIM.net Company Profile | SEC | Zacks Reports | StockTalk | News | Chart |
Request a new note C A N S L I M |
RRTS - NYSE
Roadrunner Trans Systems
TRANSPORTATION - Air Delivery and Freight Service |
$17.35 |
-0.22
-1.25% |
$17.55 |
85,552
62.04% of 50 DAV
50 DAV is 137,900 |
$18.44
-5.91%
|
2/10/2012 |
$17.40 |
PP = $17.50 |
| MB = $18.38 |
Most Recent Note - 3/2/2012 4:33:06 PM
Y - Slumped to a close near its 2-week low and near its pivot point today with a loss on light volume. Prior highs in the $17 area define initial support to watch on pullbacks.
>>> The latest Featured Stock Update with an annotated graph appeared on 2/13/2012. Click here.
View all notes | Alert me of new notes | CANSLIM.net Company Profile | SEC | Zacks Reports | StockTalk | News | Chart |
Request a new note C A N S L I M |
SHFL - NASDAQ
Shuffle Master Inc
MANUFACTURING - Diversified Machinery |
$16.05 |
+1.48
10.16% |
$17.49 |
5,030,167
1,118.56% of 50 DAV
50 DAV is 449,700 |
$15.31
4.83%
|
3/6/2012 |
$17.07 |
PP = $15.25 |
| MB = $16.01 |
Most Recent Note - 3/6/2012 1:12:04 PM
Y - Reported earnings +56% on +28% sales revenues for the quarter ended January 31, 2012 versus the year ago period. The 3 latest quarterly comparisons showed strong earnings increases (C criteria) and its annual earnings growth (A criteria) has been strong after FY '09. Gapped up and hit new 52-week and multi-year highs today with heavy volume behind its gain after the previously noted advanced "3-weeks tight" base pattern. Color code is changed to yellow with pivot point based on its 2/17/12 high plus 10 cents. No resistance remains due to overhead supply.

There are no Featured Stock Updates™ available for this stock at this time. You may request one by clicking the Request a New Note link below
View all notes | Alert me of new notes | CANSLIM.net Company Profile | SEC | Zacks Reports | StockTalk | News | Chart |
Request a new note C A N S L I M |
SWI - NYSE
Solarwinds Inc
COMPUTER SOFTWARE and SERVICES - Application Software |
$36.55 |
-1.02
-2.71% |
$37.25 |
1,470,936
129.19% of 50 DAV
50 DAV is 1,138,600 |
$39.75
-8.05%
|
1/26/2012 |
$32.36 |
PP = $33.78 |
| MB = $35.47 |
Most Recent Note - 3/6/2012 11:07:14 AM
G - Small gap down today slumping back toward its "max buy" level after recently wedging higher without great volume conviction. Earnings below the +25% guideline for the Dec '11 quarter raised fundamental concerns.
>>> The latest Featured Stock Update with an annotated graph appeared on 1/26/2012. Click here.
View all notes | Alert me of new notes | CANSLIM.net Company Profile | SEC | Zacks Reports | StockTalk | News | Chart |
Request a new note C A N S L I M |
Symbol/Exchange
Company Name
Industry Group |
PRICE |
CHANGE
(%Change) |
Day High |
Volume
(% DAV)
(% 50 day avg vol) |
52 Wk Hi
% From Hi |
Featured
Date |
Price
Featured |
Pivot Featured |
| Max Buy |
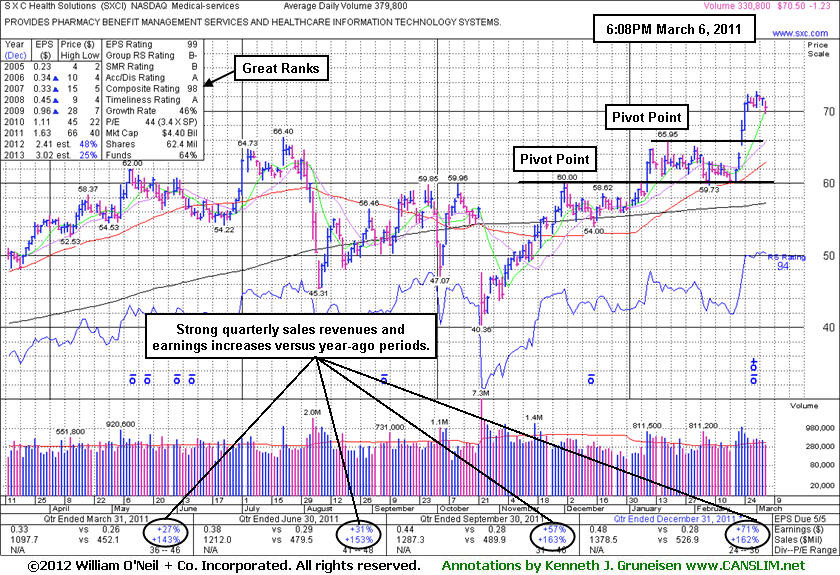
SXCI - NASDAQ
S X C Health Solutions
COMPUTER SOFTWARE and SERVICES - Healthcare Information Service |
$70.50 |
-1.23
-1.71% |
$71.42 |
330,863
87.12% of 50 DAV
50 DAV is 379,800 |
$72.73
-3.07%
|
2/23/2012 |
$68.24 |
PP = $66.05 |
| MB = $69.35 |
Most Recent Note - 3/6/2012 6:34:16 PM
G - Holding its ground near all-time high after rallying beyond its "max buy" level. Prior highs in the $66 area define support to watch on pullbacks. See latest FSU analysis for more details and a new annotated graph.
>>> The latest Featured Stock Update with an annotated graph appeared on 3/6/2012. Click here.
View all notes | Alert me of new notes | CANSLIM.net Company Profile | SEC | Zacks Reports | StockTalk | News | Chart |
Request a new note C A N S L I M |
TDG - NYSE
Transdigm Group Inc
AEROSPACE/DEFENSE - Aerospace/Defense Products and; Services |
$111.90 |
-3.40
-2.95% |
$113.88 |
601,331
161.17% of 50 DAV
50 DAV is 373,100 |
$121.48
-7.89%
|
2/29/2012 |
$120.10 |
PP = $118.93 |
| MB = $124.88 |
Most Recent Note - 3/6/2012 11:12:18 AM
Y - Gapped down today, encountering more distributional pressure. Its 50 DMA line defines important chart support to watch above prior highs in the $102 area.
>>> The latest Featured Stock Update with an annotated graph appeared on 2/10/2012. Click here.
View all notes | Alert me of new notes | CANSLIM.net Company Profile | SEC | Zacks Reports | StockTalk | News | Chart |
Request a new note C A N S L I M |
TNGO - NASDAQ
Tangoe Inc
COMPUTER SOFTWARE and SERVICES - Technical and System Software |
$18.00 |
-0.35
-1.91% |
$18.07 |
197,231
62.00% of 50 DAV
50 DAV is 318,100 |
$19.90
-9.55%
|
2/13/2012 |
$15.39 |
PP = $16.51 |
| MB = $17.34 |
Most Recent Note - 3/6/2012 11:41:19 AM
G - Small gap down today. Still consolidating above its "max buy" level and still too extended from prior highs in the $16 area to be considered buyable under the fact-based investment system's guidelines.
>>> The latest Featured Stock Update with an annotated graph appeared on 2/14/2012. Click here.
View all notes | Alert me of new notes | CANSLIM.net Company Profile | SEC | Zacks Reports | StockTalk | News | Chart |
Request a new note C A N S L I M |
TSCO - NASDAQ
Tractor Supply Co
SPECIALTY RETAIL - Specialty Retail, Other |
$85.67 |
-1.05
-1.21% |
$86.58 |
513,765
71.65% of 50 DAV
50 DAV is 717,000 |
$88.65
-3.36%
|
1/12/2012 |
$79.12 |
PP = $75.58 |
| MB = $79.36 |
Most Recent Note - 3/2/2012 4:40:27 PM
G - Down today on light volume. It is extended from a sound base after tallying 5 weekly gains in the span of 6 weeks. Its 50 DMA line defines support to watch on pullbacks.
>>> The latest Featured Stock Update with an annotated graph appeared on 2/27/2012. Click here.
View all notes | Alert me of new notes | CANSLIM.net Company Profile | SEC | Zacks Reports | StockTalk | News | Chart |
Request a new note C A N S L I M |
UA - NYSE
Under Armour Inc Cl A
CONSUMER NON-DURABLES - Textile - Apparel Clothing |
$88.84 |
-3.08
-3.35% |
$90.67 |
1,253,739
99.60% of 50 DAV
50 DAV is 1,258,800 |
$93.12
-4.60%
|
2/15/2012 |
$85.77 |
PP = $84.86 |
| MB = $89.10 |
Most Recent Note - 3/6/2012 1:19:45 PM
Y - Color code is changed to yellow after slumping back below its "max buy" level following a small gap down today. Recent gains above its pivot point did not have volume sufficient to trigger a proper technical buy signal. Pyramiding into a stock can help investors avoid chasing them too far above their pivot point.
>>> The latest Featured Stock Update with an annotated graph appeared on 2/15/2012. Click here.
View all notes | Alert me of new notes | CANSLIM.net Company Profile | SEC | Zacks Reports | StockTalk | News | Chart |
Request a new note C A N S L I M |
Symbol/Exchange
Company Name
Industry Group |
PRICE |
CHANGE
(%Change) |
Day High |
Volume
(% DAV)
(% 50 day avg vol) |
52 Wk Hi
% From Hi |
Featured
Date |
Price
Featured |
Pivot Featured |
| Max Buy |
UBNT - NASDAQ
Ubiquiti Networks Inc
TELECOMMUNICATIONS - Diversified Communication Serv |
$23.57 |
-1.61
-6.39% |
$25.10 |
459,107
155.52% of 50 DAV
50 DAV is 295,200 |
$28.97
-18.64%
|
1/27/2012 |
$22.25 |
PP = $23.14 |
| MB = $24.30 |
Most Recent Note - 3/6/2012 11:22:24 AM
Y - Slumping below its "max buy" level today and its color code is changed to yellow again. While no new pivot point is cited, they teach in the Certification that a stock may be bought from its 10-week moving average (WMA) up to +5% above the latest high ($28.97 on 2/28/12) following an earlier technical breakout.
>>> The latest Featured Stock Update with an annotated graph appeared on 2/1/2012. Click here.
View all notes | Alert me of new notes | CANSLIM.net Company Profile | SEC | Zacks Reports | StockTalk | News | Chart |
Request a new note C A N S L I M |
ULTA - NASDAQ
Ulta Salon Cosm & Frag
SPECIALTY RETAIL - Specialty Retail, Other |
$85.85 |
-1.29
-1.48% |
$86.90 |
761,238
104.54% of 50 DAV
50 DAV is 728,200 |
$87.93
-2.36%
|
1/11/2012 |
$71.97 |
PP = $75.80 |
| MB = $79.59 |
Most Recent Note - 3/6/2012 1:39:40 PM
G - Pulling back today from the new all-time high hit on the prior session. It is extended from any sound base pattern, meanwhile its prior highs near $75 and its 50 DMA line define important chart support.
>>> The latest Featured Stock Update with an annotated graph appeared on 2/28/2012. Click here.
View all notes | Alert me of new notes | CANSLIM.net Company Profile | SEC | Zacks Reports | StockTalk | News | Chart |
Request a new note C A N S L I M |
V - NYSE
Visa Inc Cl A
DIVERSIFIED SERVICES - Business/Management Services |
$114.84 |
-1.40
-1.20% |
$115.50 |
3,325,498
86.26% of 50 DAV
50 DAV is 3,855,300 |
$119.36
-3.79%
|
2/2/2012 |
$105.43 |
PP = $104.30 |
| MB = $109.52 |
Most Recent Note - 3/6/2012 1:42:21 PM
G - Small gap down today. Recently wedged to new high territory with below average volume conviction behind its gains. Its 50 DMA line and prior highs in the $103-104 area define support to watch.
>>> The latest Featured Stock Update with an annotated graph appeared on 1/23/2012. Click here.
View all notes | Alert me of new notes | CANSLIM.net Company Profile | SEC | Zacks Reports | StockTalk | News | Chart |
Request a new note C A N S L I M |