You are not logged in.
This means you
CAN ONLY VIEW reports that were published prior to Monday, April 14, 2025.
You
MUST UPGRADE YOUR MEMBERSHIP if you want to see any current reports.
AFTER MARKET UPDATE - WEDNESDAY, MARCH 3RD, 2010
Previous After Market Report Next After Market Report >>>
|
|
|
|
DOW |
-9.22 |
10,396.76 |
-0.09% |
|
Volume |
936,672,660 |
-13% |
|
Volume |
2,580,353,930 |
-8% |
|
NASDAQ |
-0.11 |
2,280.68 |
-0.00% |
|
Advancers |
1,641 |
52% |
|
Advancers |
1,430 |
51% |
|
S&P 500 |
+0.48 |
1,118.79 |
+0.04% |
|
Decliners |
1,368 |
44% |
|
Decliners |
1,258 |
45% |
|
Russell 2000 |
+0.95 |
649.26 |
+0.15% |
|
52 Wk Highs |
292 |
|
|
52 Wk Highs |
180 |
|
|
S&P 600 |
+0.40 |
344.79 |
+0.12% |
|
52 Wk Lows |
1 |
|
|
52 Wk Lows |
7 |
|
|
 |
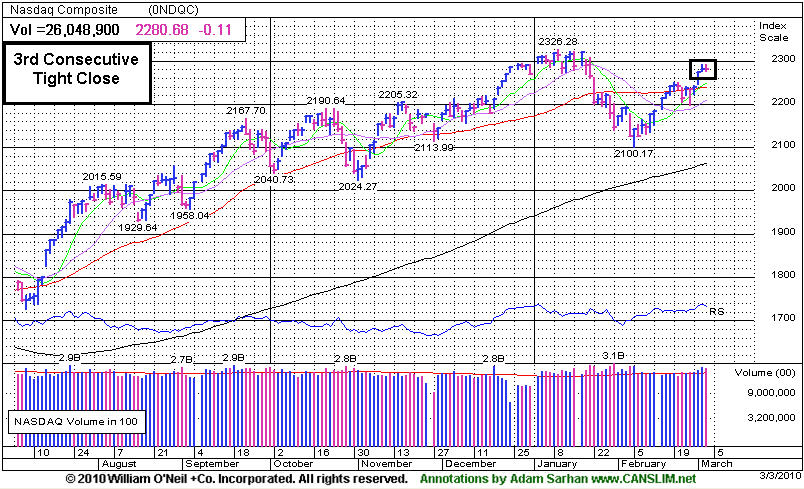
Indices Quietly Consolidate After Starting March Strong
Adam Sarhan, Contributing Writer,
The major averages ended mixed and very little changed after the latest economic data showed improvement in the US job market and service industries. Volume, a critical gauge of institutional demand, was reported lower than the prior session on the Nasdaq exchange and on the NYSE. Advancers led decliners by a narrow margin on the NYSE and on the Nasdaq exchange. There were 46 high-ranked companies from the CANSLIM.net Leaders List that made a new 52-week high and appeared on the CANSLIM.net BreakOuts Page, down from the 76 issues that appeared on the prior session. New 52-week highs still overwhelmingly trumped new lows on both exchanges.
Before Wednesday's opening bell, ADP Employer Services said US employers only cut 20,000 jobs last month. This was the lowest reading in two years and bodes well for Friday's official payrolls report. Elsewhere, the Institute for Supply Management (ISM) said its service index enjoyed the fastest growth rate since October 2007 which bodes well for the economic recovery. The service index currently makes up over two thirds of the overall economy and a stronger reading is another healthy sign for the economy. In Europe, Greece announced plans to cut its budget by an additional 4.8 billion euros ($6.6 billion) after European Union leaders called for deeper reductions before considering aid.
Looking at the market, the latest rally attempt was confirmed when a "cautious follow-through day" was produced by the Nasdaq Composite Index's +1.6% on Monday, March 1st. Weighing into the decision to label the day a follow-through-day (FTD) was the strong action in leading stocks along with a great expansion noted in the new highs list. That action suggests that there is a healthy crop of strong stocks capable of fueling a substantial rally higher for the major averages. We will be looking out for any near-term distribution days (high volume declines) which would hurt the chances for this nascent rally. Until then, the bulls deserve the bullish benefit of the doubt as the major averages continue edging higher.
It is a welcome sign to see the market continue to improve as investors digest the latest round of stronger than expected economic and earnings data. Remember that now that a new rally has been confirmed, the window is open to start buying high quality breakouts. Trade accordingly.
Professional Money Management Services - A Winning System - Inquire today!
Our skilled team of portfolio managers knows how to follow the rules of this fact-based investment system. We do not follow opinion or the "conviction list" of some large Wall Street institution which would have us fully invested even during horrific bear markets. Instead, we remain fluid and only buy the best stocks when they are triggering proper technical buy signals. If you are not completely satisfied with the way your portfolio is being managed, Click here to get connected with one of our portfolio managers. *Accounts over $250,000 please. ** Serious inquires only, please.
PICTURED: The Nasdaq Composite Index closed in a very tight range over the past three days.
|
|
|
 |
Defensive Groups Led While Financials Edged Lower
Kenneth J. Gruneisen - Passed the CAN SLIM® Master's Exam
Defensive groups were among Wednesday's best gainers as the Gold & Silver Index ($XAU +1.38%), Oil Services Index ($OSX +1.34%), Integrated Oil Index ($XOI +0.36%), and Healthcare Index ($HMO +0.93%) posted modest gains The tech sector had a mostly positive bias, led by the Networking Index ($NWX +1.48%) and the Biotechnology Index ($BTK +0.84%), both of which surged to new recovery highs. The Internet Index ($IIX +0.26%) also posted a small gain, but the Semiconductor Index ($SOX -0.86%) was a clear laggard. Modest losses from the Broker/Dealer Index ($XBD -0.51%), Bank Index ($BKX -0.40%), and Retail Index ($RLX -0.10%) also created an offsetting drag on the major averages.
Charts courtesy www.stockcharts.com
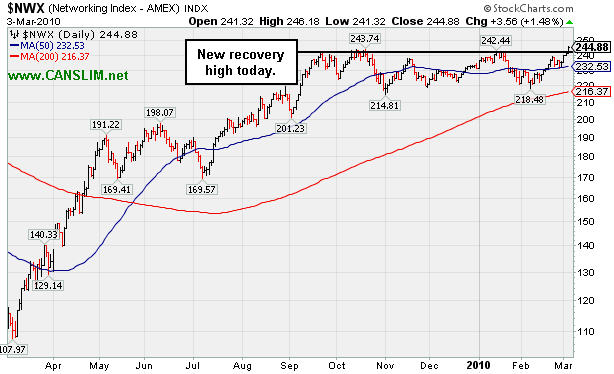
PICTURED: The Networking Index ($NWX +1.48%) rallied to a new recovery high.
| Oil Services |
$OSX |
209.12 |
+2.77 |
+1.34% |
+7.29% |
| Healthcare |
$HMO |
1,468.30 |
+13.50 |
+0.93% |
-0.32% |
| Integrated Oil |
$XOI |
1,043.26 |
+3.73 |
+0.36% |
-2.34% |
| Semiconductor |
$SOX |
346.37 |
-3.02 |
-0.86% |
-3.76% |
| Networking |
$NWX |
244.88 |
+3.56 |
+1.48% |
+5.98% |
| Internet |
$IIX |
234.21 |
+0.60 |
+0.26% |
+0.15% |
| Broker/Dealer |
$XBD |
114.49 |
-0.59 |
-0.51% |
-0.49% |
| Retail |
$RLX |
424.38 |
-0.41 |
-0.10% |
+3.23% |
| Gold & Silver |
$XAU |
170.28 |
+2.32 |
+1.38% |
+1.21% |
| Bank |
$BKX |
47.36 |
-0.19 |
-0.40% |
+10.89% |
| Biotech |
$BTK |
1,133.51 |
+9.48 |
+0.84% |
+20.31% |
|
|
|
 |
Volume Eight Times Average Behind Breakout Gain
Kenneth J. Gruneisen - Passed the CAN SLIM® Master's Exam
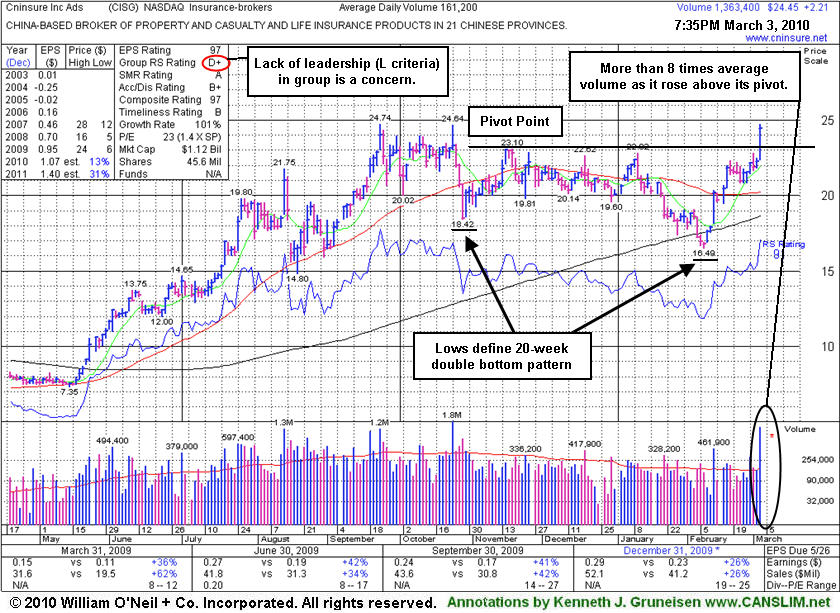
Cninsure Inc (CISG +$2.21 to $24.45) spiked higher with 8 times average volume today, trading within a penny of its 52-week high following its latest earnings report for the quarter ended Dec 31, 2009, rising from a 20-week double bottom base. It was featured in the mid-day report (read here) color coded yellow with pivot point cited based on its 11/18/09 high. This China-based insurance broker has shown strong earnings and sales growth above the +25% guideline but generally decelerating over the course of recent years. The lack of leadership in the Insurance-Brokers industry group also remains a concern with respect to the investment system's L criteria.
|
|
|
Color Codes Explained :
Y - Better candidates highlighted by our
staff of experts.
G - Previously featured
in past reports as yellow but may no longer be buyable under the
guidelines.
***Last / Change / Volume quote data in this table corresponds with the timestamp on the note***
Symbol/Exchange
Company Name
Industry Group |
Last |
Chg. |
Vol
% DAV |
Date Featured |
Price Featured |
Latest Pivot Point
Featured |
Status |
| Latest Max Buy Price |
ARST
-
|
$27.33
|
-0.41
|
449,866
119% DAV
379,000
|
2/24/2010
(Date
Featured) |
$25.94
(Price
Featured) |
PP = $27.95 |
Y |
| MB = $29.35 |
Most Recent Note - 3/3/2010 6:13:26 PM
Y - Gapped up today and traded above its pivot point, then negatively reversed for a loss with slightly above average volume, closing near the session low and raising concerns. Support to watch is at its 50 DMA line. The recent chart low defines an important support level to watch.
>>> The latest Featured Stock Update with an annotated graph appeared on 2/17/2010. click here.
|
|
C
A
S
I |
News |
Chart |
SEC
View all notes Alert
me of new notes
Company
Profile
|
ARUN
- NASDAQ
Aruba Networks Inc
COMPUTER HARDWARE - Networking & Communication Dev
|
$12.43
|
+0.15
|
1,507,993
108% DAV
1,392,200
|
2/19/2010
(Date
Featured) |
$12.71
(Price
Featured) |
PP = $11.94 |
Y |
| MB = $12.54 |
Most Recent Note - 3/3/2010 6:36:07 PM
Y - Posted a 4th consecutive gain today, approaching its "max buy" level. It found support above prior chart highs following its 2/19/10 gap up gain on heavy volume. ARUN was featured in the mid-day report on 2/19/10 as it rose from a flat base-on-base pattern above its 50-day moving average line (read here).
>>> The latest Featured Stock Update with an annotated graph appeared on 2/22/2010. click here.
|
|
C
A
S
I |
News |
Chart |
SEC
View all notes Alert
me of new notes
Company
Profile
|
BIDU
- NASDAQ
Baidu Inc Ads
INTERNET - Internet Information Providers
|
$517.02
|
-1.86
|
732,397
38% DAV
1,951,100
|
1/13/2010
(Date
Featured) |
$431.25
(Price
Featured) |
PP = $426.75 |
G |
| MB = $448.09 |
Most Recent Note - 3/3/2010 6:38:00 PM
G - Tallied small losses for the past 2 sessions on lighter than average volume after a streak of light volume gains for new all-time highs. Extended above its mid-January highs now, it rose steadily since the 2/10/10 gap up gain with more than 3 times average volume.
>>> The latest Featured Stock Update with an annotated graph appeared on 2/11/2010. click here.
|
|
C
A
S
I |
News |
Chart |
SEC
View all notes Alert
me of new notes
Company
Profile
|
BRLI
- NASDAQ
Bio Reference Labs Inc
HEALTH SERVICES - Medical Laboratories & Researc
|
$41.21
|
-0.76
|
196,564
217% DAV
90,600
|
2/12/2010
(Date
Featured) |
$39.02
(Price
Featured) |
PP = $40.97 |
Y |
| MB = $43.02 |
Most Recent Note - 3/3/2010 6:45:41 PM
Y - Gapped down today for a loss with more than twice average volume following gains on the 2 prior session with below the +50% above average guideline for a proper technical buy signal while wedging its way above its pivot point. Its Up/Down Volume Ratio of 2.2 is a bullish indicator This high-ranked Medical-Dental - Services firm was featured in yellow in the 2/12/10 mid-day report (read here).
>>> The latest Featured Stock Update with an annotated graph appeared on 3/1/2010. click here.
|
|
C
A
S
I |
News |
Chart |
SEC
View all notes Alert
me of new notes
Company
Profile
|
CACC
- NASDAQ
Credit Acceptance Corp
FINANCIAL SERVICES - Credit Services
|
$43.73
|
-0.81
|
63,975
105% DAV
60,800
|
9/29/2009
(Date
Featured) |
$33.48
(Price
Featured) |
PP = $37.10 |
G |
| MB = $38.96 |
Most Recent Note - 3/3/2010 6:47:29 PM
G - Today's loss suggests that its 50 DMA line is now acting as resistance. Recent lows are a nearby chart support level to watch just above its old chart highs in the $37 area.
>>> The latest Featured Stock Update with an annotated graph appeared on 3/2/2010. click here.
|
|
C
A
S
I |
News |
Chart |
SEC
View all notes Alert
me of new notes
Company
Profile
|
CISG
- NASDAQ
Cninsure Inc Ads
INSURANCE - Insurance Brokers
|
$24.45
|
+2.21
|
1,364,202
846% DAV
161,200
|
3/3/2010
(Date
Featured) |
$24.38
(Price
Featured) |
PP = $23.10 |
Y |
| MB = $24.26 |
Most Recent Note - 3/3/2010 6:51:12 PM
Y - Spiked higher with 8 times average volume today, trading within a penny of its 52-week high following its latest earnings report for the quarter ended Dec 31, 2009, rising from a 20-week double bottom base. It was featured in the mid-day report (read here) color coded yellow with pivot point cited based on its 11/18/09 high. This China-based insurance broker has shown strong earnings and sales growth above the +25% guideline but generally decelerating over the course of recent years. The lack of leadership in the Insurance-Brokers industry group also remains a concern with respect to the investment system's L criteria.
>>> The latest Featured Stock Update with an annotated graph appeared on 3/3/2010. click here.
|
|
C
A
S
I |
News |
Chart |
SEC
View all notes Alert
me of new notes
Company
Profile
|
CRM
- NYSE
Salesforce.com Inc
INTERNET - Internet Software & Services
|
$70.57
|
-1.27
|
1,494,645
71% DAV
2,098,200
|
12/18/2009
(Date
Featured) |
$67.32
(Price
Featured) |
PP = $67.82 |
G |
| MB = $71.21 |
Most Recent Note - 3/3/2010 6:54:31 PM
G - Loss today on light volume. Recently rebounded above its 50 DMA line, rallying toward its all-time high, but it has not formed a new sound base. Recent chart low ($64.77 on 2/25/10) is now an important support level to watch.
>>> The latest Featured Stock Update with an annotated graph appeared on 2/10/2010. click here.
|
|
C
A
S
I |
News |
Chart |
SEC
View all notes Alert
me of new notes
Company
Profile
|
CTRP
- NASDAQ
Ctrip.com Intl Ltd Adr
LEISURE - Resorts & Casinos
|
$36.42
|
-1.51
|
2,728,139
129% DAV
2,119,300
|
3/1/2010
(Date
Featured) |
$38.23
(Price
Featured) |
PP = $38.50 |
Y |
| MB = $40.43 |
Most Recent Note - 3/3/2010 6:58:47 PM
Y - Pulled back for a second consecutive session, falling on higher volume today. It promptly reversed after its 3/01/10 gain for a new all-time high. It was noted that the 3/01/10 gain above its pivot point did not meet the minimum volume threshold of +50% above average volume required for a proper technical buy signal. Featured in the new March 2010 issue of CANSLIM.net News (read here).
>>> The latest Featured Stock Update with an annotated graph appeared on 2/28/2010. click here.
|
|
C
A
S
I |
News |
Chart |
SEC
View all notes Alert
me of new notes
Company
Profile
|
EZPW
- NASDAQ
Ezcorp Inc Cl A
SPECIALTY RETAIL - Specialty Retail, Other
|
$19.92
|
-0.53
|
533,837
115% DAV
465,800
|
2/19/2010
(Date
Featured) |
$19.03
(Price
Featured) |
PP = $18.80 |
G |
| MB = $19.74 |
Most Recent Note - 3/3/2010 7:03:09 PM
G - Touched a new all-time high today then reversed for a loss with near average volume. It is slightly extended above its pivot point. Prior chart highs in the $18 area define an important support level to watch. Featured in yellow in the 2/19/10 mid-day report (read here).
>>> The latest Featured Stock Update with an annotated graph appeared on 2/19/2010. click here.
|
|
C
A
S
I |
News |
Chart |
SEC
View all notes Alert
me of new notes
Company
Profile
|
GMCR
- NASDAQ
Green Mtn Coffee Roastrs
FOOD & BEVERAGE - Processed & Packaged Goods
|
$87.23
|
-0.66
|
1,306,755
88% DAV
1,479,600
|
2/26/2010
(Date
Featured) |
$84.39
(Price
Featured) |
PP = $88.75 |
Y |
| MB = $93.19 |
Most Recent Note - 3/3/2010 7:06:40 PM
Y - Loss today on near average volume, ending below its pivot point. The prior session's big gain had heavy volume, but it did not close above its pivot point cited. Keep in mind that GMCR has formed a "late-stage" base after showing up as a fresh buy candidate long ago in CANSLIM.net reports. Important initial support level to watch is its 50 DMA line and recent lows near the $80 area.
>>> The latest Featured Stock Update with an annotated graph appeared on 2/23/2010. click here.
|
|
C
A
S
I |
News |
Chart |
SEC
View all notes Alert
me of new notes
Company
Profile
|
ISRG
- NASDAQ
Intuitive Surgical Inc
HEALTH SERVICES - Medical Appliances & Equipment
|
$362.80
|
+1.50
|
452,772
87% DAV
517,900
|
1/22/2010
(Date
Featured) |
$340.40
(Price
Featured) |
PP = $314.00 |
G |
| MB = $329.70 |
Most Recent Note - 3/3/2010 7:08:39 PM
G - Posted a 4th consecutive gain today with below average volume for new all-time highs, extended above its prior chart highs. ISRG was featured at $340.40 in the 1/22/10 mid-day report following a powerful breakaway gap (read here).
>>> The latest Featured Stock Update with an annotated graph appeared on 2/24/2010. click here.
|
|
C
A
S
I |
News |
Chart |
SEC
View all notes Alert
me of new notes
Company
Profile
|
PCLN
- NASDAQ
Priceline.com Inc
INTERNET - Internet Software & Services
|
$399.55
|
-4.72
|
584,812
N/A
|
11/1/2002
(Date
Featured) |
$399.55
(Price
Featured) |
PP = $428.20 |
Y |
| MB = $449.61 |
Most Recent Note - 1/2/2011
Y - Returns to Featured Stocks list with its appearance in the January 2011 CANSLIM.net News including detailed analysis and annotated daily and weekly graphs.
>>> The latest Featured Stock Update with an annotated graph appeared on 2/18/2010. click here.
|
|
C
A
S
I |
News |
Chart |
SEC
View all notes Alert
me of new notes
Company
Profile
|
PEGA
- NASDAQ
Pegasystems Inc
COMPUTER SOFTWARE & SERVICES - Business Software & Services
|
$35.43
|
-0.20
|
320,365
160% DAV
200,600
|
2/26/2010
(Date
Featured) |
$36.00
(Price
Featured) |
PP = $38.55 |
Y |
| MB = $40.48 |
Most Recent Note - 3/3/2010 7:27:54 PM
Y - Loss today on above average volume, testing its 50 DMA line. Positively reversed on 2/23/10 after a brief 50 DMA line violation, finding prompt support near prior chart lows in the $32 area.
>>> The latest Featured Stock Update with an annotated graph appeared on 2/26/2010. click here.
|
|
C
A
S
I |
News |
Chart |
SEC
View all notes Alert
me of new notes
Company
Profile
|
ROVI
- NASDAQ
Rovi Corp
COMPUTER SOFTWARE & SERVICES - Security Software & Services
|
$34.63
|
-0.12
|
752,787
71% DAV
1,055,700
|
2/25/2010
(Date
Featured) |
$33.54
(Price
Featured) |
PP = $34.87 |
Y |
| MB = $36.61 |
Most Recent Note - 3/3/2010 7:29:48 PM
Y - Held its ground quietly today after a considerable 3/02/10 gain with volume more than 2 times average triggered a technical buy signal as it rallied above its pivot point and hit a new 52-week high. Announced news after Monday's close about an expansion of its relationship with Comcast (read here). Featured on 2/25/10 in yellow in the mid-day report (read here).
>>> The latest Featured Stock Update with an annotated graph appeared on 2/25/2010. click here.
|
|
C
A
S
I |
News |
Chart |
SEC
View all notes Alert
me of new notes
Company
Profile
|
SIRO
- NASDAQ
Sirona Dental Systems
HEALTH SERVICES - Medical Instruments & Supplies
|
$36.67
|
-0.76
|
553,653
100% DAV
552,600
|
2/16/2010
(Date
Featured) |
$36.43
(Price
Featured) |
PP = $36.15 |
Y |
| MB = $37.96 |
Most Recent Note - 3/3/2010 7:30:58 PM
Y - Pulled back on average volume today from its 52-week high. It was featured in yellow in the 2/16/10 mid-day report (read here) as it broke out from a 10-week flat base.
>>> The latest Featured Stock Update with an annotated graph appeared on 2/16/2010. click here.
|
|
C
A
S
I |
News |
Chart |
SEC
View all notes Alert
me of new notes
Company
Profile
|
VPRT
- NASDAQ
Vistaprint Nv
DIVERSIFIED SERVICES - Business/Management Services
|
$58.89
|
-0.58
|
249,117
51% DAV
487,300
|
3/1/2010
(Date
Featured) |
$57.72
(Price
Featured) |
PP = $59.70 |
Y |
| MB = $62.69 |
Most Recent Note - 3/3/2010 7:32:48 PM
Y - Small loss today on very light volume. Perched near its all-time high after gain on 3/02/10 lacked great volume conviction and it closed below its pivot point. Featured in the March 2010 CANSLIM.net News monthly newsletter (read here).
>>> The latest Featured Stock Update with an annotated graph appeared on 2/28/2010. click here.
|
|
C
A
S
I |
News |
Chart |
SEC
View all notes Alert
me of new notes
Company
Profile
|
|
|
|
THESE ARE NOT BUY RECOMMENDATIONS!
Comments contained in the body of this report are technical
opinions only. The material herein has been obtained
from sources believed to be reliable and accurate, however,
its accuracy and completeness cannot be guaranteed.
This site is not an investment advisor, hence it does
not endorse or recommend any securities or other investments.
Any recommendation contained in this report may not
be suitable for all investors and it is not to be deemed
an offer or solicitation on our part with respect to
the purchase or sale of any securities. All trademarks,
service marks and trade names appearing in this report
are the property of their respective owners, and are
likewise used for identification purposes only.
This report is a service available
only to active Paid Premium Members.
You may opt-out of receiving report notifications
at any time. Questions or comments may be submitted
by writing to Premium Membership Services 665 S.E. 10 Street, Suite 201 Deerfield Beach, FL 33441-5634 or by calling 1-800-965-8307
or 954-785-1121.
|
|
|


