You are not logged in.
This means you
CAN ONLY VIEW reports that were published prior to Wednesday, April 9, 2025.
You
MUST UPGRADE YOUR MEMBERSHIP if you want to see any current reports.
AFTER MARKET UPDATE - TUESDAY, MARCH 2ND, 2010
Previous After Market Report Next After Market Report >>>
|
|
|
|
DOW |
+2.19 |
10,405.98 |
+0.02% |
|
Volume |
1,071,429,700 |
+11% |
|
Volume |
2,791,220,910 |
+12% |
|
NASDAQ |
+6.04 |
2,279.61 |
+0.27% |
|
Advancers |
2,125 |
68% |
|
Advancers |
1,794 |
64% |
|
S&P 500 |
+2.60 |
1,118.31 |
+0.23% |
|
Decliners |
891 |
28% |
|
Decliners |
904 |
32% |
|
Russell 2000 |
+5.66 |
648.31 |
+0.88% |
|
52 Wk Highs |
360 |
|
|
52 Wk Highs |
211 |
|
|
S&P 600 |
+2.86 |
344.39 |
+0.84% |
|
52 Wk Lows |
0 |
|
|
52 Wk Lows |
11 |
|
|
 |
Market Rally Confirmed But Cautious As Leadership Expands
Adam Sarhan, Contributing Writer,
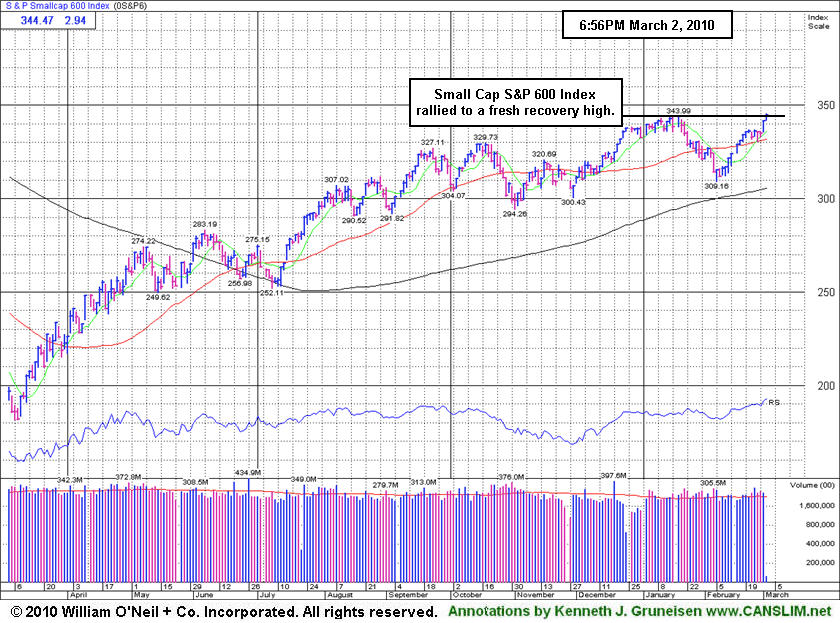
The paper categorized Monday's gain as a "cautious follow-through day" which confirmed the latest rally attempt. Stocks continued to edge higher on Tuesday amid news India's economy grew nicely last year and as speculation spread that the European Union will bail out Greece. Volume, a critical gauge of institutional demand, was reported higher than the prior session on the Nasdaq exchange and on the NYSE. Advancers led decliners by a more than a 2-to-1 ratio on the NYSE and by nearly a 2-to-1 ratio on the Nasdaq exchange. New 52-week highs overwhelmingly trumped new lows on both exchanges which was another welcome sign while there were 76 high-ranked companies from the CANSLIM.net Leaders List that made a new 52-week high and appeared on the CANSLIM.net BreakOuts Page, up from the 69 issues that appeared on the prior session.
India, one of the world's strongest emerging markets, said its economy rose nicely last quarter thanks in part to strong increases in manufacturing and exports. India, China and several other Asian economies have played a massive role in helping the global economy recover from one of the worst recessions since WWII. The healthy economic data from India helped support the notion that the global recovery would continue in 2010. Most of the US indexes erased their losses for the year and are now in positive territory. The recent batch of healthy economic and earnings data helped the S&P 500 recovery from a -9% slump. So far, over +460 companies in the benchmark index have reported quarterly earnings and approximately +75% have topped analysts' estimates. Barring some unforeseen event, the S&P 500 Index is on track to snap a record 9-quarter earnings slump.
Looking at the market, Monday, Day 16 of the latest rally attempt, confirmed the latest rally attempt when a "cautious follow-through day" was produced by the Nasdaq Composite Index. Weighing into the decision to label the day a follow-through-day (FTD) was the strong action in leading stocks along with a great expansion noted in the new highs list. That action suggests that there is a healthy crop of strong stocks capable of fueling a substantial rally higher for the major averages. We will be looking out for any near-term distribution days (high volume declines) which would hurt the chances for this nascent rally.
It is a welcome sign to see the market continue to improve as investors digest the latest round of stronger than expected economic and earnings data. Remember that now that a new rally has been confirmed, the window is open to start buying high quality breakouts. Trade accordingly.
Professional Money Management Services - A Winning System - Inquire today!
Our skilled team of portfolio managers knows how to follow the rules of this fact-based investment system. We do not follow opinion or the "conviction list" of some large Wall Street institution which would have us fully invested even during horrific bear markets. Instead, we remain fluid and only buy the best stocks when they are triggering proper technical buy signals. If you are not completely satisfied with the way your portfolio is being managed, Click here to get connected with one of our portfolio managers. *Accounts over $250,000 please. ** Serious inquires only, please.
PICTURED: The S&P 600 Small Cap Index rallied to a fresh recovery high on Tuesday. Such strength in the small cap index represents encouraging news for all fans of the fact-based system that focuses mostly on smaller growth stocks!
|
|
|
 |
Retail Index Pulled Back While Defensive Groups Led Gainers
Kenneth J. Gruneisen - Passed the CAN SLIM® Master's Exam
Defensive areas were among Tuesday's better gainers as the Gold & Silver Index ($XAU +2.35%), Healthcare Index ($HMO +1.07%), and Oil Services Index ($OSX +1.40%) each rose more than +1% and the Integrated Oil Index ($XOI +0.80%) also ended modestly higher. The Biotechnology Index ($BTK +2.18%) led the tech sector higher, meanwhile the Networking Index ($NWX +0.83%) and the Internet Index ($IIX +0.52%) posted smaller gains, but the Semiconductor Index ($SOX -0.03%) ended flat. Modest gains from the Broker/Dealer Index ($XBD +0.24%) and the Bank Index ($BKX +0.66%) were largely offset by weakness in the Retail Index ($RLX -0.82%).
Charts courtesy www.stockcharts.com
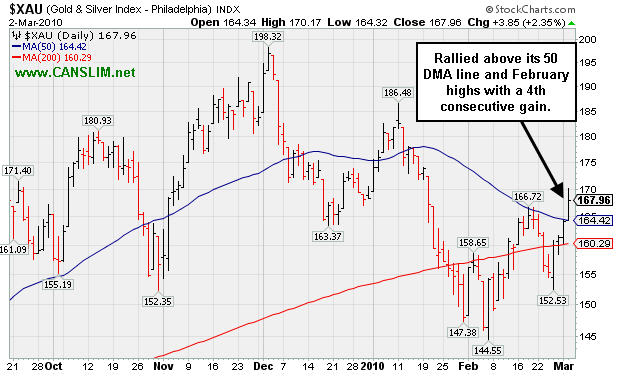
PICTURED: The Gold & Silver Index ($XAU +2.35%) rallied above its 50-day moving average (DMA) line and February highs with a 4th consecutive gain.
| Oil Services |
$OSX |
206.35 |
+2.84 |
+1.40% |
+5.86% |
| Healthcare |
$HMO |
1,454.80 |
+15.34 |
+1.07% |
-1.23% |
| Integrated Oil |
$XOI |
1,039.53 |
+8.24 |
+0.80% |
-2.68% |
| Semiconductor |
$SOX |
349.39 |
-0.09 |
-0.03% |
-2.92% |
| Networking |
$NWX |
241.32 |
+1.99 |
+0.83% |
+4.44% |
| Internet |
$IIX |
233.61 |
+1.20 |
+0.52% |
-0.11% |
| Broker/Dealer |
$XBD |
115.08 |
+0.28 |
+0.24% |
+0.03% |
| Retail |
$RLX |
424.79 |
-3.53 |
-0.82% |
+3.33% |
| Gold & Silver |
$XAU |
167.96 |
+3.85 |
+2.35% |
-0.17% |
| Bank |
$BKX |
47.55 |
+0.31 |
+0.66% |
+11.33% |
| Biotech |
$BTK |
1,124.03 |
+23.96 |
+2.18% |
+19.31% |
|
|
|
 |
Gain Above 50 DMA Line Helps, But More Time And Constructive Action Needed
Kenneth J. Gruneisen - Passed the CAN SLIM® Master's Exam
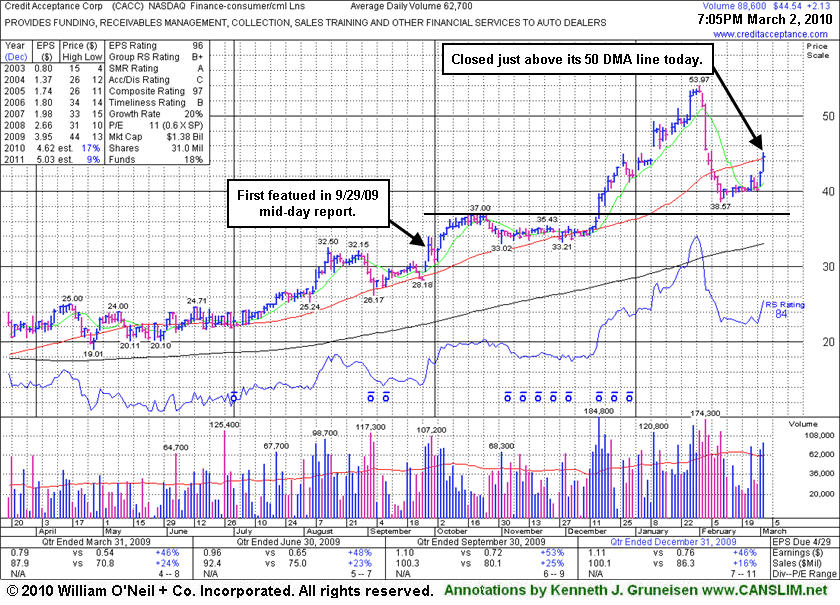
Credit Acceptance Corp (CACC +$2.13 or +5.02% to $44.54) rallied for a considerable gain today and closed just pennies above its 50-day moving average (DMA) line. The recent gains have helped its outlook improve, yet it still needs more time to build a new sound base before new buying efforts would be justifiable under the investment system's strict technical buying discipline. Its small supply (S criteria) of only 5.89 million shares in the public float could contribute to greater volatility in the event of any new institutional posturing. On Monday Jan 25th the company announced the pricing of $250 Million Senior Secured Notes, and it only rallied a little higher afterward before investors were prompted to consider locking in profits as worrisome distributional action transpired. The 50 DMA could act as a resistance level, whereas in the past it served as support. Continued progress above that short-term average is critical to its chances of eventually producing a new sound base and buy point. Its last FSU section appearance on 2/09/10 included an annotated graph under the headline "Damaging Losses Prompted Profit Taking".
The Finance - Consumer/Commercial Loans firm has maintained a great track record of annual and quarterly sales revenues and earnings increases that satisfy the C and A criteria of the investment system. It produced gains of as much as +61.2% since it was first featured in yellow at $33.48 in the 9/29/09 mid-day report (read here). After it was initially featured, it went on to later build a new sound base on top of its prior base. New pivot point and max buy levels were noted on 11/19/09, yet it stubbornly held its ground in a tight range for another month plus before finally blasting to new all-time highs with heavy volume on 12/16/09.
|
|
|
Color Codes Explained :
Y - Better candidates highlighted by our
staff of experts.
G - Previously featured
in past reports as yellow but may no longer be buyable under the
guidelines.
***Last / Change / Volume quote data in this table corresponds with the timestamp on the note***
Symbol/Exchange
Company Name
Industry Group |
Last |
Chg. |
Vol
% DAV |
Date Featured |
Price Featured |
Latest Pivot Point
Featured |
Status |
| Latest Max Buy Price |
ARST
-
|
$27.74
|
+0.19
|
176,954
46% DAV
387,100
|
2/24/2010
(Date
Featured) |
$25.94
(Price
Featured) |
PP = $27.95 |
Y |
| MB = $29.35 |
Most Recent Note - 3/2/2010 4:22:27 PM
Y - Gains on light volume this week have it approaching its pivot point after finding support at its 50 DMA line ($26.21 now). The recent chart low defines an important support level to watch.
>>> The latest Featured Stock Update with an annotated graph appeared on 2/17/2010. click here.
|
|
C
A
S
I |
News |
Chart |
SEC
View all notes Alert
me of new notes
Company
Profile
|
ARUN
- NASDAQ
Aruba Networks Inc
COMPUTER HARDWARE - Networking & Communication Dev
|
$12.28
|
+0.45
|
4,026,884
304% DAV
1,325,700
|
2/19/2010
(Date
Featured) |
$12.71
(Price
Featured) |
PP = $11.94 |
Y |
| MB = $12.54 |
Most Recent Note - 3/2/2010 4:26:04 PM
Y - Today's 3rd consecutive gain came with 3 times average volume, closing above its pivot point yet still below its "max buy" level. It found support above prior chart highs following its 2/19/10 gap up gain on heavy volume. ARUN was featured in the mid-day report on 2/19/10 as it rose from a flat base-on-base pattern above its 50-day moving average line (read here).
>>> The latest Featured Stock Update with an annotated graph appeared on 2/22/2010. click here.
|
|
C
A
S
I |
News |
Chart |
SEC
View all notes Alert
me of new notes
Company
Profile
|
BIDU
- NASDAQ
Baidu Inc Ads
INTERNET - Internet Information Providers
|
$518.88
|
-4.03
|
996,841
51% DAV
1,946,600
|
1/13/2010
(Date
Featured) |
$431.25
(Price
Featured) |
PP = $426.75 |
G |
| MB = $448.09 |
Most Recent Note - 3/2/2010 4:29:25 PM
G - Small loss today on lighter than average volume after a streak of light volume gains for new all-time highs. Extended above its mid-January highs now, it rose steadily since the 2/10/10 gap up gain with more than 3 times average volume.
>>> The latest Featured Stock Update with an annotated graph appeared on 2/11/2010. click here.
|
|
C
A
S
I |
News |
Chart |
SEC
View all notes Alert
me of new notes
Company
Profile
|
BRLI
- NASDAQ
Bio Reference Labs Inc
HEALTH SERVICES - Medical Laboratories & Researc
|
$41.97
|
+0.68
|
118,233
127% DAV
92,800
|
2/12/2010
(Date
Featured) |
$39.02
(Price
Featured) |
PP = $40.97 |
Y |
| MB = $43.02 |
Most Recent Note - 3/2/2010 4:34:16 PM
Y - Gapped up today and posted a gain with +27% above average volume for a new high. Like the prior session, volume was below the +50% above average guideline for a proper technical buy signal while wedging its way above its pivot point. Its Up/Down Volume Ratio of 2.3 is a bullish indicator This high-ranked Medical-Dental - Services firm was featured in yellow in the 2/12/10 mid-day report (read here).
>>> The latest Featured Stock Update with an annotated graph appeared on 3/1/2010. click here.
|
|
C
A
S
I |
News |
Chart |
SEC
View all notes Alert
me of new notes
Company
Profile
|
CACC
- NASDAQ
Credit Acceptance Corp
FINANCIAL SERVICES - Credit Services
|
$44.54
|
+2.13
|
89,322
142% DAV
62,700
|
9/29/2009
(Date
Featured) |
$33.48
(Price
Featured) |
PP = $37.10 |
G |
| MB = $38.96 |
Most Recent Note - 3/2/2010 4:43:10 PM
G - Today it posted its 3rd big gain on heavy volume in the past 5 sessions, rallying back to close just narrowly above its 50 DMA line. Recent lows are a nearby chart support level to watch just above its old chart highs in the $37 area.
>>> The latest Featured Stock Update with an annotated graph appeared on 3/2/2010. click here.
|
|
C
A
S
I |
News |
Chart |
SEC
View all notes Alert
me of new notes
Company
Profile
|
CRM
- NYSE
Salesforce.com Inc
INTERNET - Internet Software & Services
|
$71.84
|
+0.94
|
2,020,151
97% DAV
2,087,000
|
12/18/2009
(Date
Featured) |
$67.32
(Price
Featured) |
PP = $67.82 |
G |
| MB = $71.21 |
Most Recent Note - 3/2/2010 4:46:29 PM
G - Rose further above its 50 DMA line today with a gain on average volume, rallying toward its all-time high. Recent chart low ($64.77 on 2/25/10) is now an important support level to watch.
>>> The latest Featured Stock Update with an annotated graph appeared on 2/10/2010. click here.
|
|
C
A
S
I |
News |
Chart |
SEC
View all notes Alert
me of new notes
Company
Profile
|
CTRP
- NASDAQ
Ctrip.com Intl Ltd Adr
LEISURE - Resorts & Casinos
|
$37.93
|
-1.14
|
2,266,339
108% DAV
2,104,500
|
3/1/2010
(Date
Featured) |
$38.23
(Price
Featured) |
PP = $38.50 |
Y |
| MB = $40.43 |
Most Recent Note - 3/2/2010 4:49:17 PM
Y - Today it pulled back after reaching a new all-time high on the prior session. The 3/01/10 gain above its pivot point did not meet the minimum volume threshold of +50% above average volume required for a proper technical buy signal. Featured in the new March 2010 issue of CANSLIM.net News (read here).
>>> The latest Featured Stock Update with an annotated graph appeared on 2/28/2010. click here.
|
|
C
A
S
I |
News |
Chart |
SEC
View all notes Alert
me of new notes
Company
Profile
|
EZPW
- NASDAQ
Ezcorp Inc Cl A
SPECIALTY RETAIL - Specialty Retail, Other
|
$20.45
|
+0.39
|
817,919
179% DAV
457,600
|
2/19/2010
(Date
Featured) |
$19.03
(Price
Featured) |
PP = $18.80 |
G |
| MB = $19.74 |
Most Recent Note - 3/2/2010 4:53:45 PM
G - A second consecutive gain with above average volume lifted it above its "max buy" level for a new all-time high. Extended from its prior chart highs in the $18 area that define an important support level to watch. Featured in yellow in the 2/19/10 mid-day report (read here).
>>> The latest Featured Stock Update with an annotated graph appeared on 2/19/2010. click here.
|
|
C
A
S
I |
News |
Chart |
SEC
View all notes Alert
me of new notes
Company
Profile
|
GMCR
- NASDAQ
Green Mtn Coffee Roastrs
FOOD & BEVERAGE - Processed & Packaged Goods
|
$87.89
|
+4.28
|
3,971,853
280% DAV
1,416,200
|
2/26/2010
(Date
Featured) |
$84.39
(Price
Featured) |
PP = $88.75 |
Y |
| MB = $93.19 |
Most Recent Note - 3/2/2010 5:00:40 PM
Y - Today's considerable gain with volume nearly 3 times average helped it trade above its pivot point for a new all-time high. It closed in the upper half of its intra-day range, but ended below its pivot point, leaving concerns. Keep in mind that GMCR has formed a "late-stage" base after showing up as a fresh buy candidate long ago in CANSLIM.net reports. Important initial support level to watch is its 50 DMA line and recent lows near the $80 area.
>>> The latest Featured Stock Update with an annotated graph appeared on 2/23/2010. click here.
|
|
C
A
S
I |
News |
Chart |
SEC
View all notes Alert
me of new notes
Company
Profile
|
ISRG
- NASDAQ
Intuitive Surgical Inc
HEALTH SERVICES - Medical Appliances & Equipment
|
$361.30
|
+2.67
|
654,537
128% DAV
511,500
|
1/22/2010
(Date
Featured) |
$340.40
(Price
Featured) |
PP = $314.00 |
G |
| MB = $329.70 |
Most Recent Note - 3/2/2010 5:08:17 PM
G - Gain today on +28% above average volume for a new 52-week and new all-time high. Extended above its prior chart highs. ISRG was featured at $340.40 in the 1/22/10 mid-day report following a powerful breakaway gap (read here).
>>> The latest Featured Stock Update with an annotated graph appeared on 2/24/2010. click here.
|
|
C
A
S
I |
News |
Chart |
SEC
View all notes Alert
me of new notes
Company
Profile
|
PCLN
- NASDAQ
Priceline.com Inc
INTERNET - Internet Software & Services
|
$399.55
|
-4.72
|
584,812
N/A
|
11/1/2002
(Date
Featured) |
$399.55
(Price
Featured) |
PP = $428.20 |
Y |
| MB = $449.61 |
Most Recent Note - 1/2/2011
Y - Returns to Featured Stocks list with its appearance in the January 2011 CANSLIM.net News including detailed analysis and annotated daily and weekly graphs.
>>> The latest Featured Stock Update with an annotated graph appeared on 2/18/2010. click here.
|
|
C
A
S
I |
News |
Chart |
SEC
View all notes Alert
me of new notes
Company
Profile
|
PEGA
- NASDAQ
Pegasystems Inc
COMPUTER SOFTWARE & SERVICES - Business Software & Services
|
$35.63
|
-0.40
|
193,536
96% DAV
202,500
|
2/26/2010
(Date
Featured) |
$36.00
(Price
Featured) |
PP = $38.55 |
Y |
| MB = $40.48 |
Most Recent Note - 3/2/2010 5:50:35 PM
Y - Small loss on light volume today, quietly consolidating just above its 50 DMA line. Positively reversed on 2/23/10 after a brief 50 DMA line violation, finding prompt support near prior chart lows in the $32 area.
>>> The latest Featured Stock Update with an annotated graph appeared on 2/26/2010. click here.
|
|
C
A
S
I |
News |
Chart |
SEC
View all notes Alert
me of new notes
Company
Profile
|
ROVI
- NASDAQ
Rovi Corp
COMPUTER SOFTWARE & SERVICES - Security Software & Services
|
$34.75
|
+1.32
|
3,105,577
306% DAV
1,013,300
|
2/25/2010
(Date
Featured) |
$33.54
(Price
Featured) |
PP = $34.87 |
Y |
| MB = $36.61 |
Most Recent Note - 3/2/2010 5:52:52 PM
Y - A considerable gain today with volume more than 2 times average triggered a technical buy signal as it rallied above its pivot point and hit a new 52-week high. Announced news after Monday's close about an expansion of its relationship with Comcast (read here). Featured on 2/25/10 in yellow in the mid-day report (read here).
>>> The latest Featured Stock Update with an annotated graph appeared on 2/25/2010. click here.
|
|
C
A
S
I |
News |
Chart |
SEC
View all notes Alert
me of new notes
Company
Profile
|
SIRO
- NASDAQ
Sirona Dental Systems
HEALTH SERVICES - Medical Instruments & Supplies
|
$37.43
|
+0.84
|
1,122,203
208% DAV
538,800
|
2/16/2010
(Date
Featured) |
$36.43
(Price
Featured) |
PP = $36.15 |
Y |
| MB = $37.96 |
Most Recent Note - 3/2/2010 5:56:19 PM
Y - Hit a new 52-week high today with a gain on 2 times average volume while posting its 5th consecutive gain on ever-increasing volume, closing just below its "max buy" level. It was featured in yellow in the 2/16/10 mid-day report (read here) as it broke out from a 10-week flat base.
>>> The latest Featured Stock Update with an annotated graph appeared on 2/16/2010. click here.
|
|
C
A
S
I |
News |
Chart |
SEC
View all notes Alert
me of new notes
Company
Profile
|
VPRT
- NASDAQ
Vistaprint Nv
DIVERSIFIED SERVICES - Business/Management Services
|
$59.47
|
+0.31
|
804,274
168% DAV
477,400
|
3/1/2010
(Date
Featured) |
$57.72
(Price
Featured) |
PP = $59.70 |
Y |
| MB = $62.69 |
Most Recent Note - 3/2/2010 6:00:06 PM
Y - Hit a new all-time high today after a small gap up gain, yet it lacked great volume conviction and closed below its pivot point near the session low with only a small gain. Featured in the March 2010 CANSLIM.net News monthly newsletter (read here).
>>> The latest Featured Stock Update with an annotated graph appeared on 2/28/2010. click here.
|
|
C
A
S
I |
News |
Chart |
SEC
View all notes Alert
me of new notes
Company
Profile
|
|
|
|
THESE ARE NOT BUY RECOMMENDATIONS!
Comments contained in the body of this report are technical
opinions only. The material herein has been obtained
from sources believed to be reliable and accurate, however,
its accuracy and completeness cannot be guaranteed.
This site is not an investment advisor, hence it does
not endorse or recommend any securities or other investments.
Any recommendation contained in this report may not
be suitable for all investors and it is not to be deemed
an offer or solicitation on our part with respect to
the purchase or sale of any securities. All trademarks,
service marks and trade names appearing in this report
are the property of their respective owners, and are
likewise used for identification purposes only.
This report is a service available
only to active Paid Premium Members.
You may opt-out of receiving report notifications
at any time. Questions or comments may be submitted
by writing to Premium Membership Services 665 S.E. 10 Street, Suite 201 Deerfield Beach, FL 33441-5634 or by calling 1-800-965-8307
or 954-785-1121.
|
|
|


