Symbol/Exchange
Company Name
Industry Group |
PRICE |
CHANGE
(%Change) |
Day High |
Volume
(% DAV)
(% 50 day avg vol) |
52 Wk Hi
% From Hi |
Featured
Date |
Price
Featured |
Pivot Featured |
|
Max Buy |
ADS
-
NYSE
Alliance Data Sys Corp
COMPUTER SOFTWARE and SERVICES - Information and Delivery Service
|
$120.70
|
-1.08
-0.89% |
$122.07
|
540,405
78.97% of 50 DAV
50 DAV is 684,300
|
$122.62
-1.57%
|
1/17/2012
|
$108.24
|
PP = $107.43
|
|
MB = $112.80
|
Most Recent Note - 2/29/2012 7:52:47 PM
G - Quietly holding its ground near its all-time high, extended from its latest base. Fundamental concerns were raised by earnings below the +25% guideline in the latest quarter ended December 31, 2011. See the latest FSU analysis for more details and a new annotated graph.
>>> The latest Featured Stock Update with an annotated graph appeared on 2/29/2012. Click here.
View all notes |
Alert me of new notes |
CANSLIM.net Company Profile |
SEC |
Zacks Reports |
StockTalk |
News |
Chart |
Request a new note
C
A N
S L
I M


|
ALXN
-
NASDAQ
Alexion Pharmaceuticals
DRUGS - Drug Manufacturers - Other
|
$85.26
|
+0.72
0.85% |
$85.28
|
1,256,882
101.85% of 50 DAV
50 DAV is 1,234,100
|
$87.63
-2.70%
|
11/30/2011
|
$68.66
|
PP = $70.52
|
|
MB = $74.05
|
Most Recent Note - 3/1/2012 5:13:44 PM
G - Holding its ground stubbornly with volume totals cooling after volume-driven gains for new all-time highs last week. It is extended from its prior base, and near-term support to watch is its 50 DMA line.
>>> The latest Featured Stock Update with an annotated graph appeared on 2/24/2012. Click here.
View all notes |
Alert me of new notes |
CANSLIM.net Company Profile |
SEC |
Zacks Reports |
StockTalk |
News |
Chart |
Request a new note
C
A N
S L
I M
|
BODY
-
NASDAQ
Body Central Corp
RETAIL - Catalog andamp; Mail Order Houses
|
$27.68
|
-1.22
-4.22% |
$29.25
|
341,488
188.77% of 50 DAV
50 DAV is 180,900
|
$29.49
-6.14%
|
1/27/2012
|
$26.69
|
PP = $25.46
|
|
MB = $26.73
|
 Most Recent Note - 3/2/2012 4:03:05 PM
G - Abruptly reversing the prior session's gain with a loss today on above average volume. It is extended from its prior base. An upward trendline connecting its Nov-Feb lows defines initial chart support to watch above its 50 DMA line and prior highs in the $26 area.
>>> The latest Featured Stock Update with an annotated graph appeared on 1/27/2012. Click here.
View all notes |
Alert me of new notes |
CANSLIM.net Company Profile |
SEC |
Zacks Reports |
StockTalk |
News |
Chart |
Request a new note
C
A N
S L
I M
|
CATM
-
NASDAQ
Cardtronics Inc
DIVERSIFIED SERVICES - Business/Management Services
|
$27.66
|
-0.61
-2.14% |
$28.50
|
451,440
110.24% of 50 DAV
50 DAV is 409,500
|
$28.74
-3.76%
|
2/24/2012
|
$27.94
|
PP = $28.30
|
|
MB = $29.72
|
Most Recent Note - 3/2/2012 4:09:36 PM
Y - Pulled back today while perched near its pivot point cited, not yet triggering a technical buy signal by clearing its "double bottom" base formed over the past 10 weeks during which it found prompt support at its 200 DMA line. Disciplined investors resist the urge to get in early while confirming gains are still needed.
>>> The latest Featured Stock Update with an annotated graph appeared on 1/30/2012. Click here.
View all notes |
Alert me of new notes |
CANSLIM.net Company Profile |
SEC |
Zacks Reports |
StockTalk |
News |
Chart |
Request a new note
C
A N
S L
I M
|
CDNS
-
NASDAQ
Cadence Design Systems
COMPUTER SOFTWARE and SERVICES - Technical and System Software
|
$11.63
|
-0.29
-2.43% |
$11.95
|
2,428,548
79.84% of 50 DAV
50 DAV is 3,041,900
|
$12.11
-3.96%
|
2/3/2012
|
$11.66
|
PP = $11.15
|
|
MB = $11.71
|
Most Recent Note - 3/2/2012 4:13:40 PM
Y - Recently stalled after rallying to new highs, clear of overhead supply. Color code is changed to yellow after a light volume loss today, finishing below its "max buy" level, while no new pivot point is cited.
>>> The latest Featured Stock Update with an annotated graph appeared on 2/3/2012. Click here.
View all notes |
Alert me of new notes |
CANSLIM.net Company Profile |
SEC |
Zacks Reports |
StockTalk |
News |
Chart |
Request a new note
C
A N
S L
I M
|
Symbol/Exchange
Company Name
Industry Group |
PRICE |
CHANGE
(%Change) |
Day High |
Volume
(% DAV)
(% 50 day avg vol) |
52 Wk Hi
% From Hi |
Featured
Date |
Price
Featured |
Pivot Featured |
|
Max Buy |
CELG
-
NASDAQ
Celgene Corp
DRUGS - Drug Manufacturers - Major
|
$73.73
|
-0.19
-0.26% |
$73.97
|
2,233,806
70.32% of 50 DAV
50 DAV is 3,176,600
|
$76.09
-3.10%
|
2/2/2012
|
$74.16
|
PP = $75.21
|
|
MB = $78.97
|
Most Recent Note - 3/2/2012 4:15:54 PM
Y - Encountered mild distributional pressure this week while slumping below its pivot point. Within striking distance of its all-time high ($77.39 in Aug '08). Any subsequent volume-driven gains would be a reassuring sign of fresh institutional demand, meanwhile its 50 DMA line and prior lows in the $71 area now coincide and define important chart support to watch.
>>> The latest Featured Stock Update with an annotated graph appeared on 2/2/2012. Click here.
View all notes |
Alert me of new notes |
CANSLIM.net Company Profile |
SEC |
Zacks Reports |
StockTalk |
News |
Chart |
Request a new note
C
A N
S L
I M
|
ECHO
-
NASDAQ
Echo Global Logistics
DIVERSIFIED SERVICES - Business/Management Services
|
$18.72
|
+0.12
0.65% |
$19.00
|
161,510
236.82% of 50 DAV
50 DAV is 68,200
|
$19.38
-3.41%
|
2/22/2012
|
$18.50
|
PP = $18.63
|
|
MB = $19.56
|
Most Recent Note - 3/2/2012 12:17:47 PM
Y - Following a gap down with heavy volume on 2/29/12 it is stubbornly holding its ground just -2.3% off its all-time high with no resistance remaining due to overhead supply. It has been consolidating below its "max buy" level after breaking out from a large cup shaped base.
>>> The latest Featured Stock Update with an annotated graph appeared on 2/23/2012. Click here.
View all notes |
Alert me of new notes |
CANSLIM.net Company Profile |
SEC |
Zacks Reports |
StockTalk |
News |
Chart |
Request a new note
C
A N
S L
I M
|
FEIC
-
NASDAQ
F E I Co
ELECTRONICS - Diversified Electronics
|
$43.52
|
-1.48
-3.29% |
$45.04
|
375,409
130.94% of 50 DAV
50 DAV is 286,700
|
$48.31
-9.92%
|
12/7/2011
|
$41.41
|
PP = $42.35
|
|
MB = $44.47
|
Most Recent Note - 3/2/2012 4:22:25 PM
G - Slumped below its 50 DMA line today and finished near the session low with a loss on average volume, raising concerns. Only a prompt rebound above its short term average would help its outlook, and any further deterioration may trigger a more worrisome technical sell signal. Recently reported +21% earnings for Dec '11 quarter, below the +25% minimum guideline for earnings growth.
>>> The latest Featured Stock Update with an annotated graph appeared on 1/25/2012. Click here.
View all notes |
Alert me of new notes |
CANSLIM.net Company Profile |
SEC |
Zacks Reports |
StockTalk |
News |
Chart |
Request a new note
C
A N
S L
I M
|
GNC
-
NYSE
G N C Holdings Inc
RETAIL - Drug Stores
|
$31.97
|
-0.47
-1.45% |
$32.10
|
1,195,718
122.66% of 50 DAV
50 DAV is 974,800
|
$33.70
-5.13%
|
1/19/2012
|
$28.99
|
PP = $29.60
|
|
MB = $31.08
|
Most Recent Note - 3/2/2012 4:23:56 PM
G - Small gap down and loss today with slightly above average volume. Prior highs in the $29.50 area define support to watch on pullbacks.
>>> The latest Featured Stock Update with an annotated graph appeared on 1/19/2012. Click here.
View all notes |
Alert me of new notes |
CANSLIM.net Company Profile |
SEC |
Zacks Reports |
StockTalk |
News |
Chart |
Request a new note
C
A N
S L
I M
|
GOLD
-
NASDAQ
Randgold Resources Adr
METALS and MINING - Gold
|
$114.02
|
-1.96
-1.69% |
$114.97
|
284,024
63.77% of 50 DAV
50 DAV is 445,400
|
$120.73
-5.56%
|
2/7/2012
|
$116.21
|
PP = $120.83
|
|
MB = $126.87
|
Most Recent Note - 3/1/2012 5:23:17 PM
Y - Posted a gain on lighter volume today following a distributional loss with above average volume on the prior session while perched within close striking distance of prior highs. Subsequent volume-driven gains into new high territory may trigger a technical buy signal, however such convincing gains have not yet confirmed a fresh burst of great institutional buying demand. Meanwhile its 88 Relative Strength Rating is above the 80+ guideline for buy candidates, but its Relative Strength line was plotted higher later last year.
>>> The latest Featured Stock Update with an annotated graph appeared on 2/8/2012. Click here.
View all notes |
Alert me of new notes |
CANSLIM.net Company Profile |
SEC |
Zacks Reports |
StockTalk |
News |
Chart |
Request a new note
C
A N
S L
I M
|
Symbol/Exchange
Company Name
Industry Group |
PRICE |
CHANGE
(%Change) |
Day High |
Volume
(% DAV)
(% 50 day avg vol) |
52 Wk Hi
% From Hi |
Featured
Date |
Price
Featured |
Pivot Featured |
|
Max Buy |
HLF
-
NYSE
Herbalife Ltd
DRUGS - Nutrition and Weight Management
|
$67.46
|
-0.24
-0.35% |
$68.01
|
960,305
77.35% of 50 DAV
50 DAV is 1,241,500
|
$67.73
-0.40%
|
2/22/2012
|
$65.90
|
PP = $63.50
|
|
MB = $66.68
|
Most Recent Note - 3/1/2012 5:26:08 PM
G - Small gain today with above average volume, inching higher after stubbornly holding its ground in a very tight range since its 2/22/12 gain triggered a technical buy signal. Color code is changed to green after rising above its "max buy" level, getting extended from its prior base pattern. Prior highs in the $63 area define support to watch on pullbacks.
>>> The latest Featured Stock Update with an annotated graph appeared on 2/22/2012. Click here.
View all notes |
Alert me of new notes |
CANSLIM.net Company Profile |
SEC |
Zacks Reports |
StockTalk |
News |
Chart |
Request a new note
C
A N
S L
I M
|
HMSY
-
NASDAQ
H M S Holdings Corp
COMPUTER SOFTWARE and SERVICES - Healthcare Information Service
|
$30.81
|
-1.30
-4.05% |
$32.10
|
1,024,644
155.82% of 50 DAV
50 DAV is 657,600
|
$34.98
-11.91%
|
10/27/2011
|
$26.44
|
PP = $28.37
|
|
MB = $29.79
|
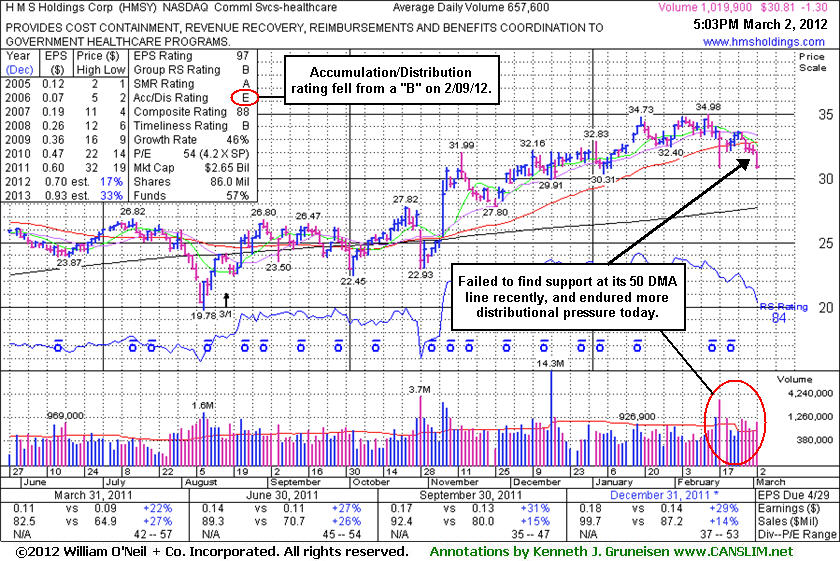
Most Recent Note - 3/2/2012 4:29:58 PM
Finished near the session low today with another damaging loss on above average volume. It failed to find support at its 50 DMA line, and only a rebound above that short-term average would help its outlook improve. Based on its technical deterioration it will be dropped from the Featured Stocks list tonight.
>>> The latest Featured Stock Update with an annotated graph appeared on 3/2/2012. Click here.
View all notes |
Alert me of new notes |
CANSLIM.net Company Profile |
SEC |
Zacks Reports |
StockTalk |
News |
Chart |
Request a new note
C
A N
S L
I M
|
ISRG
-
NASDAQ
Intuitive Surgical Inc
HEALTH SERVICES - Medical Appliances and Equipment
|
$516.91
|
-4.42
-0.85% |
$523.10
|
240,210
65.92% of 50 DAV
50 DAV is 364,400
|
$521.50
-0.88%
|
12/20/2011
|
$442.43
|
PP = $449.16
|
|
MB = $471.62
|
Most Recent Note - 3/1/2012 6:28:51 PM
G - Recently wedged to new all-time highs without great volume conviction and it is extended from prior highs in the $475 area that define support to watch on pullbacks. December '11 quarterly earnings increased by just below the borderline +25% minimum guideline for ideal buy candidates. See the latest FSU analysis for more details and a new annotated graph.
>>> The latest Featured Stock Update with an annotated graph appeared on 3/1/2012. Click here.
View all notes |
Alert me of new notes |
CANSLIM.net Company Profile |
SEC |
Zacks Reports |
StockTalk |
News |
Chart |
Request a new note
C
A N
S L
I M
|
LULU
-
NASDAQ
Lululemon Athletica
MANUFACTURING - Textile Manufacturing
|
$70.48
|
-0.38
-0.54% |
$71.41
|
1,807,456
76.10% of 50 DAV
50 DAV is 2,375,200
|
$70.98
-0.70%
|
1/10/2012
|
$60.97
|
PP = $59.46
|
|
MB = $62.43
|
Most Recent Note - 3/1/2012 2:36:27 PM
G - Considerable volume-driven gain today, getting more extended from its prior highs and hitting another new all-time high. Prior highs in the $61-64 area define initial chart support to watch on pullbacks.
>>> The latest Featured Stock Update with an annotated graph appeared on 2/21/2012. Click here.
View all notes |
Alert me of new notes |
CANSLIM.net Company Profile |
SEC |
Zacks Reports |
StockTalk |
News |
Chart |
Request a new note
C
A N
S L
I M
|
MA
-
NYSE
Mastercard Inc Cl A
DIVERSIFIED SERVICES - Business/Management Services
|
$412.78
|
-7.65
-1.82% |
$419.47
|
965,198
87.14% of 50 DAV
50 DAV is 1,107,700
|
$428.57
-3.68%
|
2/2/2012
|
$379.05
|
PP = $381.32
|
|
MB = $400.39
|
Most Recent Note - 2/29/2012 5:01:14 PM
G - Reversed into the red after inching further into new all-time high territory earlier today. Prior highs in the $381-384 area define support to watch on pullbacks.
>>> The latest Featured Stock Update with an annotated graph appeared on 2/17/2012. Click here.
View all notes |
Alert me of new notes |
CANSLIM.net Company Profile |
SEC |
Zacks Reports |
StockTalk |
News |
Chart |
Request a new note
C
A N
S L
I M
|
Symbol/Exchange
Company Name
Industry Group |
PRICE |
CHANGE
(%Change) |
Day High |
Volume
(% DAV)
(% 50 day avg vol) |
52 Wk Hi
% From Hi |
Featured
Date |
Price
Featured |
Pivot Featured |
|
Max Buy |
MELI
-
NASDAQ
Mercadolibre Inc
INTERNET - Internet Software and; Services
|
$99.90
|
+2.23
2.28% |
$102.14
|
514,871
98.30% of 50 DAV
50 DAV is 523,800
|
$104.50
-4.40%
|
2/6/2012
|
$97.09
|
PP = $95.58
|
|
MB = $100.36
|
Most Recent Note - 3/2/2012 1:41:08 PM
Y - Up today, yet off earlier highs after briefly trading above its "max buy" level. Prior highs in the $95 area define initial chart support to watch on pullbacks.
>>> The latest Featured Stock Update with an annotated graph appeared on 2/6/2012. Click here.
View all notes |
Alert me of new notes |
CANSLIM.net Company Profile |
SEC |
Zacks Reports |
StockTalk |
News |
Chart |
Request a new note
C
A N
S L
I M
|
MKTX
-
NASDAQ
Marketaxess Holdings Inc
FINANCIAL SERVICES - Investment Brokerage - Nationa
|
$34.30
|
+0.47
1.39% |
$34.91
|
248,433
101.57% of 50 DAV
50 DAV is 244,600
|
$35.42
-3.16%
|
10/28/2011
|
$29.79
|
PP = $31.05
|
|
MB = $32.60
|
Most Recent Note - 3/2/2012 1:48:00 PM
G - Perched within close striking distance of its all-time high with no resistance remaining. It completed a Secondary Offering on 2/22/12 and found prompt support near its 50 DMA line during its 4-week consolidation.
>>> The latest Featured Stock Update with an annotated graph appeared on 1/24/2012. Click here.
View all notes |
Alert me of new notes |
CANSLIM.net Company Profile |
SEC |
Zacks Reports |
StockTalk |
News |
Chart |
Request a new note
C
A N
S L
I M
|
RAX
-
NYSE
Rackspace Hosting Inc
INTERNET - Internet Software and; Services
|
$54.42
|
+1.85
3.52% |
$55.65
|
2,726,463
140.31% of 50 DAV
50 DAV is 1,943,200
|
$56.94
-4.43%
|
2/2/2012
|
$46.69
|
PP = $45.55
|
|
MB = $47.83
|
Most Recent Note - 3/2/2012 12:51:25 PM
G - Considerable gain today, rallying near its best-ever close and on track for its 6th consecutive weekly gain. Repeatedly noted following a considerable 2/14/12 gap up gain with very heavy volume - "Too extended from the previous base to be considered an ideal buy candidate under the fact-based investment system's guidelines."
>>> The latest Featured Stock Update with an annotated graph appeared on 2/16/2012. Click here.
View all notes |
Alert me of new notes |
CANSLIM.net Company Profile |
SEC |
Zacks Reports |
StockTalk |
News |
Chart |
Request a new note
C
A N
S L
I M
|
RRTS
-
NYSE
Roadrunner Trans Systems
TRANSPORTATION - Air Delivery and Freight Service
|
$17.61
|
-0.41
-2.28% |
$18.06
|
44,804
31.33% of 50 DAV
50 DAV is 143,000
|
$18.44
-4.50%
|
2/10/2012
|
$17.40
|
PP = $17.50
|
|
MB = $18.38
|
Most Recent Note - 3/2/2012 4:33:06 PM
Y - Slumped to a close near its 2-week low and near its pivot point today with a loss on light volume. Prior highs in the $17 area define initial support to watch on pullbacks.
>>> The latest Featured Stock Update with an annotated graph appeared on 2/13/2012. Click here.
View all notes |
Alert me of new notes |
CANSLIM.net Company Profile |
SEC |
Zacks Reports |
StockTalk |
News |
Chart |
Request a new note
C
A N
S L
I M
|
SWI
-
NYSE
Solarwinds Inc
COMPUTER SOFTWARE and SERVICES - Application Software
|
$38.50
|
+0.14
0.36% |
$38.95
|
787,638
69.25% of 50 DAV
50 DAV is 1,137,400
|
$39.75
-3.14%
|
1/26/2012
|
$32.36
|
PP = $33.78
|
|
MB = $35.47
|
Most Recent Note - 3/1/2012 5:07:07 PM
G - Posted a solid gain today on higher volume following 4 consecutive small losses on light volume while retreating from its all-time high. It is extended from its latest base. Earnings below the +25% guideline for the Dec '11 quarter raised fundamental concerns.
>>> The latest Featured Stock Update with an annotated graph appeared on 1/26/2012. Click here.
View all notes |
Alert me of new notes |
CANSLIM.net Company Profile |
SEC |
Zacks Reports |
StockTalk |
News |
Chart |
Request a new note
C
A N
S L
I M
|
Symbol/Exchange
Company Name
Industry Group |
PRICE |
CHANGE
(%Change) |
Day High |
Volume
(% DAV)
(% 50 day avg vol) |
52 Wk Hi
% From Hi |
Featured
Date |
Price
Featured |
Pivot Featured |
|
Max Buy |
SXCI
-
NASDAQ
S X C Health Solutions
COMPUTER SOFTWARE and SERVICES - Healthcare Information Service
|
$71.70
|
-0.45
-0.62% |
$72.15
|
442,181
118.77% of 50 DAV
50 DAV is 372,300
|
$72.73
-1.42%
|
2/23/2012
|
$68.24
|
PP = $66.05
|
|
MB = $69.35
|
Most Recent Note - 2/29/2012 4:41:54 PM
G - Holding its ground after getting extended beyond its "max buy" level with 5 consecutive volume-driven gains. Prior highs in the $66 area define support to watch on pullbacks.
>>> The latest Featured Stock Update with an annotated graph appeared on 1/20/2012. Click here.
View all notes |
Alert me of new notes |
CANSLIM.net Company Profile |
SEC |
Zacks Reports |
StockTalk |
News |
Chart |
Request a new note
C
A N
S L
I M
|
TDG
-
NYSE
Transdigm Group Inc
AEROSPACE/DEFENSE - Aerospace/Defense Products and; Services
|
$114.99
|
-2.12
-1.81% |
$117.64
|
669,082
186.17% of 50 DAV
50 DAV is 359,400
|
$121.48
-5.34%
|
2/29/2012
|
$120.10
|
PP = $118.93
|
|
MB = $124.88
|
Most Recent Note - 3/2/2012 1:12:13 PM
Y - A volume-driven gain for a strong close above it pivot point did not confirm a new (or-add on) technical buy signal. Instead, it is encountering distributional pressure after the previously noted advanced "3-weeks tight" base pattern. Prior highs near $102 define the initial support level to watch above its 50 DMA line.
>>> The latest Featured Stock Update with an annotated graph appeared on 2/10/2012. Click here.
View all notes |
Alert me of new notes |
CANSLIM.net Company Profile |
SEC |
Zacks Reports |
StockTalk |
News |
Chart |
Request a new note
C
A N
S L
I M
|
TNGO
-
NASDAQ
Tangoe Inc
COMPUTER SOFTWARE and SERVICES - Technical and System Software
|
$18.21
|
-0.41
-2.20% |
$18.83
|
418,358
134.09% of 50 DAV
50 DAV is 312,000
|
$19.90
-8.49%
|
2/13/2012
|
$15.39
|
PP = $16.51
|
|
MB = $17.34
|
Most Recent Note - 3/2/2012 4:36:22 PM
G - Down today for its 5th consecutive loss, 4 of which were marked by above average volume. Remains above its "max buy" level and extended from prior highs in the $16 area which define initial support to watch on pullbacks.
>>> The latest Featured Stock Update with an annotated graph appeared on 2/14/2012. Click here.
View all notes |
Alert me of new notes |
CANSLIM.net Company Profile |
SEC |
Zacks Reports |
StockTalk |
News |
Chart |
Request a new note
C
A N
S L
I M
|
TSCO
-
NASDAQ
Tractor Supply Co
SPECIALTY RETAIL - Specialty Retail, Other
|
$86.61
|
-0.89
-1.02% |
$87.84
|
329,025
45.48% of 50 DAV
50 DAV is 723,400
|
$88.65
-2.30%
|
1/12/2012
|
$79.12
|
PP = $75.58
|
|
MB = $79.36
|
Most Recent Note - 3/2/2012 4:40:27 PM
G - Down today on light volume. It is extended from a sound base after tallying 5 weekly gains in the span of 6 weeks. Its 50 DMA line defines support to watch on pullbacks.
>>> The latest Featured Stock Update with an annotated graph appeared on 2/27/2012. Click here.
View all notes |
Alert me of new notes |
CANSLIM.net Company Profile |
SEC |
Zacks Reports |
StockTalk |
News |
Chart |
Request a new note
C
A N
S L
I M
|
UA
-
NYSE
Under Armour Inc Cl A
CONSUMER NON-DURABLES - Textile - Apparel Clothing
|
$92.22
|
+0.10
0.11% |
$92.62
|
979,853
78.16% of 50 DAV
50 DAV is 1,253,600
|
$92.29
-0.08%
|
2/15/2012
|
$85.77
|
PP = $84.86
|
|
MB = $89.10
|
Most Recent Note - 3/1/2012 5:10:04 PM
G - Color code is changed to green after rallying above its "max buy" level with today's 5th consecutive gain above its pivot point which again did not have volume sufficient to trigger a proper technical buy signal. Pyramiding into a stock can help investors avoid chasing them too far above their pivot point.
>>> The latest Featured Stock Update with an annotated graph appeared on 2/15/2012. Click here.
View all notes |
Alert me of new notes |
CANSLIM.net Company Profile |
SEC |
Zacks Reports |
StockTalk |
News |
Chart |
Request a new note
C
A N
S L
I M
|
Symbol/Exchange
Company Name
Industry Group |
PRICE |
CHANGE
(%Change) |
Day High |
Volume
(% DAV)
(% 50 day avg vol) |
52 Wk Hi
% From Hi |
Featured
Date |
Price
Featured |
Pivot Featured |
|
Max Buy |
UBNT
-
NASDAQ
Ubiquiti Networks Inc
TELECOMMUNICATIONS - Diversified Communication Serv
|
$25.99
|
+0.97
3.88% |
$26.72
|
607,387
207.87% of 50 DAV
50 DAV is 292,200
|
$28.97
-10.29%
|
1/27/2012
|
$22.25
|
PP = $23.14
|
|
MB = $24.30
|
Most Recent Note - 3/2/2012 1:14:13 PM
G - Rallying today with above average volume following 3 consecutive losses. It is still extended from its prior base. Patient investors may watch for secondary buy points to possibly develop and be noted.
>>> The latest Featured Stock Update with an annotated graph appeared on 2/1/2012. Click here.
View all notes |
Alert me of new notes |
CANSLIM.net Company Profile |
SEC |
Zacks Reports |
StockTalk |
News |
Chart |
Request a new note
C
A N
S L
I M
|
ULTA
-
NASDAQ
Ulta Salon Cosm & Frag
SPECIALTY RETAIL - Specialty Retail, Other
|
$85.15
|
-0.16
-0.19% |
$85.62
|
463,408
63.38% of 50 DAV
50 DAV is 731,200
|
$85.91
-0.88%
|
1/11/2012
|
$71.97
|
PP = $75.80
|
|
MB = $79.59
|
Most Recent Note - 3/1/2012 5:11:49 PM
G - Posted a gain today with above average volume for another new all-time high, getting more extended from any sound base pattern. Prior highs near $75 define initial chart support above its 50 DMA line.
>>> The latest Featured Stock Update with an annotated graph appeared on 2/28/2012. Click here.
View all notes |
Alert me of new notes |
CANSLIM.net Company Profile |
SEC |
Zacks Reports |
StockTalk |
News |
Chart |
Request a new note
C
A N
S L
I M
|
V
-
NYSE
Visa Inc Cl A
DIVERSIFIED SERVICES - Business/Management Services
|
$116.16
|
-1.02
-0.87% |
$116.97
|
3,053,332
76.36% of 50 DAV
50 DAV is 3,998,400
|
$119.36
-2.68%
|
2/2/2012
|
$105.43
|
PP = $104.30
|
|
MB = $109.52
|
Most Recent Note - 2/29/2012 4:56:40 PM
G - Reversed and finished in the red today with slightly higher (but still below average) volume after inching to new high territory this week with below average volume conviction behind its recent 2 weeks' gains. Prior highs in the $103-104 area define initial support to watch on pullbacks.
>>> The latest Featured Stock Update with an annotated graph appeared on 1/23/2012. Click here.
View all notes |
Alert me of new notes |
CANSLIM.net Company Profile |
SEC |
Zacks Reports |
StockTalk |
News |
Chart |
Request a new note
C
A N
S L
I M
|