***Last / Change / Volume data in this table is the closing quote data***
Symbol/Exchange
Company Name
Industry Group |
PRICE |
CHANGE
(%Change) |
Day High |
Volume
(% DAV)
(% 50 day avg vol) |
52 Wk Hi
% From Hi |
Featured
Date |
Price
Featured |
Pivot Featured |
|
Max Buy |
ADS
-
NYSE
Alliance Data Sys Corp
COMPUTER SOFTWARE and SERVICES - Information and Delivery Service
|
$121.78
|
+0.42
0.35% |
$122.44
|
456,454
65.73% of 50 DAV
50 DAV is 694,400
|
$122.62
-0.69%
|
1/17/2012
|
$108.24
|
PP = $107.43
|
|
MB = $112.80
|
Most Recent Note - 2/29/2012 7:52:47 PM
G - Quietly holding its ground near its all-time high, extended from its latest base. Fundamental concerns were raised by earnings below the +25% guideline in the latest quarter ended December 31, 2011. See the latest FSU analysis for more details and a new annotated graph.
>>> The latest Featured Stock Update with an annotated graph appeared on 2/29/2012. Click here.
View all notes |
Alert me of new notes |
CANSLIM.net Company Profile |
SEC |
Zacks Reports |
StockTalk |
News |
Chart |
Request a new note
C
A N
S L
I M


|
ALXN
-
NASDAQ
Alexion Pharmaceuticals
DRUGS - Drug Manufacturers - Other
|
$84.54
|
+0.81
0.97% |
$84.68
|
1,039,592
83.13% of 50 DAV
50 DAV is 1,250,600
|
$87.63
-3.53%
|
11/30/2011
|
$68.66
|
PP = $70.52
|
|
MB = $74.05
|
 Most Recent Note - 3/1/2012 5:13:44 PM
G - Holding its ground stubbornly with volume totals cooling after volume-driven gains for new all-time highs last week. It is extended from its prior base, and near-term support to watch is its 50 DMA line.
>>> The latest Featured Stock Update with an annotated graph appeared on 2/24/2012. Click here.
View all notes |
Alert me of new notes |
CANSLIM.net Company Profile |
SEC |
Zacks Reports |
StockTalk |
News |
Chart |
Request a new note
C
A N
S L
I M
|
BODY
-
NASDAQ
Body Central Corp
RETAIL - Catalog andamp; Mail Order Houses
|
$28.90
|
+1.06
3.81% |
$29.10
|
511,130
296.31% of 50 DAV
50 DAV is 172,500
|
$29.49
-2.00%
|
1/27/2012
|
$26.69
|
PP = $25.46
|
|
MB = $26.73
|
Most Recent Note - 3/1/2012 5:16:33 PM
G - After early weakness today it managed a positive reversal for a considerable gain backed by 3 times average volume, finishing at its second-best close ever. It is extended from its prior base. Prior highs in the $25-26 area recently acted as support after encountering some distributional pressure.
>>> The latest Featured Stock Update with an annotated graph appeared on 1/27/2012. Click here.
View all notes |
Alert me of new notes |
CANSLIM.net Company Profile |
SEC |
Zacks Reports |
StockTalk |
News |
Chart |
Request a new note
C
A N
S L
I M
|
CATM
-
NASDAQ
Cardtronics Inc
DIVERSIFIED SERVICES - Business/Management Services
|
$28.27
|
+1.68
6.30% |
$28.31
|
590,559
143.65% of 50 DAV
50 DAV is 411,100
|
$28.74
-1.65%
|
2/24/2012
|
$27.94
|
PP = $28.30
|
|
MB = $29.72
|
Most Recent Note - 3/1/2012 5:05:44 PM
Y - Volume-driven gain today and strong finish near the session high led to its second-best close ever. Subsequent volume-driven gains above the new pivot point cited may trigger a technical buy signal by clearing a "double bottom" base formed over the past 9 weeks during which it found prompt support at its 200 DMA line.
>>> The latest Featured Stock Update with an annotated graph appeared on 1/30/2012. Click here.
View all notes |
Alert me of new notes |
CANSLIM.net Company Profile |
SEC |
Zacks Reports |
StockTalk |
News |
Chart |
Request a new note
C
A N
S L
I M
|
CDNS
-
NASDAQ
Cadence Design Systems
COMPUTER SOFTWARE and SERVICES - Technical and System Software
|
$11.92
|
+0.15
1.27% |
$11.97
|
2,817,840
92.35% of 50 DAV
50 DAV is 3,051,400
|
$12.11
-1.57%
|
2/3/2012
|
$11.66
|
PP = $11.15
|
|
MB = $11.71
|
Most Recent Note - 2/24/2012 4:13:06 PM
G - Its Relative Strength rating has slumped to 81, near the minimum 80+ guideline. Recently making limited progress while churning above average volume, a sign of distributional pressure while no resistance remains due to overhead supply.
>>> The latest Featured Stock Update with an annotated graph appeared on 2/3/2012. Click here.
View all notes |
Alert me of new notes |
CANSLIM.net Company Profile |
SEC |
Zacks Reports |
StockTalk |
News |
Chart |
Request a new note
C
A N
S L
I M
|
Symbol/Exchange
Company Name
Industry Group |
PRICE |
CHANGE
(%Change) |
Day High |
Volume
(% DAV)
(% 50 day avg vol) |
52 Wk Hi
% From Hi |
Featured
Date |
Price
Featured |
Pivot Featured |
|
Max Buy |
CELG
-
NASDAQ
Celgene Corp
DRUGS - Drug Manufacturers - Major
|
$73.92
|
+0.60
0.81% |
$74.24
|
2,113,742
65.06% of 50 DAV
50 DAV is 3,249,100
|
$76.09
-2.85%
|
2/2/2012
|
$74.16
|
PP = $75.21
|
|
MB = $78.97
|
Most Recent Note - 2/28/2012 5:59:31 PM
Y - Volume totals have been cooling since it stalled and slumped below the pivot point. Still perched within close striking distance of its all-time high ($77.39 in Aug '08). Any subsequent volume-driven gains would be a reassuring sign of fresh institutional demand, meanwhile its 50 DMA line and prior lows in the $71 area now coincide and define important chart support to watch.
>>> The latest Featured Stock Update with an annotated graph appeared on 2/2/2012. Click here.
View all notes |
Alert me of new notes |
CANSLIM.net Company Profile |
SEC |
Zacks Reports |
StockTalk |
News |
Chart |
Request a new note
C
A N
S L
I M
|
ECHO
-
NASDAQ
Echo Global Logistics
DIVERSIFIED SERVICES - Business/Management Services
|
$18.60
|
+0.00
0.00% |
$18.81
|
134,452
200.08% of 50 DAV
50 DAV is 67,200
|
$19.38
-4.02%
|
2/22/2012
|
$18.50
|
PP = $18.63
|
|
MB = $19.56
|
Most Recent Note - 3/1/2012 12:47:54 PM
Y - Following a gap down with heavy volume on the prior session it is still holding its ground just -3.5% off its all-time high with no resistance remaining due to overhead supply. It has been consolidating below its "max buy" level after breaking out from a large cup shaped base.
>>> The latest Featured Stock Update with an annotated graph appeared on 2/23/2012. Click here.
View all notes |
Alert me of new notes |
CANSLIM.net Company Profile |
SEC |
Zacks Reports |
StockTalk |
News |
Chart |
Request a new note
C
A N
S L
I M
|
FEIC
-
NASDAQ
F E I Co
ELECTRONICS - Diversified Electronics
|
$45.00
|
+0.48
1.08% |
$46.00
|
494,432
172.52% of 50 DAV
50 DAV is 286,600
|
$48.31
-6.85%
|
12/7/2011
|
$41.41
|
PP = $42.35
|
|
MB = $44.47
|
Most Recent Note - 3/1/2012 5:18:58 PM
G - Small gain today while churning above average volume just above its 50 DMA line and prior highs in the $43 area which recently acted as support. Subsequent weakness leading to violations may trigger worrisome technical sell signals. Reported earnings +21% on +14% sales revenues for the latest quarter ended December 31, 2011 versus the year ago period (below the +25% minimum guideline for earnings growth).
>>> The latest Featured Stock Update with an annotated graph appeared on 1/25/2012. Click here.
View all notes |
Alert me of new notes |
CANSLIM.net Company Profile |
SEC |
Zacks Reports |
StockTalk |
News |
Chart |
Request a new note
C
A N
S L
I M
|
GNC
-
NYSE
G N C Holdings Inc
RETAIL - Drug Stores
|
$32.44
|
+0.07
0.22% |
$33.14
|
678,608
68.69% of 50 DAV
50 DAV is 988,000
|
$33.70
-3.74%
|
1/19/2012
|
$28.99
|
PP = $29.60
|
|
MB = $31.08
|
Most Recent Note - 3/1/2012 5:20:38 PM
G - Hovering in a tight range near its 52-week high with volume totals cooling in the past week while stubbornly holding its ground. Prior highs in the $29.50 area define support to watch on pullbacks.
>>> The latest Featured Stock Update with an annotated graph appeared on 1/19/2012. Click here.
View all notes |
Alert me of new notes |
CANSLIM.net Company Profile |
SEC |
Zacks Reports |
StockTalk |
News |
Chart |
Request a new note
C
A N
S L
I M
|
GOLD
-
NASDAQ
Randgold Resources Adr
METALS and MINING - Gold
|
$115.98
|
+1.25
1.09% |
$117.28
|
409,227
85.45% of 50 DAV
50 DAV is 478,900
|
$120.73
-3.93%
|
2/7/2012
|
$116.21
|
PP = $120.83
|
|
MB = $126.87
|
Most Recent Note - 3/1/2012 5:23:17 PM
Y - Posted a gain on lighter volume today following a distributional loss with above average volume on the prior session while perched within close striking distance of prior highs. Subsequent volume-driven gains into new high territory may trigger a technical buy signal, however such convincing gains have not yet confirmed a fresh burst of great institutional buying demand. Meanwhile its 88 Relative Strength Rating is above the 80+ guideline for buy candidates, but its Relative Strength line was plotted higher later last year.
>>> The latest Featured Stock Update with an annotated graph appeared on 2/8/2012. Click here.
View all notes |
Alert me of new notes |
CANSLIM.net Company Profile |
SEC |
Zacks Reports |
StockTalk |
News |
Chart |
Request a new note
C
A N
S L
I M
|
Symbol/Exchange
Company Name
Industry Group |
PRICE |
CHANGE
(%Change) |
Day High |
Volume
(% DAV)
(% 50 day avg vol) |
52 Wk Hi
% From Hi |
Featured
Date |
Price
Featured |
Pivot Featured |
|
Max Buy |
HLF
-
NYSE
Herbalife Ltd
DRUGS - Nutrition and Weight Management
|
$67.70
|
+1.49
2.25% |
$67.73
|
1,673,565
133.96% of 50 DAV
50 DAV is 1,249,300
|
$67.50
0.30%
|
2/22/2012
|
$65.90
|
PP = $63.50
|
|
MB = $66.68
|
Most Recent Note - 3/1/2012 5:26:08 PM
G - Small gain today with above average volume, inching higher after stubbornly holding its ground in a very tight range since its 2/22/12 gain triggered a technical buy signal. Color code is changed to green after rising above its "max buy" level, getting extended from its prior base pattern. Prior highs in the $63 area define support to watch on pullbacks.
>>> The latest Featured Stock Update with an annotated graph appeared on 2/22/2012. Click here.
View all notes |
Alert me of new notes |
CANSLIM.net Company Profile |
SEC |
Zacks Reports |
StockTalk |
News |
Chart |
Request a new note
C
A N
S L
I M
|
HMSY
-
NASDAQ
H M S Holdings Corp
COMPUTER SOFTWARE and SERVICES - Healthcare Information Service
|
$32.11
|
-0.11
-0.34% |
$32.57
|
662,707
71.27% of 50 DAV
50 DAV is 929,900
|
$34.98
-8.20%
|
10/27/2011
|
$26.44
|
PP = $28.37
|
|
MB = $29.79
|
Most Recent Note - 2/29/2012 5:06:42 PM
G - Loss today on lighter volume followed the violation of its 50 DMA line with above average volume, raising more concerns. Following recent distributional action, any further deterioration below that important short-term average may clinch a more definitive technical sell signal. Meanwhile prior lows in the $30 area define the next chart support level to watch.
>>> The latest Featured Stock Update with an annotated graph appeared on 2/9/2012. Click here.
View all notes |
Alert me of new notes |
CANSLIM.net Company Profile |
SEC |
Zacks Reports |
StockTalk |
News |
Chart |
Request a new note
C
A N
S L
I M
|
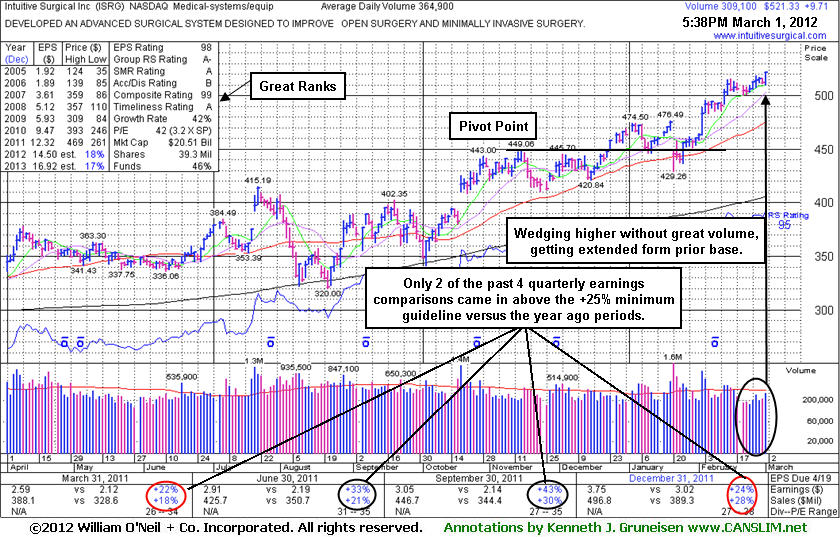
ISRG
-
NASDAQ
Intuitive Surgical Inc
HEALTH SERVICES - Medical Appliances and Equipment
|
$521.33
|
+9.71
1.90% |
$521.50
|
310,137
84.99% of 50 DAV
50 DAV is 364,900
|
$518.47
0.55%
|
12/20/2011
|
$442.43
|
PP = $449.16
|
|
MB = $471.62
|
Most Recent Note - 3/1/2012 6:28:51 PM
G - Recently wedged to new all-time highs without great volume conviction and it is extended from prior highs in the $475 area that define support to watch on pullbacks. December '11 quarterly earnings increased by just below the borderline +25% minimum guideline for ideal buy candidates. See the latest FSU analysis for more details and a new annotated graph.
>>> The latest Featured Stock Update with an annotated graph appeared on 3/1/2012. Click here.
View all notes |
Alert me of new notes |
CANSLIM.net Company Profile |
SEC |
Zacks Reports |
StockTalk |
News |
Chart |
Request a new note
C
A N
S L
I M
|
LULU
-
NASDAQ
Lululemon Athletica
MANUFACTURING - Textile Manufacturing
|
$70.86
|
+3.84
5.73% |
$70.98
|
3,453,144
145.21% of 50 DAV
50 DAV is 2,378,000
|
$68.06
4.11%
|
1/10/2012
|
$60.97
|
PP = $59.46
|
|
MB = $62.43
|
Most Recent Note - 3/1/2012 2:36:27 PM
G - Considerable volume-driven gain today, getting more extended from its prior highs and hitting another new all-time high. Prior highs in the $61-64 area define initial chart support to watch on pullbacks.
>>> The latest Featured Stock Update with an annotated graph appeared on 2/21/2012. Click here.
View all notes |
Alert me of new notes |
CANSLIM.net Company Profile |
SEC |
Zacks Reports |
StockTalk |
News |
Chart |
Request a new note
C
A N
S L
I M
|
MA
-
NYSE
Mastercard Inc Cl A
DIVERSIFIED SERVICES - Business/Management Services
|
$420.43
|
+0.43
0.10% |
$423.28
|
872,579
78.82% of 50 DAV
50 DAV is 1,107,100
|
$428.57
-1.90%
|
2/2/2012
|
$379.05
|
PP = $381.32
|
|
MB = $400.39
|
Most Recent Note - 2/29/2012 5:01:14 PM
G - Reversed into the red after inching further into new all-time high territory earlier today. Prior highs in the $381-384 area define support to watch on pullbacks.
>>> The latest Featured Stock Update with an annotated graph appeared on 2/17/2012. Click here.
View all notes |
Alert me of new notes |
CANSLIM.net Company Profile |
SEC |
Zacks Reports |
StockTalk |
News |
Chart |
Request a new note
C
A N
S L
I M
|
Symbol/Exchange
Company Name
Industry Group |
PRICE |
CHANGE
(%Change) |
Day High |
Volume
(% DAV)
(% 50 day avg vol) |
52 Wk Hi
% From Hi |
Featured
Date |
Price
Featured |
Pivot Featured |
|
Max Buy |
MELI
-
NASDAQ
Mercadolibre Inc
INTERNET - Internet Software and; Services
|
$97.67
|
+0.36
0.37% |
$98.96
|
973,059
189.35% of 50 DAV
50 DAV is 513,900
|
$104.50
-6.54%
|
2/6/2012
|
$97.09
|
PP = $95.58
|
|
MB = $100.36
|
Most Recent Note - 2/29/2012 4:47:54 PM
Y - Down for a second consecutive session today on near average but slightly higher volume, retreating from its all-time high to below its "max buy" level. The color code is changed to yellow again. Reported earnings +31% on +39% sales revenues for the quarter ended December 31, 2011 versus the year ago period.
>>> The latest Featured Stock Update with an annotated graph appeared on 2/6/2012. Click here.
View all notes |
Alert me of new notes |
CANSLIM.net Company Profile |
SEC |
Zacks Reports |
StockTalk |
News |
Chart |
Request a new note
C
A N
S L
I M
|
MKTX
-
NASDAQ
Marketaxess Holdings Inc
FINANCIAL SERVICES - Investment Brokerage - Nationa
|
$33.83
|
+0.71
2.14% |
$34.23
|
256,549
104.67% of 50 DAV
50 DAV is 245,100
|
$35.42
-4.49%
|
10/28/2011
|
$29.79
|
PP = $31.05
|
|
MB = $32.60
|
Most Recent Note - 2/29/2012 4:51:09 PM
G - It found prompt support near its 50 DMA line last week and is perched -6.5% off its all-time high today, consolidating after completing a Secondary Offering on 2/22/12.
>>> The latest Featured Stock Update with an annotated graph appeared on 1/24/2012. Click here.
View all notes |
Alert me of new notes |
CANSLIM.net Company Profile |
SEC |
Zacks Reports |
StockTalk |
News |
Chart |
Request a new note
C
A N
S L
I M
|
RAX
-
NYSE
Rackspace Hosting Inc
INTERNET - Internet Software and; Services
|
$52.57
|
+0.33
0.63% |
$53.02
|
2,613,839
135.08% of 50 DAV
50 DAV is 1,935,000
|
$56.94
-7.67%
|
2/2/2012
|
$46.69
|
PP = $45.55
|
|
MB = $47.83
|
Most Recent Note - 2/29/2012 4:54:03 PM
G - Down today for a 5th consecutive small loss with below average volume, now -8.3% off its 52-week high. Repeatedly noted following a considerable 2/14/12 gap up gain with very heavy volume - "Too extended from the previous base to be considered an ideal buy candidate under the fact-based investment system's guidelines."
>>> The latest Featured Stock Update with an annotated graph appeared on 2/16/2012. Click here.
View all notes |
Alert me of new notes |
CANSLIM.net Company Profile |
SEC |
Zacks Reports |
StockTalk |
News |
Chart |
Request a new note
C
A N
S L
I M
|
RRTS
-
NYSE
Roadrunner Trans Systems
TRANSPORTATION - Air Delivery and Freight Service
|
$18.02
|
+0.17
0.95% |
$18.05
|
291,827
208.90% of 50 DAV
50 DAV is 139,700
|
$18.44
-2.28%
|
2/10/2012
|
$17.40
|
PP = $17.50
|
|
MB = $18.38
|
Most Recent Note - 2/27/2012 12:52:31 PM
Y - Hovering within close striking distance of its 52-week high, stubbornly holding its ground. Prior highs in the $17 area define initial support to watch on pullbacks.
>>> The latest Featured Stock Update with an annotated graph appeared on 2/13/2012. Click here.
View all notes |
Alert me of new notes |
CANSLIM.net Company Profile |
SEC |
Zacks Reports |
StockTalk |
News |
Chart |
Request a new note
C
A N
S L
I M
|
SWI
-
NYSE
Solarwinds Inc
COMPUTER SOFTWARE and SERVICES - Application Software
|
$38.36
|
+1.10
2.95% |
$39.01
|
1,259,721
110.53% of 50 DAV
50 DAV is 1,139,700
|
$39.75
-3.50%
|
1/26/2012
|
$32.36
|
PP = $33.78
|
|
MB = $35.47
|
Most Recent Note - 3/1/2012 5:07:07 PM
G - Posted a solid gain today on higher volume following 4 consecutive small losses on light volume while retreating from its all-time high. It is extended from its latest base. Earnings below the +25% guideline for the Dec '11 quarter raised fundamental concerns.
>>> The latest Featured Stock Update with an annotated graph appeared on 1/26/2012. Click here.
View all notes |
Alert me of new notes |
CANSLIM.net Company Profile |
SEC |
Zacks Reports |
StockTalk |
News |
Chart |
Request a new note
C
A N
S L
I M
|
Symbol/Exchange
Company Name
Industry Group |
PRICE |
CHANGE
(%Change) |
Day High |
Volume
(% DAV)
(% 50 day avg vol) |
52 Wk Hi
% From Hi |
Featured
Date |
Price
Featured |
Pivot Featured |
|
Max Buy |
SXCI
-
NASDAQ
S X C Health Solutions
COMPUTER SOFTWARE and SERVICES - Healthcare Information Service
|
$72.15
|
+1.35
1.91% |
$72.73
|
507,626
138.17% of 50 DAV
50 DAV is 367,400
|
$72.34
-0.26%
|
2/23/2012
|
$68.24
|
PP = $66.05
|
|
MB = $69.35
|
Most Recent Note - 2/29/2012 4:41:54 PM
G - Holding its ground after getting extended beyond its "max buy" level with 5 consecutive volume-driven gains. Prior highs in the $66 area define support to watch on pullbacks.
>>> The latest Featured Stock Update with an annotated graph appeared on 1/20/2012. Click here.
View all notes |
Alert me of new notes |
CANSLIM.net Company Profile |
SEC |
Zacks Reports |
StockTalk |
News |
Chart |
Request a new note
C
A N
S L
I M
|
TDG
-
NYSE
Transdigm Group Inc
AEROSPACE/DEFENSE - Aerospace/Defense Products and; Services
|
$117.11
|
-1.68
-1.41% |
$119.66
|
487,315
136.77% of 50 DAV
50 DAV is 356,300
|
$121.48
-3.60%
|
2/29/2012
|
$120.10
|
PP = $118.93
|
|
MB = $124.88
|
Most Recent Note - 2/29/2012 12:41:45 PM
Y - It formed an advanced "3-weeks tight" base pattern and its color code is changed to yellow with a new pivot point cited based on its 2/13/12 high plus 10 cents. A volume-driven gain for a strong close above it pivot point may confirm a new (or-add on) technical buy signal. Prior highs near $102 define the initial support level to watch above its 50 DMA line.
>>> The latest Featured Stock Update with an annotated graph appeared on 2/10/2012. Click here.
View all notes |
Alert me of new notes |
CANSLIM.net Company Profile |
SEC |
Zacks Reports |
StockTalk |
News |
Chart |
Request a new note
C
A N
S L
I M
|
TNGO
-
NASDAQ
Tangoe Inc
COMPUTER SOFTWARE and SERVICES - Technical and System Software
|
$18.62
|
-0.12
-0.64% |
$19.17
|
232,706
74.23% of 50 DAV
50 DAV is 313,500
|
$19.90
-6.43%
|
2/13/2012
|
$15.39
|
PP = $16.51
|
|
MB = $17.34
|
Most Recent Note - 2/29/2012 4:44:19 PM
G - Down today for its 3rd consecutive loss marked by above average volume after rallying to new highs with volume-driven gains. It is extended from prior highs in the $16 area which define initial support to watch on pullbacks.
>>> The latest Featured Stock Update with an annotated graph appeared on 2/14/2012. Click here.
View all notes |
Alert me of new notes |
CANSLIM.net Company Profile |
SEC |
Zacks Reports |
StockTalk |
News |
Chart |
Request a new note
C
A N
S L
I M
|
TSCO
-
NASDAQ
Tractor Supply Co
SPECIALTY RETAIL - Specialty Retail, Other
|
$87.50
|
+2.03
2.38% |
$88.38
|
710,337
97.88% of 50 DAV
50 DAV is 725,700
|
$88.65
-1.30%
|
1/12/2012
|
$79.12
|
PP = $75.58
|
|
MB = $79.36
|
Most Recent Note - 2/27/2012 5:24:59 PM
G - Up today with +58% above average volume for a new all-time high. Its 50 DMA line defines support to watch on pullbacks. See the latest FSU analysis for more details and a new annotated graph.
>>> The latest Featured Stock Update with an annotated graph appeared on 2/27/2012. Click here.
View all notes |
Alert me of new notes |
CANSLIM.net Company Profile |
SEC |
Zacks Reports |
StockTalk |
News |
Chart |
Request a new note
C
A N
S L
I M
|
UA
-
NYSE
Under Armour Inc Cl A
CONSUMER NON-DURABLES - Textile - Apparel Clothing
|
$92.12
|
+2.88
3.23% |
$92.29
|
1,384,247
111.22% of 50 DAV
50 DAV is 1,244,600
|
$89.88
2.49%
|
2/15/2012
|
$85.77
|
PP = $84.86
|
|
MB = $89.10
|
Most Recent Note - 3/1/2012 5:10:04 PM
G - Color code is changed to green after rallying above its "max buy" level with today's 5th consecutive gain above its pivot point which again did not have volume sufficient to trigger a proper technical buy signal. Pyramiding into a stock can help investors avoid chasing them too far above their pivot point.
>>> The latest Featured Stock Update with an annotated graph appeared on 2/15/2012. Click here.
View all notes |
Alert me of new notes |
CANSLIM.net Company Profile |
SEC |
Zacks Reports |
StockTalk |
News |
Chart |
Request a new note
C
A N
S L
I M
|
Symbol/Exchange
Company Name
Industry Group |
PRICE |
CHANGE
(%Change) |
Day High |
Volume
(% DAV)
(% 50 day avg vol) |
52 Wk Hi
% From Hi |
Featured
Date |
Price
Featured |
Pivot Featured |
|
Max Buy |
UBNT
-
NASDAQ
Ubiquiti Networks Inc
TELECOMMUNICATIONS - Diversified Communication Serv
|
$25.02
|
-1.26
-4.79% |
$26.66
|
428,440
139.33% of 50 DAV
50 DAV is 307,500
|
$28.97
-13.63%
|
1/27/2012
|
$22.25
|
PP = $23.14
|
|
MB = $24.30
|
Most Recent Note - 3/1/2012 5:01:06 PM
G - Higher volume was behind today's 3rd consecutive loss, and its close in the lower half of its intra-day range was indicative of distributional pressure. It is still extended from its prior base. Patient investors may watch for secondary buy points to possibly develop and be noted.
>>> The latest Featured Stock Update with an annotated graph appeared on 2/1/2012. Click here.
View all notes |
Alert me of new notes |
CANSLIM.net Company Profile |
SEC |
Zacks Reports |
StockTalk |
News |
Chart |
Request a new note
C
A N
S L
I M
|
ULTA
-
NASDAQ
Ulta Salon Cosm & Frag
SPECIALTY RETAIL - Specialty Retail, Other
|
$85.31
|
+2.07
2.49% |
$85.91
|
972,633
133.37% of 50 DAV
50 DAV is 729,300
|
$84.48
0.98%
|
1/11/2012
|
$71.97
|
PP = $75.80
|
|
MB = $79.59
|
Most Recent Note - 3/1/2012 5:11:49 PM
G - Posted a gain today with above average volume for another new all-time high, getting more extended from any sound base pattern. Prior highs near $75 define initial chart support above its 50 DMA line.
>>> The latest Featured Stock Update with an annotated graph appeared on 2/28/2012. Click here.
View all notes |
Alert me of new notes |
CANSLIM.net Company Profile |
SEC |
Zacks Reports |
StockTalk |
News |
Chart |
Request a new note
C
A N
S L
I M
|
V
-
NYSE
Visa Inc Cl A
DIVERSIFIED SERVICES - Business/Management Services
|
$117.18
|
+0.81
0.70% |
$117.99
|
2,793,478
69.31% of 50 DAV
50 DAV is 4,030,300
|
$119.36
-1.83%
|
2/2/2012
|
$105.43
|
PP = $104.30
|
|
MB = $109.52
|
Most Recent Note - 2/29/2012 4:56:40 PM
G - Reversed and finished in the red today with slightly higher (but still below average) volume after inching to new high territory this week with below average volume conviction behind its recent 2 weeks' gains. Prior highs in the $103-104 area define initial support to watch on pullbacks.
>>> The latest Featured Stock Update with an annotated graph appeared on 1/23/2012. Click here.
View all notes |
Alert me of new notes |
CANSLIM.net Company Profile |
SEC |
Zacks Reports |
StockTalk |
News |
Chart |
Request a new note
C
A N
S L
I M
|