***Last / Change / Volume data in this table is the closing quote data***
Symbol/Exchange
Company Name
Industry Group |
PRICE |
CHANGE
(%Change) |
Day High |
Volume
(% DAV)
(% 50 day avg vol) |
52 Wk Hi
% From Hi |
Featured
Date |
Price
Featured |
Pivot Featured |
|
Max Buy |
BIDU
-
NASDAQ
Baidu Inc Ads
INTERNET - Internet Information Providers
|
$117.83
|
-3.33
-2.75% |
$120.55
|
5,782,296
76.72% of 50 DAV
50 DAV is 7,536,600
|
$131.63
-10.48%
|
2/1/2011
|
$117.74
|
PP = $112.08
|
|
MB = $117.68
|
 Most Recent Note - 3/1/2011 4:14:15 PM
G - Gapped down today for a loss on higher (but below average) volume following 3 consecutive gains on below average volume. Damaging losses with higher than average volume recently led to a slump near prior highs in the $112-115 area previously noted as defining initial chart support to watch above its 50 DMA line.
>>> The latest Featured Stock Update with an annotated graph appeared on 2/2/2011. Click here.
View all notes |
Alert me of new notes |
CANSLIM.net Company Profile |
SEC |
Zacks Reports |
StockTalk |
News |
Chart |
Request a new note
C
A N
S L
I M


|
CMG
-
NYSE
Chipotle Mexican Grill
LEISURE - Restaurants
|
$241.15
|
-3.85
-1.57% |
$244.44
|
673,416
64.68% of 50 DAV
50 DAV is 1,041,100
|
$275.00
-12.31%
|
2/11/2011
|
$271.15
|
PP = $262.87
|
|
MB = $276.01
|
Most Recent Note - 2/28/2011 6:06:44 PM
G - Color code was changed to green after distributional pressure last week led to trading more than -7% below its pivot point, raising concerns. Recent highs and its 50 DMA line in the $235-237 area define technical chart support levels to watch where more damaging losses would raise greater concerns.
>>> The latest Featured Stock Update with an annotated graph appeared on 2/11/2011. Click here.
View all notes |
Alert me of new notes |
CANSLIM.net Company Profile |
SEC |
Zacks Reports |
StockTalk |
News |
Chart |
Request a new note
C
A N
S L
I M
|
CRUS
-
NASDAQ
Cirrus Logic Inc
ELECTRONICS - Semiconductor - Specialized
|
$22.96
|
-0.39
-1.67% |
$23.83
|
3,269,993
98.35% of 50 DAV
50 DAV is 3,324,800
|
$25.48
-9.89%
|
1/28/2011
|
$20.69
|
PP = $19.17
|
|
MB = $20.13
|
Most Recent Note - 2/28/2011 6:07:39 PM
G - Found support after a pullback near prior chart highs last week amid widespread weakness. Subsequent deterioration below its 2/23/11 low ($21.17) would raise concerns, technically, and any close below its significant prior high close ($20.54 on 7/26/10) would raise even greater concerns.
>>> The latest Featured Stock Update with an annotated graph appeared on 1/28/2011. Click here.
View all notes |
Alert me of new notes |
CANSLIM.net Company Profile |
SEC |
Zacks Reports |
StockTalk |
News |
Chart |
Request a new note
C
A N
S L
I M
|
CTSH
-
NASDAQ
Cognizant Tech Sol Cl A
COMPUTER SOFTWARE and SERVICES - Business Software and Services
|
$74.49
|
-2.38
-3.10% |
$77.25
|
2,758,740
121.67% of 50 DAV
50 DAV is 2,267,400
|
$77.74
-4.18%
|
2/7/2011
|
$75.09
|
PP = $76.46
|
|
MB = $80.28
|
Most Recent Note - 3/1/2011 4:16:24 PM
Y - Considerable pullback near its 50 DMA line with today's loss on slightly above average volume. No overhead supply remains to hinder its progress, but is has stalled since its 2/08/11 breakout with bare minimum volume. Confirming gains for new highs with above average volume would be a welcome reassurance of institutional accumulation.
>>> The latest Featured Stock Update with an annotated graph appeared on 2/8/2011. Click here.
View all notes |
Alert me of new notes |
CANSLIM.net Company Profile |
SEC |
Zacks Reports |
StockTalk |
News |
Chart |
Request a new note
C
A N
S L
I M
|
DECK
-
NASDAQ
Deckers Outdoor Corp
CONSUMER NON-DURABLES - Textile - Apparel Footwear
|
$83.66
|
-4.56
-5.17% |
$88.84
|
2,148,519
130.05% of 50 DAV
50 DAV is 1,652,100
|
$94.70
-11.66%
|
2/3/2011
|
$79.61
|
PP = $82.67
|
|
MB = $86.80
|
Most Recent Note - 3/1/2011 4:10:39 PM
G - Closed near the session low with a considerable loss today on above average volume. Churning above average volume action without meaningful price progress has been noted as indicative of distributional pressure following its 2/17/11 technical breakout. Support to watch is at its pivot point and 50 DMA line (now $81.71).
>>> The latest Featured Stock Update with an annotated graph appeared on 1/26/2011. Click here.
View all notes |
Alert me of new notes |
CANSLIM.net Company Profile |
SEC |
Zacks Reports |
StockTalk |
News |
Chart |
Request a new note
C
A N
S L
I M
|
Symbol/Exchange
Company Name
Industry Group |
PRICE |
CHANGE
(%Change) |
Day High |
Volume
(% DAV)
(% 50 day avg vol) |
52 Wk Hi
% From Hi |
Featured
Date |
Price
Featured |
Pivot Featured |
|
Max Buy |
EBIX
-
NASDAQ
Ebix Inc
COMPUTER SOFTWARE and SERVICES - Business Software and Services
|
$27.35
|
+1.01
3.83% |
$27.72
|
1,526,332
338.73% of 50 DAV
50 DAV is 450,600
|
$28.21
-3.05%
|
2/28/2011
|
$25.70
|
PP = $25.97
|
|
MB = $27.27
|
Most Recent Note - 3/1/2011 11:42:16 AM
Y - Gapped up and briefly traded above its "max buy" level earlier today. A strong finish on the prior session with more than 3 times average volume triggered a technical buy signal after a choppy new 6-week flat base. In the 2/28/11 mid-day report its color code was changed to yellow with new pivot point cited based on its 1/18/11 high plus ten cents as it was noted - "Little resistance remains due to overhead supply. Since dropped from the Featured Stocks list on 11/16/10 the prior resistance previously noted in the $20 area acted as support and its fundamentals have remained strong. "
>>> The latest Featured Stock Update with an annotated graph appeared on 2/28/2011. Click here.
View all notes |
Alert me of new notes |
CANSLIM.net Company Profile |
SEC |
Zacks Reports |
StockTalk |
News |
Chart |
Request a new note
C
A N
S L
I M
|
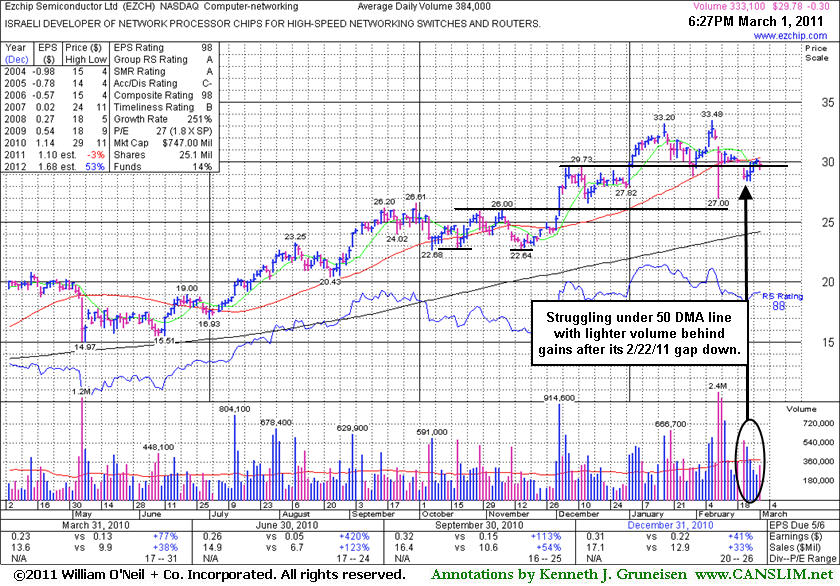
EZCH
-
NASDAQ
Ezchip Semiconductor Ltd
ELECTRONICS - Semiconductor - Specialized
|
$29.78
|
-0.30
-1.00% |
$30.08
|
333,138
85.95% of 50 DAV
50 DAV is 387,600
|
$33.48
-11.05%
|
12/2/2010
|
$27.53
|
PP = $26.00
|
|
MB = $27.30
|
Most Recent Note - 2/28/2011 6:20:18 PM
G - Small gain for a 4th consecutive session today on below average volume, still lingering below its 50 DMA line which may now act as resistance. A convincing rebound above its short-term average would help its outlook, meanwhile it faces overhead supply now up through the $33 area which may hinder its ability to rally.
>>> The latest Featured Stock Update with an annotated graph appeared on 3/1/2011. Click here.
View all notes |
Alert me of new notes |
CANSLIM.net Company Profile |
SEC |
Zacks Reports |
StockTalk |
News |
Chart |
Request a new note
C
A N
S L
I M
|
EZPW
-
NASDAQ
Ezcorp Inc Cl A
SPECIALTY RETAIL - Specialty Retail, Other
|
$28.37
|
-0.31
-1.08% |
$28.79
|
285,470
71.89% of 50 DAV
50 DAV is 397,100
|
$29.94
-5.24%
|
2/18/2011
|
$27.94
|
PP = $30.04
|
|
MB = $31.54
|
Most Recent Note - 2/28/2011 6:20:58 PM
Y - Up again on light volume today, rising further above its 50 DMA line and showing resilience. Subsequent gains with heavy volume above its pivot point may trigger a new (or add-on) technical buy signal. Recent low ($25.56 on 1/25/11) defines an important support level now.
>>> The latest Featured Stock Update with an annotated graph appeared on 2/3/2011. Click here.
View all notes |
Alert me of new notes |
CANSLIM.net Company Profile |
SEC |
Zacks Reports |
StockTalk |
News |
Chart |
Request a new note
C
A N
S L
I M
|
FOSL
-
NASDAQ
Fossil Inc
CONSUMER DURABLES - Recreational Goods, Other
|
$75.11
|
-1.63
-2.12% |
$77.79
|
763,485
93.91% of 50 DAV
50 DAV is 813,000
|
$83.68
-10.24%
|
2/1/2011
|
$73.30
|
PP = $74.44
|
|
MB = $78.16
|
Most Recent Note - 2/28/2011 6:22:24 PM
G - Found support last week near its 50 DMA line and it is consolidating above prior resistance in the $74 area previously noted as defining chart support. See the latest FSU analysis for more details and an annotated graph.
>>> The latest Featured Stock Update with an annotated graph appeared on 2/24/2011. Click here.
View all notes |
Alert me of new notes |
CANSLIM.net Company Profile |
SEC |
Zacks Reports |
StockTalk |
News |
Chart |
Request a new note
C
A N
S L
I M
|
GSIT
-
NASDAQ
G S I Technology Inc
ELECTRONICS - Semiconductor - Broad Line
|
$9.20
|
-0.21
-2.23% |
$9.41
|
120,738
49.79% of 50 DAV
50 DAV is 242,500
|
$10.20
-9.80%
|
2/18/2011
|
$10.08
|
PP = $10.25
|
|
MB = $10.76
|
Most Recent Note - 2/28/2011 6:23:56 PM
G - Holding its ground after gains on lighter volume halted its slide at its 50 DMA line last week. A subsequent rally for a close above its 2/18/11 close ($9.78) would help its outlook following its gap down on 2/22/11 and damaging losses on higher volume.
>>> The latest Featured Stock Update with an annotated graph appeared on 2/18/2011. Click here.
View all notes |
Alert me of new notes |
CANSLIM.net Company Profile |
SEC |
Zacks Reports |
StockTalk |
News |
Chart |
Request a new note
C
A N
S L
I M
|
Symbol/Exchange
Company Name
Industry Group |
PRICE |
CHANGE
(%Change) |
Day High |
Volume
(% DAV)
(% 50 day avg vol) |
52 Wk Hi
% From Hi |
Featured
Date |
Price
Featured |
Pivot Featured |
|
Max Buy |
HMSY
-
NASDAQ
H M S Holdings Corp
COMPUTER SOFTWARE and SERVICES - Healthcare Information Service
|
$75.28
|
-0.28
-0.37% |
$75.75
|
221,462
136.54% of 50 DAV
50 DAV is 162,200
|
$77.43
-2.78%
|
11/19/2010
|
$61.89
|
PP = $63.01
|
|
MB = $66.16
|
Most Recent Note - 2/28/2011 6:25:09 PM
G - Rose on light volume today for its second-best close ever. Held its ground since its 2/23/11 gap down broke a streak of 15 consecutive gains. Extended from any sound base pattern, support to watch is defined by prior chart highs and its 50 DMA line in the $67 area.
>>> The latest Featured Stock Update with an annotated graph appeared on 2/16/2011. Click here.
View all notes |
Alert me of new notes |
CANSLIM.net Company Profile |
SEC |
Zacks Reports |
StockTalk |
News |
Chart |
Request a new note
C
A N
S L
I M
|
JOBS
-
NASDAQ
Fifty One Job Inc Ads
DIVERSIFIED SERVICES - Staffing and; Outsourcing Service
|
$58.28
|
-1.39
-2.33% |
$58.99
|
191,672
148.01% of 50 DAV
50 DAV is 129,500
|
$64.55
-9.71%
|
2/7/2011
|
$59.23
|
PP = $61.38
|
|
MB = $64.45
|
Most Recent Note - 3/1/2011 4:38:36 PM
Y - Small gap down today for a loss with above average volume following a negative reversal after a 2/28/11 gap up for a new 52-week high. Reported earnings +39% on +38% sales revenues for the quarter ended December 31, 2010 versus the year ago period. Its color code was changed to yellow based on its resilience near its short-term average again last week as it was noted - "A subsequent rally to new highs with above average volume may confirm a new buy signal, meanwhile its recent low ($52.58 on 1/28/11) defines another important support level below its 50 DMA line where violations would raise serious concerns and trigger technical sell signals."
>>> The latest Featured Stock Update with an annotated graph appeared on 2/7/2011. Click here.
View all notes |
Alert me of new notes |
CANSLIM.net Company Profile |
SEC |
Zacks Reports |
StockTalk |
News |
Chart |
Request a new note
C
A N
S L
I M
|
LULU
-
NASDAQ
Lululemon Athletica
MANUFACTURING - Textile Manufacturing
|
$73.80
|
-3.79
-4.88% |
$77.88
|
2,751,071
142.14% of 50 DAV
50 DAV is 1,935,500
|
$85.28
-13.46%
|
1/26/2011
|
$68.11
|
PP = $74.70
|
|
MB = $78.44
|
Most Recent Note - 3/1/2011 11:22:41 AM
Y - Slumping toward its 50 DMA line and pivot point that define important support. Violations may trigger technical sell signals, and any subsequent close below a significant prior high close ($73.51 on 12/21/10) would completely negate its latest breakout, raising more serious concerns.
>>> The latest Featured Stock Update with an annotated graph appeared on 2/25/2011. Click here.
View all notes |
Alert me of new notes |
CANSLIM.net Company Profile |
SEC |
Zacks Reports |
StockTalk |
News |
Chart |
Request a new note
C
A N
S L
I M
|
MWIV
-
NASDAQ
M W I Veterinary Supply
HEALTH SERVICES - Medical Instruments and; Supplies
|
$69.32
|
+0.10
0.14% |
$70.41
|
106,050
146.07% of 50 DAV
50 DAV is 72,600
|
$72.27
-4.08%
|
11/4/2010
|
$61.79
|
PP = $59.60
|
|
MB = $62.58
|
Most Recent Note - 3/1/2011 4:41:34 PM
G - Posted its 3rd gain in 4 sessions today with above average volume. It found support near prior highs and its 50 DMA line but has not built a sound new base pattern.
>>> The latest Featured Stock Update with an annotated graph appeared on 2/2/2011. Click here.
View all notes |
Alert me of new notes |
CANSLIM.net Company Profile |
SEC |
Zacks Reports |
StockTalk |
News |
Chart |
Request a new note
C
A N
S L
I M
|
NFLX
-
NASDAQ
Netflix Inc
SPECIALTY RETAIL - Music and Video Stores
|
$204.63
|
-2.04
-0.99% |
$207.46
|
5,694,656
106.36% of 50 DAV
50 DAV is 5,354,000
|
$247.55
-17.34%
|
1/10/2011
|
$187.88
|
PP = $209.34
|
|
MB = $219.81
|
Most Recent Note - 2/28/2011 6:33:49 PM
G - Down today for its lowest close since its 1/27/11 breakaway gap. It is -16.5% off its high and enduring distributional pressure. Deterioration leading to a close below its significant prior high close ($205.90 on 11/30/10) would raise greater concerns, and its 50 DMA line defines the next important support level.
>>> The latest Featured Stock Update with an annotated graph appeared on 2/23/2011. Click here.
View all notes |
Alert me of new notes |
CANSLIM.net Company Profile |
SEC |
Zacks Reports |
StockTalk |
News |
Chart |
Request a new note
C
A N
S L
I M
|
Symbol/Exchange
Company Name
Industry Group |
PRICE |
CHANGE
(%Change) |
Day High |
Volume
(% DAV)
(% 50 day avg vol) |
52 Wk Hi
% From Hi |
Featured
Date |
Price
Featured |
Pivot Featured |
|
Max Buy |
OPEN
-
NASDAQ
Opentable Inc
INTERNET - Internet Software and Services
|
$85.21
|
-3.66
-4.12% |
$89.43
|
1,745,344
178.86% of 50 DAV
50 DAV is 975,800
|
$95.97
-11.21%
|
1/5/2011
|
$74.05
|
PP = $76.79
|
|
MB = $80.63
|
Most Recent Note - 3/1/2011 11:17:45 AM
G - Down today with increasing volume while slumping toward prior highs. Prior resistance near $82 defines support above its 50 DMA line. It has not built any recent sound base pattern.
>>> The latest Featured Stock Update with an annotated graph appeared on 2/15/2011. Click here.
View all notes |
Alert me of new notes |
CANSLIM.net Company Profile |
SEC |
Zacks Reports |
StockTalk |
News |
Chart |
Request a new note
C
A N
S L
I M
|
ORCL
-
NASDAQ
Oracle Corp
COMPUTER SOFTWARE and SERVICES - Application Software
|
$31.67
|
-1.24
-3.75% |
$33.08
|
30,419,348
119.53% of 50 DAV
50 DAV is 25,450,000
|
$33.71
-6.07%
|
1/20/2011
|
$32.31
|
PP = $32.37
|
|
MB = $33.99
|
Most Recent Note - 3/1/2011 4:21:32 PM
Y - Pulled back with +21% above average volume today and closed -6.1% from its 52-week high, violating support at its 50 DMA line and triggering a technical sell signal. A prompt rebound would help its outlook, meanwhile a prior chart low ($30.80 on 1/10/11) defines the next important support level to watch.
>>> The latest Featured Stock Update with an annotated graph appeared on 2/22/2011. Click here.
View all notes |
Alert me of new notes |
CANSLIM.net Company Profile |
SEC |
Zacks Reports |
StockTalk |
News |
Chart |
Request a new note
C
A N
S L
I M
|
PAY
-
NYSE
Verifone Systems Inc
COMPUTER HARDWARE - Transaction Automation Systems
|
$44.61
|
-0.83
-1.83% |
$45.77
|
2,140,176
142.73% of 50 DAV
50 DAV is 1,499,500
|
$49.91
-10.62%
|
1/27/2011
|
$41.77
|
PP = $44.97
|
|
MB = $47.22
|
Most Recent Note - 2/28/2011 6:39:22 PM
Y - Consolidating above its pivot point and old high close ($44.26 on 1/13/11), with additional support to watch at its 50 DMA line (now $42.46).
>>> The latest Featured Stock Update with an annotated graph appeared on 1/27/2011. Click here.
View all notes |
Alert me of new notes |
CANSLIM.net Company Profile |
SEC |
Zacks Reports |
StockTalk |
News |
Chart |
Request a new note
C
A N
S L
I M
|
PCLN
-
NASDAQ
Priceline.Com Inc
INTERNET - Internet Software and Services
|
$445.23
|
-8.65
-1.91% |
$452.24
|
1,795,141
171.00% of 50 DAV
50 DAV is 1,049,800
|
$469.40
-5.15%
|
1/3/2011
|
$399.55
|
PP = $428.20
|
|
MB = $449.61
|
Most Recent Note - 3/1/2011 4:30:02 PM
Y - Pulled back today from its 52-week high with a 3rd consecutive loss on above average volume after its 2/24/11 gap up. Reported earnings +71% on +35% sales revenues for the quarter ended December 31, 2010 versus the year ago period. More serious concerns and technical sell signals would be triggered by subsequent damaging losses below the $116.00 low previously noted.
>>> The latest Featured Stock Update with an annotated graph appeared on 2/14/2011. Click here.
View all notes |
Alert me of new notes |
CANSLIM.net Company Profile |
SEC |
Zacks Reports |
StockTalk |
News |
Chart |
Request a new note
C
A N
S L
I M
|
RAX
-
NYSE
Rackspace Hosting Inc
INTERNET - Internet Software and; Services
|
$35.73
|
-1.18
-3.20% |
$37.19
|
1,869,760
105.04% of 50 DAV
50 DAV is 1,780,000
|
$40.62
-12.04%
|
1/10/2011
|
$22.84
|
PP = $32.76
|
|
MB = $34.40
|
Most Recent Note - 3/1/2011 4:23:26 PM
G - Consolidating -12% off its all-time high with today's loss on average volume, slumping toward prior highs near $35 previously noted as defining support to watch above its 50 DMA line.
>>> The latest Featured Stock Update with an annotated graph appeared on 2/9/2011. Click here.
View all notes |
Alert me of new notes |
CANSLIM.net Company Profile |
SEC |
Zacks Reports |
StockTalk |
News |
Chart |
Request a new note
C
A N
S L
I M
|
Symbol/Exchange
Company Name
Industry Group |
PRICE |
CHANGE
(%Change) |
Day High |
Volume
(% DAV)
(% 50 day avg vol) |
52 Wk Hi
% From Hi |
Featured
Date |
Price
Featured |
Pivot Featured |
|
Max Buy |
TIBX
-
NASDAQ
Tibco Software Inc
COMPUTER SOFTWARE and SERVICES - Business Software and Services
|
$24.09
|
-0.53
-2.15% |
$24.79
|
2,407,521
86.20% of 50 DAV
50 DAV is 2,792,800
|
$25.94
-7.13%
|
2/1/2011
|
$24.35
|
PP = $22.18
|
|
MB = $23.29
|
Most Recent Note - 2/28/2011 6:45:28 PM
G - Consolidating -5.1% off its 52-week high today. Found support amid widespread market weakness last week well above prior highs in the $22 area defining support along with its 50 DMA line.
>>> The latest Featured Stock Update with an annotated graph appeared on 2/10/2011. Click here.
View all notes |
Alert me of new notes |
CANSLIM.net Company Profile |
SEC |
Zacks Reports |
StockTalk |
News |
Chart |
Request a new note
C
A N
S L
I M
|
UA
-
NYSE
Under Armour Inc Cl A
CONSUMER NON-DURABLES - Textile - Apparel Clothing
|
$64.47
|
-1.76
-2.66% |
$66.38
|
597,699
77.23% of 50 DAV
50 DAV is 773,900
|
$70.43
-8.46%
|
1/27/2011
|
$58.31
|
PP = $56.99
|
|
MB = $59.84
|
Most Recent Note - 3/1/2011 4:35:32 PM
G - Down today with below average volume, still quietly consolidating well above prior resistance and its 50 DMA line in the $60 area that define chart support to watch. It has not formed any recent sound base pattern.
>>> The latest Featured Stock Update with an annotated graph appeared on 2/1/2011. Click here.
View all notes |
Alert me of new notes |
CANSLIM.net Company Profile |
SEC |
Zacks Reports |
StockTalk |
News |
Chart |
Request a new note
C
A N
S L
I M
|
ULTA
-
NASDAQ
Ulta Salon Cosm & Frag
SPECIALTY RETAIL - Specialty Retail, Other
|
$41.05
|
-0.68
-1.63% |
$41.86
|
581,862
108.19% of 50 DAV
50 DAV is 537,800
|
$44.06
-6.83%
|
1/6/2011
|
$36.12
|
PP = $37.34
|
|
MB = $39.21
|
Most Recent Note - 2/28/2011 6:48:36 PM
G - Quietly consolidating -5.3% off its all-time high today. It has repeatedly been noted - "Extended from a sound base pattern, and prior highs in the $37-38 area define chart support to watch above its 50 DMA line."
>>> The latest Featured Stock Update with an annotated graph appeared on 2/17/2011. Click here.
View all notes |
Alert me of new notes |
CANSLIM.net Company Profile |
SEC |
Zacks Reports |
StockTalk |
News |
Chart |
Request a new note
C
A N
S L
I M
|