***Last / Change / Volume data in this table is the closing quote data***
Symbol/Exchange
Company Name
Industry Group |
PRICE |
CHANGE
(%Change) |
Day High |
Volume
(% DAV)
(% 50 day avg vol) |
52 Wk Hi
% From Hi |
Featured
Date |
Price
Featured |
Pivot Featured |
|
Max Buy |
ADS
-
NYSE
Alliance Data Sys Corp
COMPUTER SOFTWARE and SERVICES - Information and Delivery Service
|
$121.51
|
-0.57
-0.47% |
$122.22
|
404,900
57.65% of 50 DAV
50 DAV is 702,400
|
$122.62
-0.91%
|
1/17/2012
|
$108.24
|
PP = $107.43
|
|
MB = $112.80
|
Most Recent Note - 2/24/2012 3:58:41 PM
G - Inching higher on below average volume this week, wedging into new high territory. Its 50 DMA line defines support to watch on pullbacks while it is now extended from its latest base.
>>> The latest Featured Stock Update with an annotated graph appeared on 1/17/2012. Click here.
View all notes |
Alert me of new notes |
CANSLIM.net Company Profile |
SEC |
Zacks Reports |
StockTalk |
News |
Chart |
Request a new note
C
A N
S L
I M


|
ALXN
-
NASDAQ
Alexion Pharmaceuticals
DRUGS - Drug Manufacturers - Other
|
$84.85
|
+1.09
1.30% |
$84.86
|
1,337,481
108.26% of 50 DAV
50 DAV is 1,235,400
|
$87.63
-3.17%
|
11/30/2011
|
$68.66
|
PP = $70.52
|
|
MB = $74.05
|
Most Recent Note - 2/24/2012 4:00:35 PM
G - After volume-driven gains for new all-time highs this week it is more extended from its prior base. Support to watch is its 50 DMA line.
>>> The latest Featured Stock Update with an annotated graph appeared on 2/24/2012. Click here.
View all notes |
Alert me of new notes |
CANSLIM.net Company Profile |
SEC |
Zacks Reports |
StockTalk |
News |
Chart |
Request a new note
C
A N
S L
I M
|
BODY
-
NASDAQ
Body Central Corp
RETAIL - Catalog andamp; Mail Order Houses
|
$28.42
|
-0.42
-1.46% |
$29.16
|
80,020
46.12% of 50 DAV
50 DAV is 173,500
|
$29.49
-3.63%
|
1/27/2012
|
$26.69
|
PP = $25.46
|
|
MB = $26.73
|
Most Recent Note - 2/24/2012 4:02:00 PM
G - Up today for a 3rd consecutive small gain with light volume, getting more extended from its prior base. Prior highs in the $25-26 area recently acted as support after encountering some distributional pressure.
>>> The latest Featured Stock Update with an annotated graph appeared on 1/27/2012. Click here.
View all notes |
Alert me of new notes |
CANSLIM.net Company Profile |
SEC |
Zacks Reports |
StockTalk |
News |
Chart |
Request a new note
C
A N
S L
I M
|
CATM
-
NASDAQ
Cardtronics Inc
DIVERSIFIED SERVICES - Business/Management Services
|
$26.72
|
-0.24
-0.89% |
$27.37
|
328,027
79.41% of 50 DAV
50 DAV is 413,100
|
$28.74
-7.03%
|
2/24/2012
|
$27.94
|
PP = $28.30
|
|
MB = $29.72
|
Most Recent Note - 2/27/2012 5:26:39 PM
Y - Gapped down today for a damaging loss on light volume, finishing near the session low. Color code was changed to yellow with new pivot point cited based on its 1/19/12 high. Formed a "double bottom" base over the past 9 weeks during which it found prompt support at its 200 DMA line.
>>> The latest Featured Stock Update with an annotated graph appeared on 1/30/2012. Click here.
View all notes |
Alert me of new notes |
CANSLIM.net Company Profile |
SEC |
Zacks Reports |
StockTalk |
News |
Chart |
Request a new note
C
A N
S L
I M
|
CDNS
-
NASDAQ
Cadence Design Systems
COMPUTER SOFTWARE and SERVICES - Technical and System Software
|
$11.75
|
-0.07
-0.59% |
$11.94
|
2,930,417
97.25% of 50 DAV
50 DAV is 3,013,200
|
$12.11
-2.97%
|
2/3/2012
|
$11.66
|
PP = $11.15
|
|
MB = $11.71
|
Most Recent Note - 2/24/2012 4:13:06 PM
G - Its Relative Strength rating has slumped to 81, near the minimum 80+ guideline. Recently making limited progress while churning above average volume, a sign of distributional pressure while no resistance remains due to overhead supply.
>>> The latest Featured Stock Update with an annotated graph appeared on 2/3/2012. Click here.
View all notes |
Alert me of new notes |
CANSLIM.net Company Profile |
SEC |
Zacks Reports |
StockTalk |
News |
Chart |
Request a new note
C
A N
S L
I M
|
Symbol/Exchange
Company Name
Industry Group |
PRICE |
CHANGE
(%Change) |
Day High |
Volume
(% DAV)
(% 50 day avg vol) |
52 Wk Hi
% From Hi |
Featured
Date |
Price
Featured |
Pivot Featured |
|
Max Buy |
CELG
-
NASDAQ
Celgene Corp
DRUGS - Drug Manufacturers - Major
|
$73.76
|
-0.32
-0.43% |
$74.24
|
2,683,291
82.45% of 50 DAV
50 DAV is 3,254,500
|
$76.09
-3.06%
|
2/2/2012
|
$74.16
|
PP = $75.21
|
|
MB = $78.97
|
 Most Recent Note - 2/28/2012 5:59:31 PM
Y - Volume totals have been cooling since it stalled and slumped below the pivot point. Still perched within close striking distance of its all-time high ($77.39 in Aug '08). Any subsequent volume-driven gains would be a reassuring sign of fresh institutional demand, meanwhile its 50 DMA line and prior lows in the $71 area now coincide and define important chart support to watch.
>>> The latest Featured Stock Update with an annotated graph appeared on 2/2/2012. Click here.
View all notes |
Alert me of new notes |
CANSLIM.net Company Profile |
SEC |
Zacks Reports |
StockTalk |
News |
Chart |
Request a new note
C
A N
S L
I M
|
ECHO
-
NASDAQ
Echo Global Logistics
DIVERSIFIED SERVICES - Business/Management Services
|
$19.07
|
+0.37
1.98% |
$19.31
|
118,112
190.81% of 50 DAV
50 DAV is 61,900
|
$19.38
-1.60%
|
2/22/2012
|
$18.50
|
PP = $18.63
|
|
MB = $19.56
|
Most Recent Note - 2/28/2012 12:10:45 PM
Y - Up today with above average volume behind its gain, challenging its all-time high with no resistance remaining due to overhead supply. It has been consolidating below its "max buy" level after breaking out from a large cup shaped base.
>>> The latest Featured Stock Update with an annotated graph appeared on 2/23/2012. Click here.
View all notes |
Alert me of new notes |
CANSLIM.net Company Profile |
SEC |
Zacks Reports |
StockTalk |
News |
Chart |
Request a new note
C
A N
S L
I M
|
FEIC
-
NASDAQ
F E I Co
ELECTRONICS - Diversified Electronics
|
$44.70
|
-0.65
-1.43% |
$45.57
|
219,956
79.01% of 50 DAV
50 DAV is 278,400
|
$48.31
-7.47%
|
12/7/2011
|
$41.41
|
PP = $42.35
|
|
MB = $44.47
|
Most Recent Note - 2/27/2012 5:28:49 PM
G - Solid gain today on near average volume. Its 50 DMA line and prior highs in the $43 area recently acted as support, whereas violations may trigger technical sell signals. Reported earnings +21% on +14% sales revenues for the latest quarter ended December 31, 2011 versus the year ago period (below the +25% minimum guideline for earnings growth).
>>> The latest Featured Stock Update with an annotated graph appeared on 1/25/2012. Click here.
View all notes |
Alert me of new notes |
CANSLIM.net Company Profile |
SEC |
Zacks Reports |
StockTalk |
News |
Chart |
Request a new note
C
A N
S L
I M
|
GNC
-
NYSE
G N C Holdings Inc
RETAIL - Drug Stores
|
$32.73
|
+0.00
0.00% |
$33.22
|
570,633
55.04% of 50 DAV
50 DAV is 1,036,700
|
$33.70
-2.88%
|
1/19/2012
|
$28.99
|
PP = $29.60
|
|
MB = $31.08
|
Most Recent Note - 2/24/2012 3:50:59 PM
G - Pulling back on light volume today. Prior highs in the $29.50 area define support to watch on pullbacks.
>>> The latest Featured Stock Update with an annotated graph appeared on 1/19/2012. Click here.
View all notes |
Alert me of new notes |
CANSLIM.net Company Profile |
SEC |
Zacks Reports |
StockTalk |
News |
Chart |
Request a new note
C
A N
S L
I M
|
GOLD
-
NASDAQ
Randgold Resources Adr
METALS and MINING - Gold
|
$117.41
|
+2.55
2.22% |
$117.99
|
388,697
77.46% of 50 DAV
50 DAV is 501,800
|
$120.73
-2.75%
|
2/7/2012
|
$116.21
|
PP = $120.83
|
|
MB = $126.87
|
Most Recent Note - 2/28/2012 5:53:29 PM
Y - Inched higher with below average volume today, perched within close striking distance of prior highs. Found support at its 50 DMA line as it formed a downward sloping "handle" with losses on light volume following the previously noted base pattern. Subsequent volume-driven gains into new high territory may trigger a technical buy signal, however such convincing gains have not yet confirmed a fresh burst of great institutional buying demand. Meanwhile its 89 Relative Strength Rating is above the 80+ guideline for buy candidates, but its Relative Strength line was plotted higher later last year.
>>> The latest Featured Stock Update with an annotated graph appeared on 2/8/2012. Click here.
View all notes |
Alert me of new notes |
CANSLIM.net Company Profile |
SEC |
Zacks Reports |
StockTalk |
News |
Chart |
Request a new note
C
A N
S L
I M
|
Symbol/Exchange
Company Name
Industry Group |
PRICE |
CHANGE
(%Change) |
Day High |
Volume
(% DAV)
(% 50 day avg vol) |
52 Wk Hi
% From Hi |
Featured
Date |
Price
Featured |
Pivot Featured |
|
Max Buy |
HLF
-
NYSE
Herbalife Ltd
DRUGS - Nutrition and Weight Management
|
$66.97
|
+0.47
0.71% |
$67.20
|
1,764,724
142.22% of 50 DAV
50 DAV is 1,240,800
|
$67.40
-0.64%
|
2/22/2012
|
$65.90
|
PP = $63.50
|
|
MB = $66.68
|
Most Recent Note - 2/22/2012 7:45:08 PM
Y - Gapped up today and triggered a technical buy signal with a considerable volume-driven gain for a new 52-week high (N criteria). Reported earnings +25% on +20% sales revenues for the quarter ended December 31, 2011 versus the year ago period. Ownership by top-rated funds rose from 560 in Jun '11 to 627 in Dec '11, a reassuring trend concerning institutional interest (I criteria). See the latest FSU analysis for more details and a new annotated graph.
>>> The latest Featured Stock Update with an annotated graph appeared on 2/22/2012. Click here.
View all notes |
Alert me of new notes |
CANSLIM.net Company Profile |
SEC |
Zacks Reports |
StockTalk |
News |
Chart |
Request a new note
C
A N
S L
I M
|
HMSY
-
NASDAQ
H M S Holdings Corp
COMPUTER SOFTWARE and SERVICES - Healthcare Information Service
|
$32.30
|
-0.75
-2.27% |
$33.02
|
1,060,668
115.13% of 50 DAV
50 DAV is 921,300
|
$34.98
-7.65%
|
10/27/2011
|
$26.44
|
PP = $28.37
|
|
MB = $29.79
|
Most Recent Note - 2/28/2012 4:35:21 PM
G - Violated its 50 DMA line today with a loss on above average volume, raising more concerns. Following recent distributional action, any further deterioration below that important short-term average may clinch a more definitive technical sell signal. Meanwhile prior lows in the $30 area define the next chart support level to watch.
>>> The latest Featured Stock Update with an annotated graph appeared on 2/9/2012. Click here.
View all notes |
Alert me of new notes |
CANSLIM.net Company Profile |
SEC |
Zacks Reports |
StockTalk |
News |
Chart |
Request a new note
C
A N
S L
I M
|
ISRG
-
NASDAQ
Intuitive Surgical Inc
HEALTH SERVICES - Medical Appliances and Equipment
|
$515.69
|
+1.46
0.28% |
$517.49
|
205,220
55.30% of 50 DAV
50 DAV is 371,100
|
$518.47
-0.54%
|
12/20/2011
|
$442.43
|
PP = $449.16
|
|
MB = $471.62
|
Most Recent Note - 2/28/2012 6:04:36 PM
G - Perched near its all-time high with volume totals cooling while stubbornly holding its ground. It is extended from prior highs in the $475 area that define support to watch on pullbacks. December '11 quarterly earnings increased by just below the borderline +25% minimum guideline for ideal buy candidates.
>>> The latest Featured Stock Update with an annotated graph appeared on 1/18/2012. Click here.
View all notes |
Alert me of new notes |
CANSLIM.net Company Profile |
SEC |
Zacks Reports |
StockTalk |
News |
Chart |
Request a new note
C
A N
S L
I M
|
LULU
-
NASDAQ
Lululemon Athletica
MANUFACTURING - Textile Manufacturing
|
$67.74
|
+0.39
0.58% |
$67.84
|
1,407,341
57.12% of 50 DAV
50 DAV is 2,463,800
|
$67.57
0.25%
|
1/10/2012
|
$60.97
|
PP = $59.46
|
|
MB = $62.43
|
Most Recent Note - 2/28/2012 6:07:14 PM
G - Wedging higher without great volume conviction, today it inched to yet another new all-time high. Prior highs in the $61-64 area define initial chart support to watch on pullbacks.
>>> The latest Featured Stock Update with an annotated graph appeared on 2/21/2012. Click here.
View all notes |
Alert me of new notes |
CANSLIM.net Company Profile |
SEC |
Zacks Reports |
StockTalk |
News |
Chart |
Request a new note
C
A N
S L
I M
|
MA
-
NYSE
Mastercard Inc Cl A
DIVERSIFIED SERVICES - Business/Management Services
|
$423.97
|
+2.57
0.61% |
$426.00
|
969,140
87.95% of 50 DAV
50 DAV is 1,101,900
|
$422.08
0.45%
|
2/2/2012
|
$379.05
|
PP = $381.32
|
|
MB = $400.39
|
Most Recent Note - 2/22/2012 4:18:01 PM
G - Quietly rose to a new all-time high today and rallied beyond its "max buy" level. Color code is changed to green while getting extended from its prior highs. See the latest FSU analysis for more details and a new annotated graph.
>>> The latest Featured Stock Update with an annotated graph appeared on 2/17/2012. Click here.
View all notes |
Alert me of new notes |
CANSLIM.net Company Profile |
SEC |
Zacks Reports |
StockTalk |
News |
Chart |
Request a new note
C
A N
S L
I M
|
Symbol/Exchange
Company Name
Industry Group |
PRICE |
CHANGE
(%Change) |
Day High |
Volume
(% DAV)
(% 50 day avg vol) |
52 Wk Hi
% From Hi |
Featured
Date |
Price
Featured |
Pivot Featured |
|
Max Buy |
MELI
-
NASDAQ
Mercadolibre Inc
INTERNET - Internet Software and; Services
|
$101.10
|
-1.65
-1.61% |
$103.34
|
550,102
106.03% of 50 DAV
50 DAV is 518,800
|
$104.50
-3.25%
|
2/6/2012
|
$97.09
|
PP = $95.58
|
|
MB = $100.36
|
Most Recent Note - 2/27/2012 1:10:55 PM
G - Considerable gain today with above average volume helped it rally to a new all-time high above its "max buy" level. Color code is changed to green after getting extended from its prior base. Reported earnings +31% on +39% sales revenues for the quarter ended December 31, 2011 versus the year ago period.
>>> The latest Featured Stock Update with an annotated graph appeared on 2/6/2012. Click here.
View all notes |
Alert me of new notes |
CANSLIM.net Company Profile |
SEC |
Zacks Reports |
StockTalk |
News |
Chart |
Request a new note
C
A N
S L
I M
|
MKTX
-
NASDAQ
Marketaxess Holdings Inc
FINANCIAL SERVICES - Investment Brokerage - Nationa
|
$33.40
|
-0.05
-0.15% |
$33.82
|
204,263
84.09% of 50 DAV
50 DAV is 242,900
|
$35.42
-5.70%
|
10/28/2011
|
$29.79
|
PP = $31.05
|
|
MB = $32.60
|
Most Recent Note - 2/24/2012 12:38:26 PM
G - Consolidating near its all-time high, extended from any sound base. Found prompt support near its 50 DMA line after it completed a Secondary Offering of 3.6 million shares of common stock by selling stockholders on 2/22/12.
>>> The latest Featured Stock Update with an annotated graph appeared on 1/24/2012. Click here.
View all notes |
Alert me of new notes |
CANSLIM.net Company Profile |
SEC |
Zacks Reports |
StockTalk |
News |
Chart |
Request a new note
C
A N
S L
I M
|
RAX
-
NYSE
Rackspace Hosting Inc
INTERNET - Internet Software and; Services
|
$52.78
|
-0.60
-1.12% |
$53.88
|
1,433,871
73.06% of 50 DAV
50 DAV is 1,962,600
|
$56.94
-7.31%
|
2/2/2012
|
$46.69
|
PP = $45.55
|
|
MB = $47.83
|
Most Recent Note - 2/22/2012 4:08:16 PM
G - Up today with below average volume, still consolidating following a considerable 2/14/12 gap up gain with very heavy volume following strong earnings news. Now it is too extended from the previous base to be considered an ideal buy candidate under the fact-based investment system's guidelines.
>>> The latest Featured Stock Update with an annotated graph appeared on 2/16/2012. Click here.
View all notes |
Alert me of new notes |
CANSLIM.net Company Profile |
SEC |
Zacks Reports |
StockTalk |
News |
Chart |
Request a new note
C
A N
S L
I M
|
RRTS
-
NYSE
Roadrunner Trans Systems
TRANSPORTATION - Air Delivery and Freight Service
|
$17.79
|
+0.03
0.17% |
$17.93
|
42,534
30.42% of 50 DAV
50 DAV is 139,800
|
$18.44
-3.52%
|
2/10/2012
|
$17.40
|
PP = $17.50
|
|
MB = $18.38
|
Most Recent Note - 2/27/2012 12:52:31 PM
Y - Hovering within close striking distance of its 52-week high, stubbornly holding its ground. Prior highs in the $17 area define initial support to watch on pullbacks.
>>> The latest Featured Stock Update with an annotated graph appeared on 2/13/2012. Click here.
View all notes |
Alert me of new notes |
CANSLIM.net Company Profile |
SEC |
Zacks Reports |
StockTalk |
News |
Chart |
Request a new note
C
A N
S L
I M
|
SWI
-
NYSE
Solarwinds Inc
COMPUTER SOFTWARE and SERVICES - Application Software
|
$38.35
|
-0.10
-0.26% |
$38.90
|
461,498
39.44% of 50 DAV
50 DAV is 1,170,100
|
$39.75
-3.52%
|
1/26/2012
|
$32.36
|
PP = $33.78
|
|
MB = $35.47
|
Most Recent Note - 2/23/2012 6:27:18 PM
G - Hit another new all-time high today with a gain on light volume, getting more extended from its latest base. Earnings below the +25% guideline for the Dec '11 quarter raised fundamental concerns.
>>> The latest Featured Stock Update with an annotated graph appeared on 1/26/2012. Click here.
View all notes |
Alert me of new notes |
CANSLIM.net Company Profile |
SEC |
Zacks Reports |
StockTalk |
News |
Chart |
Request a new note
C
A N
S L
I M
|
Symbol/Exchange
Company Name
Industry Group |
PRICE |
CHANGE
(%Change) |
Day High |
Volume
(% DAV)
(% 50 day avg vol) |
52 Wk Hi
% From Hi |
Featured
Date |
Price
Featured |
Pivot Featured |
|
Max Buy |
SXCI
-
NASDAQ
S X C Health Solutions
COMPUTER SOFTWARE and SERVICES - Healthcare Information Service
|
$71.17
|
-0.10
-0.14% |
$71.89
|
336,076
91.97% of 50 DAV
50 DAV is 365,400
|
$72.34
-1.62%
|
2/23/2012
|
$68.24
|
PP = $66.05
|
|
MB = $69.35
|
Most Recent Note - 2/24/2012 3:56:17 PM
G - Color code is changed to green after getting extended beyond its "max buy" level with 4 consecutive volume-driven gains. Prior highs in the $66 area define support to watch on pullbacks.
>>> The latest Featured Stock Update with an annotated graph appeared on 1/20/2012. Click here.
View all notes |
Alert me of new notes |
CANSLIM.net Company Profile |
SEC |
Zacks Reports |
StockTalk |
News |
Chart |
Request a new note
C
A N
S L
I M
|
TDG
-
NYSE
Transdigm Group Inc
AEROSPACE/DEFENSE - Aerospace/Defense Products and; Services
|
$116.87
|
-0.65
-0.55% |
$118.91
|
299,838
84.94% of 50 DAV
50 DAV is 353,000
|
$121.48
-3.79%
|
1/10/2012
|
$98.83
|
PP = $102.83
|
|
MB = $107.97
|
Most Recent Note - 2/24/2012 12:57:45 PM
G - Still hovering near its all-time high, stubbornly holding its ground, on the cusp of completing an advanced "3-weeks tight" base pattern. Prior highs near $102 define the initial support level to watch above its 50 DMA line.
>>> The latest Featured Stock Update with an annotated graph appeared on 2/10/2012. Click here.
View all notes |
Alert me of new notes |
CANSLIM.net Company Profile |
SEC |
Zacks Reports |
StockTalk |
News |
Chart |
Request a new note
C
A N
S L
I M
|
TNGO
-
NASDAQ
Tangoe Inc
COMPUTER SOFTWARE and SERVICES - Technical and System Software
|
$19.30
|
-0.06
-0.31% |
$19.70
|
467,088
150.33% of 50 DAV
50 DAV is 310,700
|
$19.90
-3.02%
|
2/13/2012
|
$15.39
|
PP = $16.51
|
|
MB = $17.34
|
Most Recent Note - 2/24/2012 3:40:27 PM
G - Getting more extended from its prior base, and above average volume is behind today's 4th consecutive gain. Prior highs in the $16 area define initial support to watch on pullbacks.
>>> The latest Featured Stock Update with an annotated graph appeared on 2/14/2012. Click here.
View all notes |
Alert me of new notes |
CANSLIM.net Company Profile |
SEC |
Zacks Reports |
StockTalk |
News |
Chart |
Request a new note
C
A N
S L
I M
|
TSCO
-
NASDAQ
Tractor Supply Co
SPECIALTY RETAIL - Specialty Retail, Other
|
$86.56
|
-0.86
-0.98% |
$88.65
|
733,067
99.97% of 50 DAV
50 DAV is 733,300
|
$87.97
-1.60%
|
1/12/2012
|
$79.12
|
PP = $75.58
|
|
MB = $79.36
|
Most Recent Note - 2/27/2012 5:24:59 PM
G - Up today with +58% above average volume for a new all-time high. Its 50 DMA line defines support to watch on pullbacks. See the latest FSU analysis for more details and a new annotated graph.
>>> The latest Featured Stock Update with an annotated graph appeared on 2/27/2012. Click here.
View all notes |
Alert me of new notes |
CANSLIM.net Company Profile |
SEC |
Zacks Reports |
StockTalk |
News |
Chart |
Request a new note
C
A N
S L
I M
|
UA
-
NYSE
Under Armour Inc Cl A
CONSUMER NON-DURABLES - Textile - Apparel Clothing
|
$87.72
|
+0.56
0.64% |
$88.90
|
1,212,941
97.36% of 50 DAV
50 DAV is 1,245,800
|
$87.77
-0.06%
|
2/15/2012
|
$85.77
|
PP = $84.86
|
|
MB = $89.10
|
Most Recent Note - 2/24/2012 3:46:01 PM
Y - Gapped up today and rallied above its pivot point, however volume is not running at a pace substantially above average. A minimum of +40% above average volume is sufficient volume behind a gain to trigger a proper technical buy signal, and heavier volume is considered a true sign of institutional positioning, otherwise a sustained and meaningful advance in price is less likely.
>>> The latest Featured Stock Update with an annotated graph appeared on 2/15/2012. Click here.
View all notes |
Alert me of new notes |
CANSLIM.net Company Profile |
SEC |
Zacks Reports |
StockTalk |
News |
Chart |
Request a new note
C
A N
S L
I M
|
Symbol/Exchange
Company Name
Industry Group |
PRICE |
CHANGE
(%Change) |
Day High |
Volume
(% DAV)
(% 50 day avg vol) |
52 Wk Hi
% From Hi |
Featured
Date |
Price
Featured |
Pivot Featured |
|
Max Buy |
UBNT
-
NASDAQ
Ubiquiti Networks Inc
TELECOMMUNICATIONS - Diversified Communication Serv
|
$27.80
|
-0.81
-2.83% |
$28.97
|
322,616
106.79% of 50 DAV
50 DAV is 302,100
|
$28.68
-3.07%
|
1/27/2012
|
$22.25
|
PP = $23.14
|
|
MB = $24.30
|
Most Recent Note - 2/27/2012 1:14:27 PM
G - Hitting another new high today, on track for a 4th consecutive gain. It is too extended from its prior base to be considered buyable under the investment system's guidelines, and patient investors may watch for secondary buy points to possibly develop and be noted.
>>> The latest Featured Stock Update with an annotated graph appeared on 2/1/2012. Click here.
View all notes |
Alert me of new notes |
CANSLIM.net Company Profile |
SEC |
Zacks Reports |
StockTalk |
News |
Chart |
Request a new note
C
A N
S L
I M
|
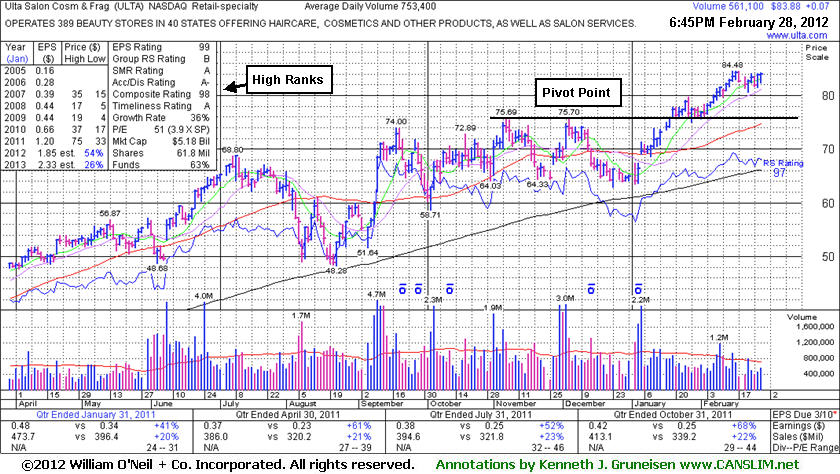
ULTA
-
NASDAQ
Ulta Salon Cosm & Frag
SPECIALTY RETAIL - Specialty Retail, Other
|
$83.88
|
+0.07
0.08% |
$84.16
|
561,180
74.49% of 50 DAV
50 DAV is 753,400
|
$84.48
-0.71%
|
1/11/2012
|
$71.97
|
PP = $75.80
|
|
MB = $79.59
|
Most Recent Note - 2/28/2012 7:09:26 PM
G - Posted a gain today with light volume. It has been quietly hovering near its all-time high, extended from any sound base pattern. Prior highs near $75 define initial chart support above its 50 DMA line. See the latest FSU analysis for more details and a new annotated graph.
>>> The latest Featured Stock Update with an annotated graph appeared on 2/28/2012. Click here.
View all notes |
Alert me of new notes |
CANSLIM.net Company Profile |
SEC |
Zacks Reports |
StockTalk |
News |
Chart |
Request a new note
C
A N
S L
I M
|
V
-
NYSE
Visa Inc Cl A
DIVERSIFIED SERVICES - Business/Management Services
|
$118.95
|
+2.09
1.79% |
$118.97
|
2,984,300
72.87% of 50 DAV
50 DAV is 4,095,400
|
$117.77
1.00%
|
2/2/2012
|
$105.43
|
PP = $104.30
|
|
MB = $109.52
|
Most Recent Note - 2/24/2012 3:53:40 PM
G - Inching to new high territory this week with below average volume conviction behind its gains. Prior highs in the $103-104 area define initial support to watch on pullbacks.
>>> The latest Featured Stock Update with an annotated graph appeared on 1/23/2012. Click here.
View all notes |
Alert me of new notes |
CANSLIM.net Company Profile |
SEC |
Zacks Reports |
StockTalk |
News |
Chart |
Request a new note
C
A N
S L
I M
|