You are not logged in.
This means you
CAN ONLY VIEW reports that were published prior to Monday, April 14, 2025.
You
MUST UPGRADE YOUR MEMBERSHIP if you want to see any current reports.
AFTER MARKET UPDATE - THURSDAY, FEBRUARY 27TH, 2014
Previous After Market Report Next After Market Report >>>
|
|
|
|
DOW |
+74.24 |
16,272.65 |
+0.46% |
|
Volume |
682,885,350 |
+4% |
|
Volume |
1,885,570,560 |
-4% |
|
NASDAQ |
+26.87 |
4,318.93 |
+0.63% |
|
Advancers |
2,047 |
65% |
|
Advancers |
1,679 |
62% |
|
S&P 500 |
+9.13 |
1,854.29 |
+0.49% |
|
Decliners |
980 |
31% |
|
Decliners |
919 |
34% |
|
Russell 2000 |
+6.22 |
1,187.94 |
+0.53% |
|
52 Wk Highs |
135 |
|
|
52 Wk Highs |
150 |
|
|
S&P 600 |
+2.07 |
667.49 |
+0.31% |
|
52 Wk Lows |
15 |
|
|
52 Wk Lows |
3 |
|
|
 |
Major Averages Rose With Positive Breadth But Less Leadership
Kenneth J. Gruneisen - Passed the CAN SLIM® Master's Exam
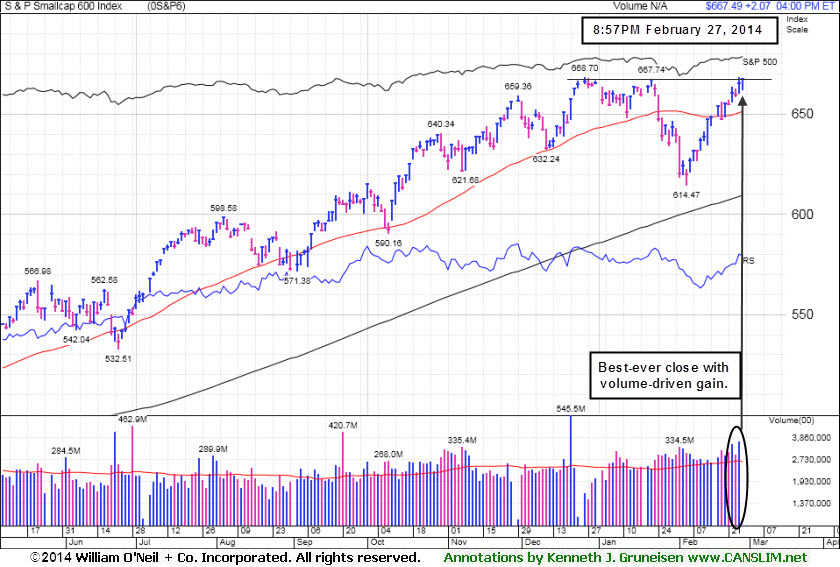
The indices tallied gains while Thursday's volume totals were reported mixed, slightly higher than the prior trading session's volume total on the NYSE and slightly lower on the Nasdaq. Breadth was positive as advancers led decliners by a 2-1 ratio on the NYSE and by better than 3-2 on the Nasdaq exchange. There were 55 high-ranked companies from the CANSLIM.net Leaders List that made new 52-week highs and appeared on the CANSLIM.net BreakOuts Page, down from the total of 89 stocks on the prior session. The list of stocks hitting new 52-week highs easily outnumbered new 52-week lows on the Nasdaq exchange and on the NYSE. There were gains for 6 of the 11 high-ranked companies currently included on the Featured Stocks Page. The Market (M criteria) environment has been noted as a "Confirmed Uptrend". For any rally to be sustained it is critical for there to be healthy leadership, so it remains crucial for many stocks to continue hitting new 52-week highs.
The major averages enjoyed a positive session following comments from Fed Chair Janet Yellen. In her testimony before the Senate Finance committee, Yellen reiterated the central bank's intention to continue tapering its asset purchases at a measured pace. On the data front, weekly jobless claims rose more-than-expected to 348,000. A separate release showed durable goods orders declined -1.0% in January, less than a projected -1.7% decline.
Most sectors were higher with telecom and materials among the best performing groups. Verizon (VZ +2.48%). Coal producer Cliffs Natural Resources (CLF +2.78%). Retailer J.C. Penney (JCP +25.34%) was a notable gainer, rallying after reporting its first quarterly profit in more than two years. The Energy sector was down as refiner Valero Energy (VLO -4.36%) slumped and Transocean (RIG -1.07%) was down after posting a revenues shortfall.
The CANSLIM.net Featured Stocks Page shows the most action-worthy candidates and their latest notes and a Headline Link directs members to the latest detailed analysis with data-packed graphs annotated by a Certified expert along with links to additional resources. The Premium Member Homepage includes "dynamic archives" to all prior pay reports published. Watch for an announcement via email concerning the next WEBCAST.
PICTURED: The S&P 600 Small Cap Index posted a small gain and finished at a best-ever close.
|
 Kenneth J. Gruneisen started out as a licensed stockbroker in August 1987, a couple of months prior to the historic stock market crash that took the Dow Jones Industrial Average down -22.6% in a single day. He has published daily fact-based fundamental and technical analysis on high-ranked stocks online for two decades. Through FACTBASEDINVESTING.COM, Kenneth provides educational articles, news, market commentary, and other information regarding proven investment systems that work in good times and bad.
Comments contained in the body of this report are technical opinions only and are not necessarily those of Gruneisen Growth Corp. The material herein has been obtained from sources believed to be reliable and accurate, however, its accuracy and completeness cannot be guaranteed. Our firm, employees, and customers may effect transactions, including transactions contrary to any recommendation herein, or have positions in the securities mentioned herein or options with respect thereto. Any recommendation contained in this report may not be suitable for all investors and it is not to be deemed an offer or solicitation on our part with respect to the purchase or sale of any securities. |
|
 |
Oil Services and Financial Groups Rose Amid Mixed Group Action
Kenneth J. Gruneisen - Passed the CAN SLIM® Master's Exam
Financial shares had a positive bias as the Bank Index ($BKX +0.37%) and the Broker/Dealer Index ($XBD +0.42%) posted modest gains on Thursday. The tech sector was mixed with the Biotechnology Index ($BTK -0.53%) ending lower while the Semiconductor Index ($SOX -0.01%) finished flat and the Networking Index ($NWX +0.19%) eked out a small gain. The Retail Index ($RLX +0.14%) inched higher and the Oil Services Index ($OSX +0.44%) rose while the Integrated Oil Index ($XOI -0.28%) and the Gold & Silver Index ($XAU -0.16%) finished with small losses
Charts courtesy www.stockcharts.com
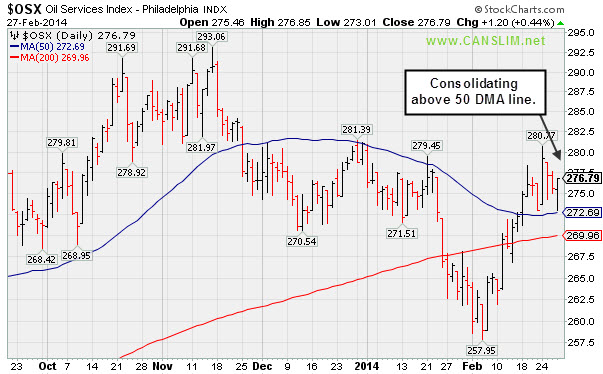
PICTURED: The Oil Services Index ($OSX +0.44%) is consolidating above its 50-day moving average (DMA) line.
| Oil Services |
$OSX |
276.79 |
+1.20 |
+0.44% |
-1.51% |
| Integrated Oil |
$XOI |
1,468.28 |
-4.15 |
-0.28% |
-2.32% |
| Semiconductor |
$SOX |
564.22 |
-0.07 |
-0.01% |
+5.46% |
| Networking |
$NWX |
347.36 |
+0.65 |
+0.19% |
+7.23% |
| Broker/Dealer |
$XBD |
159.10 |
+0.67 |
+0.42% |
-0.91% |
| Retail |
$RLX |
934.42 |
+1.26 |
+0.14% |
-0.57% |
| Gold & Silver |
$XAU |
100.09 |
-0.16 |
-0.16% |
+18.94% |
| Bank |
$BKX |
68.73 |
+0.25 |
+0.37% |
-0.77% |
| Biotech |
$BTK |
2,878.07 |
-15.36 |
-0.53% |
+23.50% |
|
|
|
 |
Strong Earnings Report; On Track for 9th Weekly Gain in 10 Weeks
Kenneth J. Gruneisen - Passed the CAN SLIM® Master's Exam
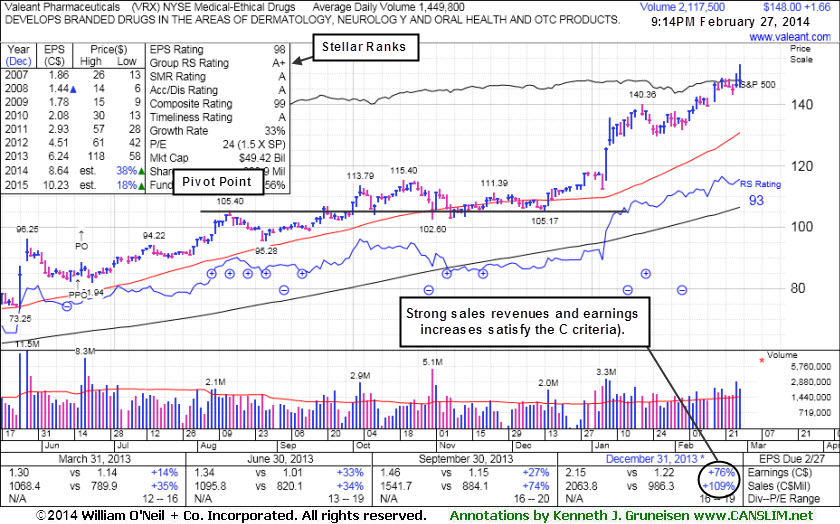
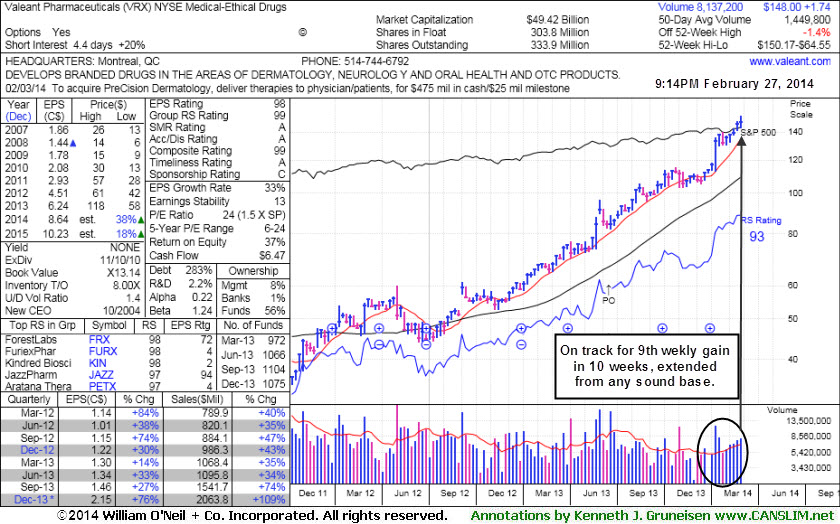
Valeant Pharmaceuticals International, Inc (VRX +$0.20 or +0.15% to $148 .13) reported better than expected Dec '13 quarterly results with earnings +76% on +109% sales revenues. It hit new all-time highs again today and it is very extended from any sound base while on track for its 9th weekly gain in the span of 10 weeks. Its 50-day moving average (DMA) line and recent lows coincide near $130 defining important near-term support to watch. VRX was last shown in this FSU section on 2/10/14 with annotated daily and weekly graphs under the headline, "Hovering Near All-Time Highs Extended From Sound Base". Patient investors may watch for a new sound base to possibly develop and be noted in the future.
The strong quarterly result were a very reassuring follow-up to its earnings increae of +24% on +74% sales revenues for the Sep '13 quarter, a notch below the +25% minimum guideline (C criteria). A downturn in FY '07 and '08 earnings (A criteria) was been followed by a strong earnings rebound in recent years. Return On Equity is currently reported at 37%, well above the 17% minimum guideline of the fact-based system.
The number of top-rated funds owning its shares rose from 818 in Mar '12 in to 1,075 in Dec '13, a reassuring trend concerning the I criteria. The high-ranked Medical - Ethical Drugs firm's shares spiked higher in late May at around the time of M&A news that it would buy Bausch & Lomb for $8.7 billion. It completed Public Offering on 6/18/13. The upshot of Public Offerings is that when completed the end result is typically an increase in the total number of institutional owners. Institutional owners are often supportive of their existing positions and will even accumulate more shares when they consolidate near classic support levels like the 50-day and 200-day moving average (DMA) lines, if they are still believers in the company. If too many become pessimistic and decide to unload, this is what ends up sending the stocks slicing through support.
Prior reports noted - "Investors are taught in the Certification to only buy stocks with a combination of both strong fundamentals and strong technical action, however stocks should be sold based on their technical action only. In this example, more bullish action rewarded patient investors still giving it the benefit of the doubt until any technical sell signals start adding up."
|
|
|
Color Codes Explained :
Y - Better candidates highlighted by our
staff of experts.
G - Previously featured
in past reports as yellow but may no longer be buyable under the
guidelines.
***Last / Change / Volume data in this table is the closing quote data***
Symbol/Exchange
Company Name
Industry Group |
PRICE |
CHANGE
(%Change) |
Day High |
Volume
(% DAV)
(% 50 day avg vol) |
52 Wk Hi
% From Hi |
Featured
Date |
Price
Featured |
Pivot Featured |
|
Max Buy |
EQM
-
NYSE
E Q T Midstream Partners
ENERGY - Oil and Gas Pipelines
|
$65.50
|
-0.45
-0.68% |
$66.32
|
94,004
82.46% of 50 DAV
50 DAV is 114,000
|
$67.80
-3.39%
|
12/12/2013
|
$53.17
|
PP = $56.51
|
|
MB = $59.34
|
Most Recent Note - 2/26/2014 6:19:41 PM
G - Posted a gain today with lighter volume. Recently enduring distributional pressure. Reported earnings -2% on +22% sales revenues for the Dec '13 quarter, below the +25% minimum earnings guideline (C criteria), raising fundamental concerns. Its 50 DMA line defines near-term support where a violation may trigger a technical sell signal.
>>> FEATURED STOCK ARTICLE : Leader Still Extended From Any Sound Base - 2/7/2014
View all notes |
Set NEW NOTE alert |
CANSLIM.net Company Profile |
SEC
News |
Chart |
Request a new note
C
A N
S L
I M


|
FB
-
NASDAQ
Facebook Inc Cl A
INTERNET
|
$68.94
|
-0.32
-0.46% |
$70.01
|
41,695,855
62.54% of 50 DAV
50 DAV is 66,674,000
|
$71.44
-3.50%
|
12/12/2013
|
$51.40
|
PP = $54.93
|
|
MB = $57.68
|
Most Recent Note - 2/25/2014 7:49:45 PM
G - Pulled back on light volume today after recent gains on higher volume for new all-time highs. Extended from any sound base and well beyond the "secondary buy point" previously noted. Prior highs and its 50 DMA line coincide near $58 defining very important near-term support to watch on pullbacks. See the latest FSU analysis for more details and new annotated graphs.
>>> FEATURED STOCK ARTICLE : High-Ranked Internet Group Leader is Extended From Base - 2/25/2014
View all notes |
Set NEW NOTE alert |
CANSLIM.net Company Profile |
SEC
News |
Chart |
Request a new note
C
A N
S L
I M
|
GNRC
-
NYSE
Generac Hldgs Inc
Electrical-Power/Equipmt
|
$57.80
|
+0.17
0.29% |
$57.82
|
606,890
64.56% of 50 DAV
50 DAV is 940,000
|
$58.08
-0.48%
|
2/14/2014
|
$56.50
|
PP = $57.39
|
|
MB = $60.26
|
Most Recent Note - 2/26/2014 3:10:55 PM
Y - Hit a new 52-week high and traded above its pivot point today while volume has been running at a below average pace. Recently encountering resistance near prior highs in the $57 area. Volume should be at least +40% above average as a stock rallies above its pivot point to trigger a proper technical buy signal.
>>> FEATURED STOCK ARTICLE : Following Island Reversal Prior Highs May Act as Resistance - 2/14/2014
View all notes |
Set NEW NOTE alert |
CANSLIM.net Company Profile |
SEC
News |
Chart |
Request a new note
C
A N
S L
I M
|
JAZZ
-
NASDAQ
Jazz Pharmaceuticals Plc
DRUGS - Biotechnology
|
$166.62
|
+4.56
2.81% |
$167.17
|
1,382,391
135.40% of 50 DAV
50 DAV is 1,021,000
|
$176.60
-5.65%
|
9/30/2013
|
$93.20
|
PP = $89.10
|
|
MB = $93.56
|
 Most Recent Note - 2/27/2014 12:43:05 PM
G - Very extended from any sound base and encountering distributional pressure this week. Reported earnings +12% on +28% sales revenues for the Dec '13 quarter, below the +25% minimum earnings guideline (C criteria), raising fundamental concerns. Its 50 DMA line ($145) and recent lows in the $135 area define important support to watch on pullbacks where violations may trigger technical sell signals.
>>> FEATURED STOCK ARTICLE : Financial Report May Prompt Greater Volume and Volatility - 2/21/2014
View all notes |
Set NEW NOTE alert |
CANSLIM.net Company Profile |
SEC
News |
Chart |
Request a new note
C
A N
S L
I M
|
KORS
-
NYSE
Michael Kors Hldgs Ltd
RETAIL - Apparel Stores
|
$99.56
|
+0.24
0.24% |
$100.41
|
1,418,029
35.26% of 50 DAV
50 DAV is 4,022,000
|
$101.04
-1.46%
|
2/4/2014
|
$90.92
|
PP = $84.68
|
|
MB = $88.91
|
Most Recent Note - 2/26/2014 3:06:59 PM
G - Perched at its 52-week high after still wedging higher with recent gains lacking great volume conviction, getting very extended from its prior base. Prior highs in the $84 area define the nearest chart support level.
>>> FEATURED STOCK ARTICLE : Extended From Sound Base and Wedging Higher - 2/19/2014
View all notes |
Set NEW NOTE alert |
CANSLIM.net Company Profile |
SEC
News |
Chart |
Request a new note
C
A N
S L
I M
|
Symbol/Exchange
Company Name
Industry Group |
PRICE |
CHANGE
(%Change) |
Day High |
Volume
(% DAV)
(% 50 day avg vol) |
52 Wk Hi
% From Hi |
Featured
Date |
Price
Featured |
Pivot Featured |
|
Max Buy |
LEAF
-
NYSE
Springleaf Holdings Inc
Finance-Consumer Loans
|
$27.16
|
-0.33
-1.20% |
$27.65
|
451,021
131.88% of 50 DAV
50 DAV is 342,000
|
$29.50
-7.93%
|
2/24/2014
|
$28.60
|
PP = $27.44
|
|
MB = $28.81
|
Most Recent Note - 2/26/2014 6:17:51 PM
Y - Finished at the session low today with a loss on above average volume. Heavier volume was behind prior considerable gains as it broke out when highlighted in yellow in the 2/24/14 mid-day report with an annotated daily graph (read here). Prior highs define initial support to watch. Other leadership (L criteria) in the group is reassuring, however the industry group has a D+ rating. A subsequent close below its prior high close ($27.17 on 1/08/14) would raise concerns. Disciplined investors avoid chasing extended stocks more than +5% above prior highs and always limit losses by selling any stock that falls more than -7% from their purchase price. See the new annotated graph below this note.

>>> FEATURED STOCK ARTICLE : Breakout Backed by Four Times Average Volume - 2/24/2014
View all notes |
Set NEW NOTE alert |
CANSLIM.net Company Profile |
SEC
News |
Chart |
Request a new note
C
A N
S L
I M
|
PCLN
-
NASDAQ
Priceline.com Inc
INTERNET - Internet Software and Services
|
$1,357.79
|
+0.85
0.06% |
$1,363.09
|
629,821
83.20% of 50 DAV
50 DAV is 757,000
|
$1,375.41
-1.28%
|
12/18/2013
|
$1,156.20
|
PP = $1,198.85
|
|
MB = $1,258.79
|
Most Recent Note - 2/25/2014 12:22:28 PM
G - Hitting yet another new 52-week high today, adding to an impressive streak of gains marked by above average volume. Rallying with no resistance due to overhead supply, getting more extended from any sound base.
>>> FEATURED STOCK ARTICLE : Extended From Prior Highs After 6th Straight Gain - 2/13/2014
View all notes |
Set NEW NOTE alert |
CANSLIM.net Company Profile |
SEC
News |
Chart |
Request a new note
C
A N
S L
I M
|
QCOR
-
NASDAQ
Questcor Pharmaceuticals
DRUGS - Biotechnology
|
$67.47
|
-6.74
-9.08% |
$73.58
|
10,312,970
505.79% of 50 DAV
50 DAV is 2,039,000
|
$80.25
-15.93%
|
2/26/2014
|
$76.30
|
PP = $74.86
|
|
MB = $78.60
|
Most Recent Note - 2/27/2014 2:08:33 PM
Y - Raising concerns while undercutting prior highs with today's 3rd consecutive loss on above average and ever-increasing volume. Disciplined investors avoid chasing extended stocks more than +5% above prior highs and always limit losses by selling any stock that falls more than -7% from their purchase price.
>>> FEATURED STOCK ARTICLE : Prior Highs Define Initial Support Following Recent Breakout - 2/26/2014
View all notes |
Set NEW NOTE alert |
CANSLIM.net Company Profile |
SEC
News |
Chart |
Request a new note
C
A N
S L
I M
|
SILC
-
NASDAQ
Silicom Ltd
COMPUTER HARDWARE - Networking andamp; Communication Dev
|
$70.21
|
-0.15
-0.21% |
$70.56
|
69,438
95.12% of 50 DAV
50 DAV is 73,000
|
$71.49
-1.79%
|
12/23/2013
|
$44.62
|
PP = $46.25
|
|
MB = $48.56
|
Most Recent Note - 2/27/2014 2:10:24 PM
G - Extended from any sound base and on track for an 11th consecutive weekly gain. Patient investors may watch for a new base or secondary buy point to possibly develop and be noted in the weeks ahead.
>>> FEATURED STOCK ARTICLE : Stubbornly Held Ground Following Breakaway Gap - 2/11/2014
View all notes |
Set NEW NOTE alert |
CANSLIM.net Company Profile |
SEC
News |
Chart |
Request a new note
C
A N
S L
I M
|
ULTI
-
NASDAQ
Ultimate Software Group
INTERNET - Internet Software and Services
|
$169.00
|
+0.44
0.26% |
$169.68
|
103,736
50.36% of 50 DAV
50 DAV is 206,000
|
$171.96
-1.72%
|
1/27/2014
|
$153.75
|
PP = $162.98
|
|
MB = $171.13
|
Most Recent Note - 2/26/2014 3:13:08 PM
Y - Perched near its all-time high stubbornly holding its ground after recently wedging higher with gains lacking great volume conviction. Still trading below its "max buy" level. Found support above its 50 DMA line following a worrisome "negative reversal" on 2/05/14.
>>> FEATURED STOCK ARTICLE : Stalled and Encountering Distributional Pressure - 2/12/2014
View all notes |
Set NEW NOTE alert |
CANSLIM.net Company Profile |
SEC
News |
Chart |
Request a new note
C
A N
S L
I M
|
Symbol/Exchange
Company Name
Industry Group |
PRICE |
CHANGE
(%Change) |
Day High |
Volume
(% DAV)
(% 50 day avg vol) |
52 Wk Hi
% From Hi |
Featured
Date |
Price
Featured |
Pivot Featured |
|
Max Buy |
VRX
-
NYSE
Valeant Pharmaceuticals
DRUGS - Drug Manufacturers - Other
|
$148.00
|
+1.66
1.13% |
$153.10
|
2,122,344
146.47% of 50 DAV
50 DAV is 1,449,000
|
$150.17
-1.45%
|
9/11/2013
|
$100.26
|
PP = $105.50
|
|
MB = $110.78
|
Most Recent Note - 2/27/2014 9:31:09 PM
G - Reported +76% earnings on +109% sales revenues for the Dec '13 quarter. Hit new all-time highs again today. On track for a 9th weekly gain in 10 weeks, very extended from any sound base. See the latest FSU analysis for more details and new annotated graphs.
>>> FEATURED STOCK ARTICLE : Strong Earnings Report; On Track for 9th Weekly Gain in 10 Weeks - 2/27/2014
View all notes |
Set NEW NOTE alert |
CANSLIM.net Company Profile |
SEC
News |
Chart |
Request a new note
C
A N
S L
I M
|
|
|
|
THESE ARE NOT BUY RECOMMENDATIONS!
Comments contained in the body of this report are technical
opinions only. The material herein has been obtained
from sources believed to be reliable and accurate, however,
its accuracy and completeness cannot be guaranteed.
This site is not an investment advisor, hence it does
not endorse or recommend any securities or other investments.
Any recommendation contained in this report may not
be suitable for all investors and it is not to be deemed
an offer or solicitation on our part with respect to
the purchase or sale of any securities. All trademarks,
service marks and trade names appearing in this report
are the property of their respective owners, and are
likewise used for identification purposes only.
This report is a service available
only to active Paid Premium Members.
You may opt-out of receiving report notifications
at any time. Questions or comments may be submitted
by writing to Premium Membership Services 665 S.E. 10 Street, Suite 201 Deerfield Beach, FL 33441-5634 or by calling 1-800-965-8307
or 954-785-1121.
|
|
|

