You are not logged in.
This means you
CAN ONLY VIEW reports that were published prior to Monday, April 14, 2025.
You
MUST UPGRADE YOUR MEMBERSHIP if you want to see any current reports.
AFTER MARKET UPDATE - WEDNESDAY, FEBRUARY 26TH, 2014
Previous After Market Report Next After Market Report >>>
|
|
|
|
DOW |
+18.75 |
16,198.41 |
+0.12% |
|
Volume |
656,303,530 |
+4% |
|
Volume |
1,959,868,390 |
-1% |
|
NASDAQ |
+4.47 |
4,292.06 |
+0.10% |
|
Advancers |
1,848 |
59% |
|
Advancers |
1,587 |
59% |
|
S&P 500 |
+0.04 |
1,845.16 |
+0.00% |
|
Decliners |
1,171 |
37% |
|
Decliners |
1,014 |
38% |
|
Russell 2000 |
+7.77 |
1,181.72 |
+0.66% |
|
52 Wk Highs |
174 |
|
|
52 Wk Highs |
180 |
|
|
S&P 600 |
+5.71 |
665.42 |
+0.87% |
|
52 Wk Lows |
22 |
|
|
52 Wk Lows |
17 |
|
|
 |
Major Averages Ended Slightly Higher
Kenneth J. Gruneisen - Passed the CAN SLIM® Master's Exam
Stocks gave back most of their gains to end the session little changed on Wednesday. The volume totals were reported near but slightly higher than the prior trading session's volume totals on the NYSE and slightly lower on the Nasdaq. Breadth was positive as advancers led decliners by a 3-2 ratio on the NYSE and on the Nasdaq exchange. There were 89 high-ranked companies from the CANSLIM.net Leaders List that made new 52-week highs and appeared on the CANSLIM.net BreakOuts Page, up from the total of 69 stocks on the prior session. The list of stocks hitting new 52-week highs easily outnumbered new 52-week lows on the Nasdaq exchange and on the NYSE. There were gains for 5 of the 11 high-ranked companies currently included on the Featured Stocks Page. The Market (M criteria) environment has been noted as a "Confirmed Uptrend". For any rally to be sustained it is critical for there to be healthy leadership, so it remains crucial for many stocks to continue hitting new 52-week highs.
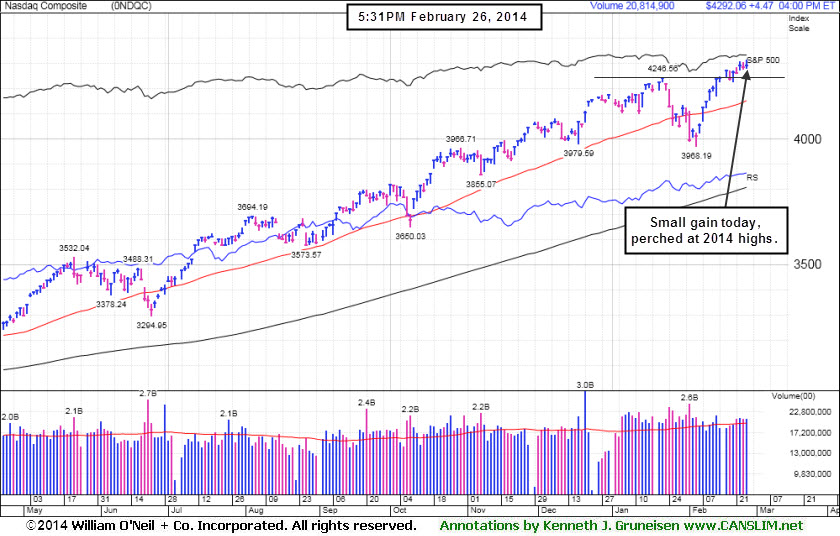
Positive data on housing and earnings by retailers helped as the Dow rose 19 points to 16,198. The S&P 500 failed to hold its advance above its all-time high for a third day, closing up less than a point at 1,845. The NASDAQ gained 4 points to 4,292.
PulteGroup (PHM +2.8%) and D.R. Horton (DHI +2.9%) both rose after a report showed new home sales unexpectedly jumped +9.6% in January. Shares of Lowe's (LOW +5.4%) and Target (TGT +7%) climbed after both posted better-than-expected quarterly results. Materials were the best performing sector in the S&P 500 today. Metal producers paced the group's advance with Alcoa (AA +3.7%) and U.S. Steel (X +2.2%) rising. Energy was the worst performing group on the session. First Solar (FSLR -9.1%) gapped down after its disappointing earnings release. Chesapeake Energy (CHK -4.9%) fell after reporting profits below consensus estimates.
Treasuries rallied after a $35 billion auction of 5-year notes drew stronger-than-expected demand. Benchmark 10-year notes were up 11/32 to yield 2.66%.
The CANSLIM.net Featured Stocks Page shows the most action-worthy candidates and their latest notes and a Headline Link directs members to the latest detailed analysis with data-packed graphs annotated by a Certified expert along with links to additional resources. The Premium Member Homepage includes "dynamic archives" to all prior pay reports published. Watch for an announcement via email concerning the next WEBCAST.
PICTURED: The Nasdaq Composite Index posted a small gain and iyt is perched at its 2014 high.
|
 Kenneth J. Gruneisen started out as a licensed stockbroker in August 1987, a couple of months prior to the historic stock market crash that took the Dow Jones Industrial Average down -22.6% in a single day. He has published daily fact-based fundamental and technical analysis on high-ranked stocks online for two decades. Through FACTBASEDINVESTING.COM, Kenneth provides educational articles, news, market commentary, and other information regarding proven investment systems that work in good times and bad.
Comments contained in the body of this report are technical opinions only and are not necessarily those of Gruneisen Growth Corp. The material herein has been obtained from sources believed to be reliable and accurate, however, its accuracy and completeness cannot be guaranteed. Our firm, employees, and customers may effect transactions, including transactions contrary to any recommendation herein, or have positions in the securities mentioned herein or options with respect thereto. Any recommendation contained in this report may not be suitable for all investors and it is not to be deemed an offer or solicitation on our part with respect to the purchase or sale of any securities. |
|
 |
Retail and Tech Gains Offset Other Weakness
Kenneth J. Gruneisen - Passed the CAN SLIM® Master's Exam
The Retail Index ($RLX +1.41%) helped underpin the major averages with a solid gain. Financial shares were mixed as the Broker/Dealer Index ($XBD -0.11%) edged lower and the Bank Index ($BKX +0.29%) posted a modest gain. Commodity-linked groups had a slightly negative bias as the Gold & Silver Index ($XAU -1.33%) oupaced the Integrated Oil Index ($XOI -0.71%) and the Oil Services Index ($OSX -0.58%) to the downside. The Networking Index ($NWX +0.58%) and the Semiconductor Index ($SOX +0.67%) posted small gains while the Biotechnology Index ($BTK -1.79%) backpedaled from a large gain on the prior session.
Charts courtesy www.stockcharts.com
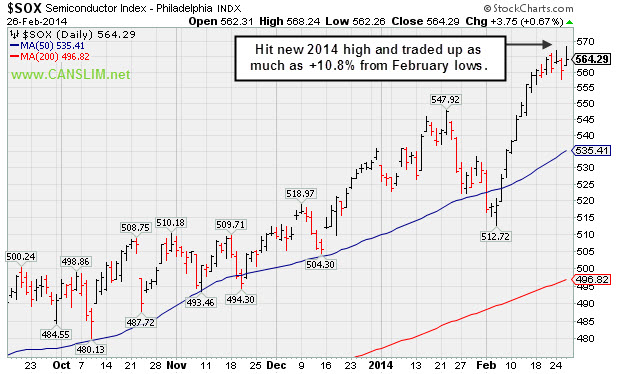
PICTURED: The Semiconductor Index ($SOX +0.67%) hit a new 2014 high while on the session it traded up as much as +10.8% from its February lows.
| Oil Services |
$OSX |
275.59 |
-1.60 |
-0.58% |
-1.94% |
| Integrated Oil |
$XOI |
1,472.43 |
-10.48 |
-0.71% |
-2.04% |
| Semiconductor |
$SOX |
564.29 |
+3.75 |
+0.67% |
+5.47% |
| Networking |
$NWX |
346.71 |
+2.02 |
+0.58% |
+7.03% |
| Broker/Dealer |
$XBD |
158.42 |
-0.18 |
-0.11% |
-1.33% |
| Retail |
$RLX |
933.16 |
+12.97 |
+1.41% |
-0.71% |
| Gold & Silver |
$XAU |
100.25 |
-1.35 |
-1.33% |
+19.13% |
| Bank |
$BKX |
68.48 |
+0.20 |
+0.29% |
-1.13% |
| Biotech |
$BTK |
2,893.43 |
-52.80 |
-1.79% |
+24.16% |
|
|
|
 |
Prior Highs Define Initial Support Following Recent Breakout
Kenneth J. Gruneisen - Passed the CAN SLIM® Master's Exam
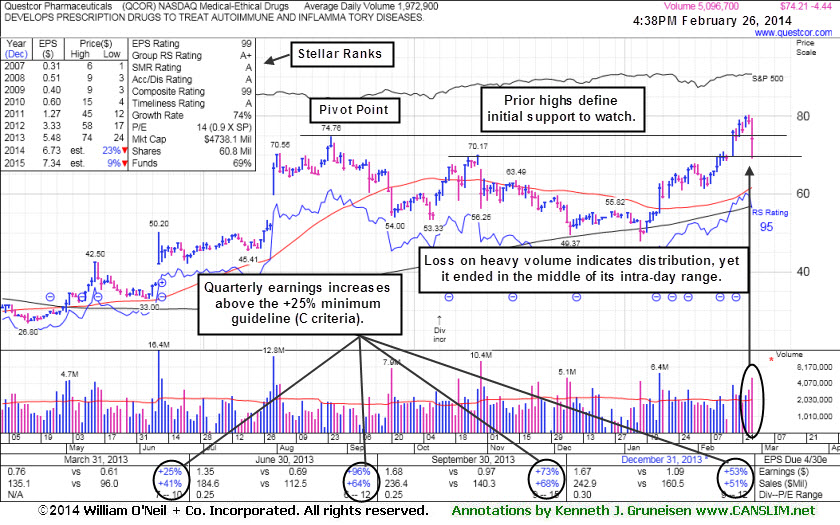
Questcor Pharmaceuticals (QCOR -$4.44 or -5.65% to $74.21) ended in the middle of its intra-day range today, down with higher volume and above average volume, a worrisome sign of distributional pressure. Its finish well above the session lows was a sign it was attracting prompt support. The stock was highlighted in yellow with pivot point cited based on its 8/16/13 high plus 10 cents in the earlier mid-day report (read here) while noted - "Technically, it broke out with a volume-driven gain on 2/18/14 triggering a technical buy signal."
The high ranked leader hails from the Medical - Ethical Drugs group which has an A+ rating, and leadership in the group is an encouraging sign concerning the L criteria. It Reported earnings +53% on +51% sales revenues for the Dec '13 quarter, continuing its streak of strong quarterly earnings increases satisfying the C criteria of the fact-based system. Considering its deep consolidation to its 200-day moving average (DMA) line, the latest technical breakout to new highs has the look of what could be the beginning of a substantial and sustained leg up.
Any slump leading to a close below its old high close ($72.34 on 8/26/13) would raise concerns by completely negating the latest breakout. Prior highs in the $74 area and $70 area define initial support levels to watch above other chart highs and above its 50 DMA line (now $61.63). Disciplined investors sell if any stock falls more than -7% from their purchase price per the fact-based investment system's sell rules.
It found support at its 200-day moving average (DMA) line then rebounded from a deep slump since dropped from the Featured Stocks list on 9/20/13 due to technical deterioration after members were cautioned - "A breach of the prior low ($60.31 on 9/11/13) may trigger a more worrisome technical sell signal." Prior to that it was last shown in this FSU section on 8/26/13 with annotated graphs under the headline, "Wedging to New Highs Despite Market's Negative Drag".
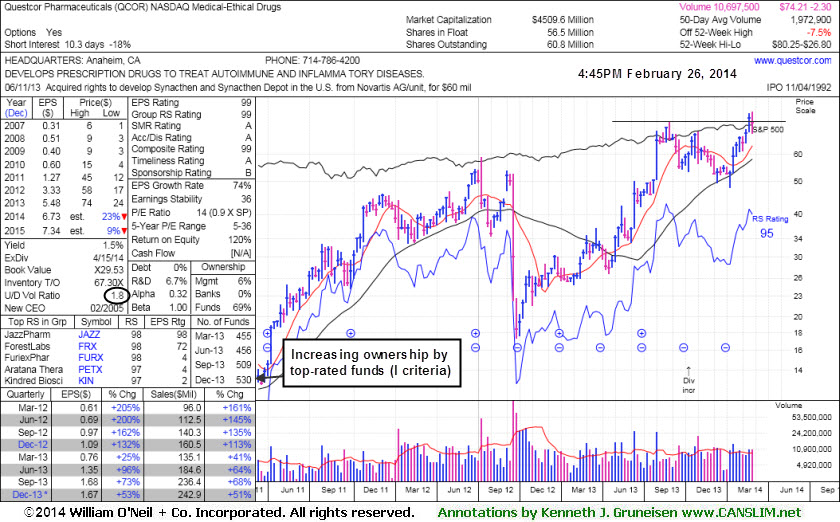
Since a FY '09 downturn its annual earnings (A criteria) growth has been strong. The small supply (S criteria) of 60.8 million shares outstanding can contribute to greater price volatility in the event of institutional buying or selling. The number of top-rated funds owning its shares rose from 455 in Mar '13 to 530 in Dec '13, a reassuring sign concerning the I criteria.
|
|
|
Color Codes Explained :
Y - Better candidates highlighted by our
staff of experts.
G - Previously featured
in past reports as yellow but may no longer be buyable under the
guidelines.
***Last / Change / Volume data in this table is the closing quote data***
Symbol/Exchange
Company Name
Industry Group |
PRICE |
CHANGE
(%Change) |
Day High |
Volume
(% DAV)
(% 50 day avg vol) |
52 Wk Hi
% From Hi |
Featured
Date |
Price
Featured |
Pivot Featured |
|
Max Buy |
EQM
-
NYSE
E Q T Midstream Partners
ENERGY - Oil and Gas Pipelines
|
$65.95
|
+0.69
1.06% |
$66.16
|
58,586
49.65% of 50 DAV
50 DAV is 118,000
|
$67.80
-2.73%
|
12/12/2013
|
$53.17
|
PP = $56.51
|
|
MB = $59.34
|
 Most Recent Note - 2/26/2014 6:19:41 PM
G - Posted a gain today with lighter volume. Recently enduring distributional pressure. Reported earnings -2% on +22% sales revenues for the Dec '13 quarter, below the +25% minimum earnings guideline (C criteria), raising fundamental concerns. Its 50 DMA line defines near-term support where a violation may trigger a technical sell signal.
>>> FEATURED STOCK ARTICLE : Leader Still Extended From Any Sound Base - 2/7/2014
View all notes |
Set NEW NOTE alert |
CANSLIM.net Company Profile |
SEC
News |
Chart |
Request a new note
C
A N
S L
I M


|
FB
-
NASDAQ
Facebook Inc Cl A
INTERNET
|
$69.26
|
-0.59
-0.84% |
$71.22
|
55,322,845
82.06% of 50 DAV
50 DAV is 67,421,000
|
$71.44
-3.05%
|
12/12/2013
|
$51.40
|
PP = $54.93
|
|
MB = $57.68
|
Most Recent Note - 2/25/2014 7:49:45 PM
G - Pulled back on light volume today after recent gains on higher volume for new all-time highs. Extended from any sound base and well beyond the "secondary buy point" previously noted. Prior highs and its 50 DMA line coincide near $58 defining very important near-term support to watch on pullbacks. See the latest FSU analysis for more details and new annotated graphs.
>>> FEATURED STOCK ARTICLE : High-Ranked Internet Group Leader is Extended From Base - 2/25/2014
View all notes |
Set NEW NOTE alert |
CANSLIM.net Company Profile |
SEC
News |
Chart |
Request a new note
C
A N
S L
I M
|
GNRC
-
NYSE
Generac Hldgs Inc
Electrical-Power/Equipmt
|
$57.63
|
+1.63
2.91% |
$58.08
|
841,949
90.43% of 50 DAV
50 DAV is 931,000
|
$57.68
-0.09%
|
2/14/2014
|
$56.50
|
PP = $57.39
|
|
MB = $60.26
|
Most Recent Note - 2/26/2014 3:10:55 PM
Y - Hit a new 52-week high and traded above its pivot point today while volume has been running at a below average pace. Recently encountering resistance near prior highs in the $57 area. Volume should be at least +40% above average as a stock rallies above its pivot point to trigger a proper technical buy signal.
>>> FEATURED STOCK ARTICLE : Following Island Reversal Prior Highs May Act as Resistance - 2/14/2014
View all notes |
Set NEW NOTE alert |
CANSLIM.net Company Profile |
SEC
News |
Chart |
Request a new note
C
A N
S L
I M
|
JAZZ
-
NASDAQ
Jazz Pharmaceuticals Plc
DRUGS - Biotechnology
|
$162.06
|
-12.92
-7.38% |
$169.80
|
3,561,967
371.04% of 50 DAV
50 DAV is 960,000
|
$176.60
-8.23%
|
9/30/2013
|
$93.20
|
PP = $89.10
|
|
MB = $93.56
|
Most Recent Note - 2/26/2014 1:01:41 PM
G - Gapped down today retreating from its all-time high. It is very extended from any sound base. Reported earnings +12% on +28% sales revenues for the Dec '13 quarter, below the +25% minimum earnings guideline (C criteria), raising fundamental concerns. Its 50 DMA line ($144) and recent lows in the $135 area define important support to watch on pullbacks where violation s may trigger technical sell signals.
>>> FEATURED STOCK ARTICLE : Financial Report May Prompt Greater Volume and Volatility - 2/21/2014
View all notes |
Set NEW NOTE alert |
CANSLIM.net Company Profile |
SEC
News |
Chart |
Request a new note
C
A N
S L
I M
|
KORS
-
NYSE
Michael Kors Hldgs Ltd
RETAIL - Apparel Stores
|
$99.32
|
-0.52
-0.52% |
$100.60
|
1,773,002
43.63% of 50 DAV
50 DAV is 4,064,000
|
$101.04
-1.70%
|
2/4/2014
|
$90.92
|
PP = $84.68
|
|
MB = $88.91
|
Most Recent Note - 2/26/2014 3:06:59 PM
G - Perched at its 52-week high after still wedging higher with recent gains lacking great volume conviction, getting very extended from its prior base. Prior highs in the $84 area define the nearest chart support level.
>>> FEATURED STOCK ARTICLE : Extended From Sound Base and Wedging Higher - 2/19/2014
View all notes |
Set NEW NOTE alert |
CANSLIM.net Company Profile |
SEC
News |
Chart |
Request a new note
C
A N
S L
I M
|
Symbol/Exchange
Company Name
Industry Group |
PRICE |
CHANGE
(%Change) |
Day High |
Volume
(% DAV)
(% 50 day avg vol) |
52 Wk Hi
% From Hi |
Featured
Date |
Price
Featured |
Pivot Featured |
|
Max Buy |
LEAF
-
NYSE
Springleaf Holdings Inc
Finance-Consumer Loans
|
$27.49
|
-1.07
-3.75% |
$29.42
|
527,314
156.47% of 50 DAV
50 DAV is 337,000
|
$29.50
-6.81%
|
2/24/2014
|
$28.60
|
PP = $27.44
|
|
MB = $28.81
|
Most Recent Note - 2/26/2014 6:17:51 PM
Y - Finished at the session low today with a loss on above average volume. Heavier volume was behind prior considerable gains as it broke out when highlighted in yellow in the 2/24/14 mid-day report with an annotated daily graph (read here). Prior highs define initial support to watch. Other leadership (L criteria) in the group is reassuring, however the industry group has a D+ rating. A subsequent close below its prior high close ($27.17 on 1/08/14) would raise concerns. Disciplined investors avoid chasing extended stocks more than +5% above prior highs and always limit losses by selling any stock that falls more than -7% from their purchase price. See the new annotated graph below this note.

>>> FEATURED STOCK ARTICLE : Breakout Backed by Four Times Average Volume - 2/24/2014
View all notes |
Set NEW NOTE alert |
CANSLIM.net Company Profile |
SEC
News |
Chart |
Request a new note
C
A N
S L
I M
|
PCLN
-
NASDAQ
Priceline.com Inc
INTERNET - Internet Software and Services
|
$1,356.94
|
+3.45
0.25% |
$1,375.41
|
1,097,010
147.65% of 50 DAV
50 DAV is 743,000
|
$1,357.16
-0.02%
|
12/18/2013
|
$1,156.20
|
PP = $1,198.85
|
|
MB = $1,258.79
|
Most Recent Note - 2/25/2014 12:22:28 PM
G - Hitting yet another new 52-week high today, adding to an impressive streak of gains marked by above average volume. Rallying with no resistance due to overhead supply, getting more extended from any sound base.
>>> FEATURED STOCK ARTICLE : Extended From Prior Highs After 6th Straight Gain - 2/13/2014
View all notes |
Set NEW NOTE alert |
CANSLIM.net Company Profile |
SEC
News |
Chart |
Request a new note
C
A N
S L
I M
|
QCOR
-
NASDAQ
Questcor Pharmaceuticals
DRUGS - Biotechnology
|
$74.21
|
-4.44
-5.65% |
$79.43
|
5,097,333
258.49% of 50 DAV
50 DAV is 1,972,000
|
$80.25
-7.53%
|
2/26/2014
|
$76.30
|
PP = $74.86
|
|
MB = $78.60
|
Most Recent Note - 2/26/2014 5:55:57 PM
Y - Pulled back on higher volume for a 2nd consecutive loss, slumping toward prior highs which define initial support to watch. Color code was changed to yellow with pivot point cited based on its 8/16/13 high plus 10 cents in the earlier mid-day report (read here). Technically, it broke out with a volume-driven gain on 2/18/14 triggering a technical buy signal. See the latest FSU analysis for more details and new annotated graphs
>>> FEATURED STOCK ARTICLE : Prior Highs Define Initial Support Following Recent Breakout - 2/26/2014
View all notes |
Set NEW NOTE alert |
CANSLIM.net Company Profile |
SEC
News |
Chart |
Request a new note
C
A N
S L
I M
|
SILC
-
NASDAQ
Silicom Ltd
COMPUTER HARDWARE - Networking andamp; Communication Dev
|
$70.36
|
+1.60
2.33% |
$71.49
|
119,866
168.83% of 50 DAV
50 DAV is 71,000
|
$69.03
1.93%
|
12/23/2013
|
$44.62
|
PP = $46.25
|
|
MB = $48.56
|
Most Recent Note - 2/25/2014 7:46:10 PM
G - Wedging higher with small gains on near-average volume while inching into new high territory. Extended from any sound base and on track for an 11th consecutive weekly gain. Disciplined investors avoid chasing extended stocks.
>>> FEATURED STOCK ARTICLE : Stubbornly Held Ground Following Breakaway Gap - 2/11/2014
View all notes |
Set NEW NOTE alert |
CANSLIM.net Company Profile |
SEC
News |
Chart |
Request a new note
C
A N
S L
I M
|
ULTI
-
NASDAQ
Ultimate Software Group
INTERNET - Internet Software and Services
|
$168.56
|
-0.62
-0.37% |
$170.78
|
134,953
65.51% of 50 DAV
50 DAV is 206,000
|
$171.96
-1.98%
|
1/27/2014
|
$153.75
|
PP = $162.98
|
|
MB = $171.13
|
Most Recent Note - 2/26/2014 3:13:08 PM
Y - Perched near its all-time high stubbornly holding its ground after recently wedging higher with gains lacking great volume conviction. Still trading below its "max buy" level. Found support above its 50 DMA line following a worrisome "negative reversal" on 2/05/14.
>>> FEATURED STOCK ARTICLE : Stalled and Encountering Distributional Pressure - 2/12/2014
View all notes |
Set NEW NOTE alert |
CANSLIM.net Company Profile |
SEC
News |
Chart |
Request a new note
C
A N
S L
I M
|
Symbol/Exchange
Company Name
Industry Group |
PRICE |
CHANGE
(%Change) |
Day High |
Volume
(% DAV)
(% 50 day avg vol) |
52 Wk Hi
% From Hi |
Featured
Date |
Price
Featured |
Pivot Featured |
|
Max Buy |
VRX
-
NYSE
Valeant Pharmaceuticals
DRUGS - Drug Manufacturers - Other
|
$146.34
|
+1.28
0.88% |
$150.17
|
2,904,784
205.87% of 50 DAV
50 DAV is 1,411,000
|
$148.73
-1.61%
|
9/11/2013
|
$100.26
|
PP = $105.50
|
|
MB = $110.78
|
Most Recent Note - 2/26/2014 1:30:47 PM
G - Due to report Dec '13 quarterly results on Thursday. Hitting new all-time highs again today, getting very extended from any sound base. Its 50 DMA line and recent lows coincide near $130 defining important near-term support to watch.
>>> FEATURED STOCK ARTICLE : Hovering Near All-Time Highs Extended From Sound Base - 2/10/2014
View all notes |
Set NEW NOTE alert |
CANSLIM.net Company Profile |
SEC
News |
Chart |
Request a new note
C
A N
S L
I M
|
|
|
|
THESE ARE NOT BUY RECOMMENDATIONS!
Comments contained in the body of this report are technical
opinions only. The material herein has been obtained
from sources believed to be reliable and accurate, however,
its accuracy and completeness cannot be guaranteed.
This site is not an investment advisor, hence it does
not endorse or recommend any securities or other investments.
Any recommendation contained in this report may not
be suitable for all investors and it is not to be deemed
an offer or solicitation on our part with respect to
the purchase or sale of any securities. All trademarks,
service marks and trade names appearing in this report
are the property of their respective owners, and are
likewise used for identification purposes only.
This report is a service available
only to active Paid Premium Members.
You may opt-out of receiving report notifications
at any time. Questions or comments may be submitted
by writing to Premium Membership Services 665 S.E. 10 Street, Suite 201 Deerfield Beach, FL 33441-5634 or by calling 1-800-965-8307
or 954-785-1121.
|
|
|

