You are not logged in.
This means you
CAN ONLY VIEW reports that were published prior to Saturday, March 8, 2025.
You
MUST UPGRADE YOUR MEMBERSHIP if you want to see any current reports.
AFTER MARKET UPDATE - TUESDAY, FEBRUARY 25TH, 2014
Previous After Market Report Next After Market Report >>>
|
|
|
|
DOW |
-27.48 |
16,179.66 |
-0.17% |
|
Volume |
633,291,140 |
-24% |
|
Volume |
1,982,148,420 |
-1% |
|
NASDAQ |
-5.38 |
4,287.59 |
-0.13% |
|
Advancers |
1,381 |
44% |
|
Advancers |
1,024 |
38% |
|
S&P 500 |
-2.49 |
1,845.12 |
-0.13% |
|
Decliners |
1,636 |
52% |
|
Decliners |
1,556 |
58% |
|
Russell 2000 |
-0.61 |
1,173.95 |
-0.05% |
|
52 Wk Highs |
134 |
|
|
52 Wk Highs |
147 |
|
|
S&P 600 |
-0.85 |
659.71 |
-0.13% |
|
52 Wk Lows |
19 |
|
|
52 Wk Lows |
20 |
|
|
 |
Major Averages Fell on Lighter Volume Totals
Kenneth J. Gruneisen - Passed the CAN SLIM® Master's Exam
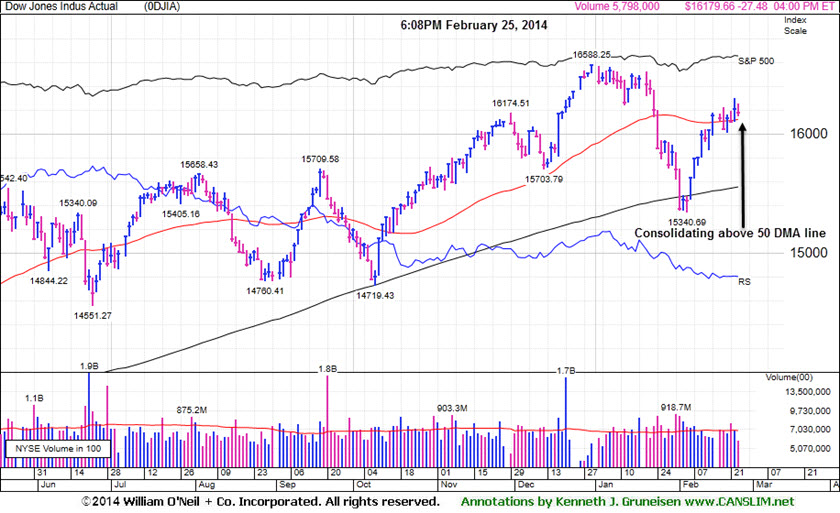
The major averages ended with small losses on Tuesday. The volume totals were reported lighter than the prior trading session's volume totals on the Nasdaq exchange and on the NYSE, a reassuring sign that the institutional crowd was going easy with their selling efforts. Breadth was slightly negative as advancers trailed decliners by an 8-7 ratio on the NYSE and 3-2 on the Nasdaq exchange. There were 69 high-ranked companies from the CANSLIM.net Leaders List that made new 52-week highs and appeared on the CANSLIM.net BreakOuts Page, down from the total of 91 stocks on the prior session. The list of stocks hitting new 52-week highs contracted yet still easily outnumbered new 52-week lows on the Nasdaq exchange and on the NYSE. There were gains for 7 of the 11 high-ranked companies currently included on the Featured Stocks Page. The Market (M criteria) environment has been noted as a "Confirmed Uptrend". For any rally to be sustained it is critical for there to be healthy leadership, so it remains crucial for many stocks to continue hitting new 52-week highs.
The retailer group and biotech group gains offset broader market weakness. Home Depot (HD +4%) shares rallied after its same-store sales increased +4.4% overall in the fourth quarter, but the company warned full-year same store sales will come in below analysts' estimates. Macy's (M +6%) shares rose after the company said profits rose +11% in the fourth quarter on strong holiday sales. Tesla (TSLA +13.94%) soared after Consumer Reports rated the company's Model S sedan as the best overall vehicle in its annual top ten list, and Morgan Stanley (MS -1.98%) also raised its target price.
The CANSLIM.net Featured Stocks Page shows the most action-worthy candidates and their latest notes and a Headline Link directs members to the latest detailed analysis with data-packed graphs annotated by a Certified expert along with links to additional resources. The Premium Member Homepage includes "dynamic archives" to all prior pay reports published. Watch for an announcement via email concerning the next WEBCAST.
PICTURED: The Dow Jones Industrial Average is consolidating above its 50-day moving average (DMA) line.
|
 Kenneth J. Gruneisen started out as a licensed stockbroker in August 1987, a couple of months prior to the historic stock market crash that took the Dow Jones Industrial Average down -22.6% in a single day. He has published daily fact-based fundamental and technical analysis on high-ranked stocks online for two decades. Through FACTBASEDINVESTING.COM, Kenneth provides educational articles, news, market commentary, and other information regarding proven investment systems that work in good times and bad.
Comments contained in the body of this report are technical opinions only and are not necessarily those of Gruneisen Growth Corp. The material herein has been obtained from sources believed to be reliable and accurate, however, its accuracy and completeness cannot be guaranteed. Our firm, employees, and customers may effect transactions, including transactions contrary to any recommendation herein, or have positions in the securities mentioned herein or options with respect thereto. Any recommendation contained in this report may not be suitable for all investors and it is not to be deemed an offer or solicitation on our part with respect to the purchase or sale of any securities. |
|
 |
Biotech Index Blasted Higher and Retail Group Rose
Kenneth J. Gruneisen - Passed the CAN SLIM® Master's Exam
The Retail Index ($RLX +1.94%) posted a solid gain while the Broker/Dealer Index ($XBD -1.08%) and the Bank Index ($BKX -0.63%) both lost ground and financial shares were a negative influence on the major averages on Tuesday. Commodity-linked groups also weighed on the major averages with losses as the Gold & Silver Index ($XAU -1.58%) outpaced the Oil Services Index ($OSX -0.73%) to the downside and the Integrated Oil Index ($XOI +0.18%) eked out a small gain. The tech sector saw losses for the Networking Index ($NWX -0.71%) and the Semiconductor Index ($SOX -0.50%)
Charts courtesy www.stockcharts.com
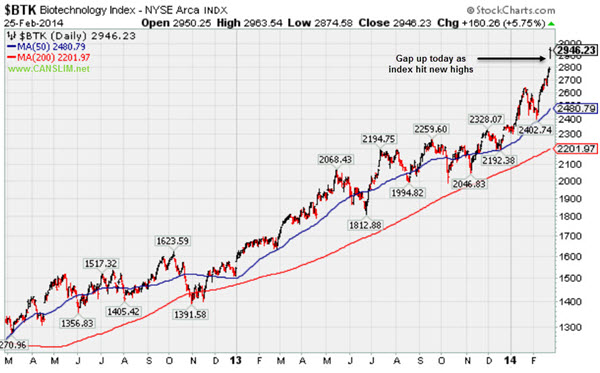
PICTURED: The Biotechnology Index ($BTK +5.75%) gapped up and rallied to new highs.
| Oil Services |
$OSX |
277.19 |
-2.05 |
-0.73% |
-1.37% |
| Integrated Oil |
$XOI |
1,482.92 |
+2.69 |
+0.18% |
-1.35% |
| Semiconductor |
$SOX |
560.54 |
-2.83 |
-0.50% |
+4.77% |
| Networking |
$NWX |
344.69 |
-2.46 |
-0.71% |
+6.41% |
| Broker/Dealer |
$XBD |
158.61 |
-1.73 |
-1.08% |
-1.22% |
| Retail |
$RLX |
920.19 |
+17.53 |
+1.94% |
-2.09% |
| Gold & Silver |
$XAU |
101.60 |
-1.63 |
-1.58% |
+20.74% |
| Bank |
$BKX |
68.28 |
-0.43 |
-0.63% |
-1.41% |
| Biotech |
$BTK |
2,946.23 |
+160.26 |
+5.75% |
+26.42% |
|
|
|
 |
High-Ranked Internet Group Leader is Extended From Base
Kenneth J. Gruneisen - Passed the CAN SLIM® Master's Exam
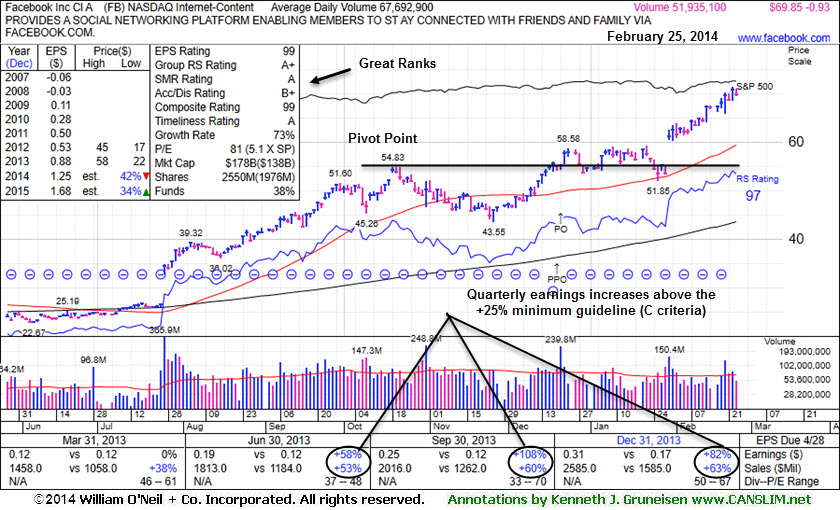
Facebook Inc (FB -$0.93 or -1.31% to $69.85) is perched at its all-time high, very extended from any sound base and well beyond the "secondary buy point" previously noted. Prior highs and its 50-day moving average (DMA) line coincide near $58 defining very important near-term support to watch on pullbacks. Disciplined investors avoid chasing extended stocks.
Since FB was last shown in this FSU section on 2/06/14 with annotated graphs under the headline, "Volume Totals Cooling While Holding Ground at Highs", additional volume-driven gains lifted it to new all-time highs. It reported earnings +82% on +63% sales revenues for the Dec '13 quarter, marking its 3rd quarterly comparison with earnings above the +25% minimum (C criteria). Sequential acceleration in quarterly sales and strong earnings increases helps it look like a better match with the fact-based investment system's winning models.
The high-ranked Internet - Content group leader found support at its 50-day moving average (DMA) line during its latest consolidation. It rallied from a 9-week cup shaped base without a handle after completing a Public Offering on 12/20/13. The 12/12/13 mid-day report (read here) first highlighted the stock in yellow with a pivot point cited based on its 10/18/13 high plus 10 cents.
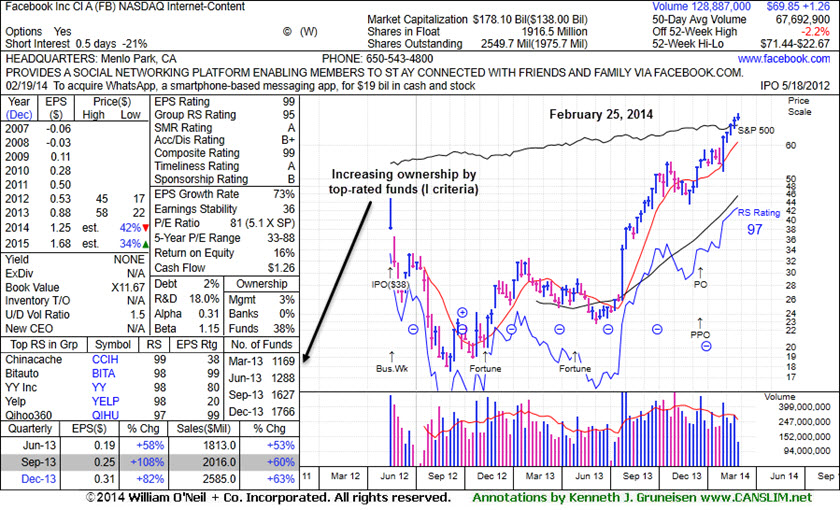
The number of top-rated funds owning its shares rose from 1,116 in Dec '12 to 1,766 in Dec '13, a reassuring sign concerning the I criteria. Keep in mind that its large supply of 2.54 billion shares in the public float makes it an unlikely sprinter, especially as it is already well known by the institutional crowd and the general public.
|
|
|
Color Codes Explained :
Y - Better candidates highlighted by our
staff of experts.
G - Previously featured
in past reports as yellow but may no longer be buyable under the
guidelines.
***Last / Change / Volume data in this table is the closing quote data***
Symbol/Exchange
Company Name
Industry Group |
PRICE |
CHANGE
(%Change) |
Day High |
Volume
(% DAV)
(% 50 day avg vol) |
52 Wk Hi
% From Hi |
Featured
Date |
Price
Featured |
Pivot Featured |
|
Max Buy |
EQM
-
NYSE
E Q T Midstream Partners
ENERGY - Oil and Gas Pipelines
|
$65.26
|
-0.76
-1.15% |
$66.25
|
72,893
61.77% of 50 DAV
50 DAV is 118,000
|
$67.80
-3.75%
|
12/12/2013
|
$53.17
|
PP = $56.51
|
|
MB = $59.34
|
Most Recent Note - 2/21/2014 12:25:22 PM
G - Enduring distributional pressure after recently reporting earnings -2% on +22% sales revenues for the Dec '13 quarter, below the +25% minimum earnings guideline (C criteria), raising fundamental concerns. Its 50 DMA line defines near-term support.
>>> FEATURED STOCK ARTICLE : Leader Still Extended From Any Sound Base - 2/7/2014
View all notes |
Set NEW NOTE alert |
CANSLIM.net Company Profile |
SEC
News |
Chart |
Request a new note
C
A N
S L
I M


|
FB
-
NASDAQ
Facebook Inc Cl A
INTERNET
|
$69.85
|
-0.93
-1.31% |
$71.00
|
52,141,627
77.03% of 50 DAV
50 DAV is 67,692,000
|
$71.44
-2.23%
|
12/12/2013
|
$51.40
|
PP = $54.93
|
|
MB = $57.68
|
 Most Recent Note - 2/25/2014 7:49:45 PM
G - Pulled back on light volume today after recent gains on higher volume for new all-time highs. Extended from any sound base and well beyond the "secondary buy point" previously noted. Prior highs and its 50 DMA line coincide near $58 defining very important near-term support to watch on pullbacks. See the latest FSU analysis for more details and new annotated graphs.
>>> FEATURED STOCK ARTICLE : High-Ranked Internet Group Leader is Extended From Base - 2/25/2014
View all notes |
Set NEW NOTE alert |
CANSLIM.net Company Profile |
SEC
News |
Chart |
Request a new note
C
A N
S L
I M
|
GNRC
-
NYSE
Generac Hldgs Inc
Electrical-Power/Equipmt
|
$56.00
|
+0.64
1.16% |
$56.00
|
632,658
68.25% of 50 DAV
50 DAV is 927,000
|
$57.68
-2.91%
|
2/14/2014
|
$56.50
|
PP = $57.39
|
|
MB = $60.26
|
Most Recent Note - 2/20/2014 1:05:49 PM
Y - Encountering resistance near prior highs in the $57 area since highlighted in yellow in the 2/14/14 mid-day report (read here) with a new pivot point based on its 1/06/14 high plus 10 cents. Volume-driven gains into new high territory are needed to confirm a new technical buy signal. See the latest FSU analysis for more details and new annotated graphs.
>>> FEATURED STOCK ARTICLE : Following Island Reversal Prior Highs May Act as Resistance - 2/14/2014
View all notes |
Set NEW NOTE alert |
CANSLIM.net Company Profile |
SEC
News |
Chart |
Request a new note
C
A N
S L
I M
|
JAZZ
-
NASDAQ
Jazz Pharmaceuticals Plc
DRUGS - Biotechnology
|
$174.98
|
+3.23
1.88% |
$176.60
|
1,696,191
179.68% of 50 DAV
50 DAV is 944,000
|
$176.39
-0.80%
|
9/30/2013
|
$93.20
|
PP = $89.10
|
|
MB = $93.56
|
Most Recent Note - 2/21/2014 5:43:21 PM
G - Perched near all-time highs, very extended from any sound base. Its 50 DMA line and recent lows in the $135 area define important support to watch on pullbacks. Earnings news is due on 2/25/14. See the latest FSU analysis for more details and new annotated graphs.
>>> FEATURED STOCK ARTICLE : Financial Report May Prompt Greater Volume and Volatility - 2/21/2014
View all notes |
Set NEW NOTE alert |
CANSLIM.net Company Profile |
SEC
News |
Chart |
Request a new note
C
A N
S L
I M
|
KORS
-
NYSE
Michael Kors Hldgs Ltd
RETAIL - Apparel Stores
|
$99.84
|
+1.26
1.28% |
$101.04
|
2,490,760
61.41% of 50 DAV
50 DAV is 4,056,000
|
$99.74
0.10%
|
2/4/2014
|
$90.92
|
PP = $84.68
|
|
MB = $88.91
|
Most Recent Note - 2/19/2014 6:09:44 PM
G - Perched at its 52-week high after wedging higher, very extended from its prior base. Prior highs in the $84 area define the nearest chart support level. See the latest FSU analysis for more details and new annotated graphs.
>>> FEATURED STOCK ARTICLE : Extended From Sound Base and Wedging Higher - 2/19/2014
View all notes |
Set NEW NOTE alert |
CANSLIM.net Company Profile |
SEC
News |
Chart |
Request a new note
C
A N
S L
I M
|
Symbol/Exchange
Company Name
Industry Group |
PRICE |
CHANGE
(%Change) |
Day High |
Volume
(% DAV)
(% 50 day avg vol) |
52 Wk Hi
% From Hi |
Featured
Date |
Price
Featured |
Pivot Featured |
|
Max Buy |
LEAF
-
NYSE
Springleaf Holdings Inc
Finance-Consumer Loans
|
$28.56
|
+0.20
0.71% |
$29.50
|
598,298
179.13% of 50 DAV
50 DAV is 334,000
|
$28.91
-1.21%
|
2/24/2014
|
$28.60
|
PP = $27.44
|
|
MB = $28.81
|
Most Recent Note - 2/24/2014 6:03:19 PM
Y - Gapped up and hit a new 52-week high and was highlighted in yellow with pivot point cited based on its 1/09/14 high plus 10 cents in the earlier mid-day report (read here). Solid gain above its pivot point backed by 4 times average volume clinched a convincing technical buy signal. Earnings increases have been above the +25% minimum guideline (C criteria) in the 3 latest quarterly comparisons through Sep '13. See the latest FSU analysis for more details and a new annotated weekly graph.

>>> FEATURED STOCK ARTICLE : Breakout Backed by Four Times Average Volume - 2/24/2014
View all notes |
Set NEW NOTE alert |
CANSLIM.net Company Profile |
SEC
News |
Chart |
Request a new note
C
A N
S L
I M
|
PCLN
-
NASDAQ
Priceline.com Inc
INTERNET - Internet Software and Services
|
$1,353.49
|
+39.82
3.03% |
$1,357.16
|
1,216,172
166.37% of 50 DAV
50 DAV is 731,000
|
$1,333.12
1.53%
|
12/18/2013
|
$1,156.20
|
PP = $1,198.85
|
|
MB = $1,258.79
|
Most Recent Note - 2/25/2014 12:22:28 PM
G - Hitting yet another new 52-week high today, adding to an impressive streak of gains marked by above average volume. Rallying with no resistance due to overhead supply, getting more extended from any sound base.
>>> FEATURED STOCK ARTICLE : Extended From Prior Highs After 6th Straight Gain - 2/13/2014
View all notes |
Set NEW NOTE alert |
CANSLIM.net Company Profile |
SEC
News |
Chart |
Request a new note
C
A N
S L
I M
|
SILC
-
NASDAQ
Silicom Ltd
COMPUTER HARDWARE - Networking andamp; Communication Dev
|
$68.76
|
+0.32
0.47% |
$68.89
|
66,234
93.29% of 50 DAV
50 DAV is 71,000
|
$69.03
-0.39%
|
12/23/2013
|
$44.62
|
PP = $46.25
|
|
MB = $48.56
|
Most Recent Note - 2/25/2014 7:46:10 PM
G - Wedging higher with small gains on near-average volume while inching into new high territory. Extended from any sound base and on track for an 11th consecutive weekly gain. Disciplined investors avoid chasing extended stocks.
>>> FEATURED STOCK ARTICLE : Stubbornly Held Ground Following Breakaway Gap - 2/11/2014
View all notes |
Set NEW NOTE alert |
CANSLIM.net Company Profile |
SEC
News |
Chart |
Request a new note
C
A N
S L
I M
|
ULTI
-
NASDAQ
Ultimate Software Group
INTERNET - Internet Software and Services
|
$169.18
|
-1.61
-0.94% |
$171.96
|
119,335
57.65% of 50 DAV
50 DAV is 207,000
|
$171.74
-1.49%
|
1/27/2014
|
$153.75
|
PP = $162.98
|
|
MB = $171.13
|
Most Recent Note - 2/20/2014 1:02:38 PM
Y - Recently wedging higher with gains lacking great volume conviction, now perched above its pivot point and below its "max buy" level. Found support above its 50 DMA line following a worrisome "negative reversal" on 2/05/14. Fundamentals remain strong after solid Dec '13 earnings.
>>> FEATURED STOCK ARTICLE : Stalled and Encountering Distributional Pressure - 2/12/2014
View all notes |
Set NEW NOTE alert |
CANSLIM.net Company Profile |
SEC
News |
Chart |
Request a new note
C
A N
S L
I M
|
VRX
-
NYSE
Valeant Pharmaceuticals
DRUGS - Drug Manufacturers - Other
|
$145.06
|
-0.67
-0.46% |
$146.64
|
1,570,391
111.77% of 50 DAV
50 DAV is 1,405,000
|
$148.73
-2.47%
|
9/11/2013
|
$100.26
|
PP = $105.50
|
|
MB = $110.78
|
Most Recent Note - 2/25/2014 7:42:59 PM
G - Hovering at all-time highs with today's 3rd consecutive small loss. Very extended from any sound base. Its 50 DMA line ($129.25) defines near-term support to watch.
>>> FEATURED STOCK ARTICLE : Hovering Near All-Time Highs Extended From Sound Base - 2/10/2014
View all notes |
Set NEW NOTE alert |
CANSLIM.net Company Profile |
SEC
News |
Chart |
Request a new note
C
A N
S L
I M
|
Symbol/Exchange
Company Name
Industry Group |
PRICE |
CHANGE
(%Change) |
Day High |
Volume
(% DAV)
(% 50 day avg vol) |
52 Wk Hi
% From Hi |
Featured
Date |
Price
Featured |
Pivot Featured |
|
Max Buy |
|
|
|
THESE ARE NOT BUY RECOMMENDATIONS!
Comments contained in the body of this report are technical
opinions only. The material herein has been obtained
from sources believed to be reliable and accurate, however,
its accuracy and completeness cannot be guaranteed.
This site is not an investment advisor, hence it does
not endorse or recommend any securities or other investments.
Any recommendation contained in this report may not
be suitable for all investors and it is not to be deemed
an offer or solicitation on our part with respect to
the purchase or sale of any securities. All trademarks,
service marks and trade names appearing in this report
are the property of their respective owners, and are
likewise used for identification purposes only.
This report is a service available
only to active Paid Premium Members.
You may opt-out of receiving report notifications
at any time. Questions or comments may be submitted
by writing to Premium Membership Services 665 S.E. 10 Street, Suite 201 Deerfield Beach, FL 33441-5634 or by calling 1-800-965-8307
or 954-785-1121.
|
|
|

