You are not logged in.
This means you
CAN ONLY VIEW reports that were published prior to Monday, April 14, 2025.
You
MUST UPGRADE YOUR MEMBERSHIP if you want to see any current reports.
AFTER MARKET UPDATE - THURSDAY, FEBRUARY 25TH, 2010
Previous After Market Report Next After Market Report >>>
|
|
|
|
DOW |
-53.13 |
10,321.03 |
-0.51% |
|
Volume |
1,144,943,880 |
+14% |
|
Volume |
2,334,201,430 |
+9% |
|
NASDAQ |
-1.68 |
2,234.22 |
-0.08% |
|
Advancers |
1,512 |
48% |
|
Advancers |
1,145 |
41% |
|
S&P 500 |
-2.30 |
1,102.94 |
-0.21% |
|
Decliners |
1,505 |
48% |
|
Decliners |
1,518 |
54% |
|
Russell 2000 |
+0.03 |
630.46 |
+0.00% |
|
52 Wk Highs |
114 |
|
|
52 Wk Highs |
73 |
|
|
S&P 600 |
-0.38 |
335.65 |
-0.11% |
|
52 Wk Lows |
9 |
|
|
52 Wk Lows |
14 |
|
|
 |
Leadership Elusive As Indices Endure Distributional Pressure
Adam Sarhan, Contributing Writer,
Stocks closed lower but up from their intra-day lows on Thursday. The US dollar pulled back and concerns eased over tepid economic data and the fate of the EU. Volume, a critical gauge of institutional demand, was higher than Wednesday's totals which suggested large institutions were selling stocks. Decliners narrowly led advancers on the NYSE and led by a 5-to-4 ratio on the Nasdaq exchange. New 52-week highs outnumbered new lows on both exchanges. There were 10 high-ranked companies from the CANSLIM.net Leaders List that made a new 52-week high and appeared on the CANSLIM.net BreakOuts Page, lower than the 14 issues that appeared on the prior session.
After a 7-week decline, the euro managed to positively reverse on higher volume than the prior session. If this nascent rally continues, it will bode well for dollar denominated assets- mainly stocks and commodities. The primary concern which sent the dollar soaring (euro plunging) in recent weeks was: the risk of default from Greece, Spain and Portugal. Fear spread after Moody’s Investors Service (MCO -0.59%) said it may downgrade Greek debt. In the US, stocks opened sharply lower after two disconcerting economic reports missed estimates. At 8:30AM EST, Labor Department said initial jobless claims rose by +22,000 to +496,000 in the week ended Feb. 20 which was the level in three months. In a separate report, the Commerce Department said US durable goods excluding transportation equipment slid by -0.6% in January. This was the largest decline since August and missed the Street's estimate for a +1% increase.
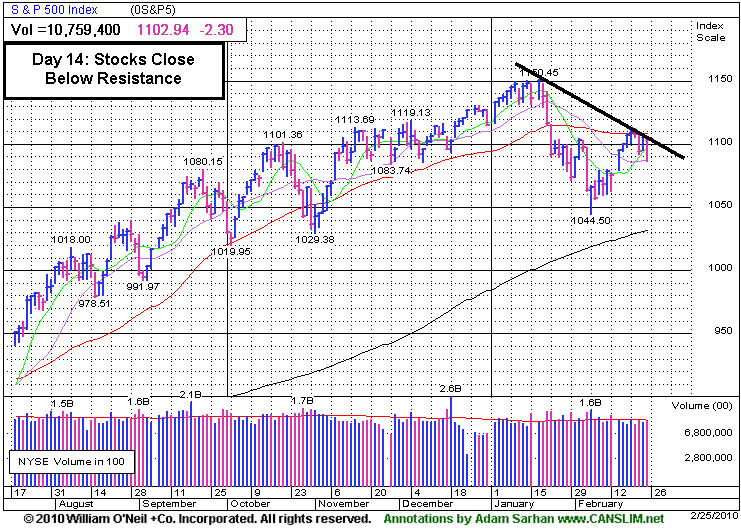
Looking at the market, Thursday marked Day 14 of a new rally attempt which means that as long as the February 5th lows are not breached the window remains open for a new follow-through day (FTD) to emerge. A new follow-through day will confirm the current rally attempt and will be produced when one of the major averages rallies at least +1.7% on higher volume than the prior session as a new batch of leaders break out of fresh bases. However, if the February 5, 2010 lows are breached then the day count will be reset and a steeper correction may unfold. So far, the market’s reaction has been tepid at best to the latest round of economic and earnings data which remains a concern. Remember that the market remains in a correction until a new new follow-through day emerges. Until then, patience is paramount.
Professional Money Management Services - A Winning System - Inquire today!
Our skilled team of portfolio managers knows how to follow the rules of this fact-based investment system. We do not follow opinion or the "conviction list" of some large Wall Street institution which would have us fully invested even during horrific bear markets. Instead, we remain fluid and only buy the best stocks when they are triggering proper technical buy signals. If you are not completely satisfied with the way your portfolio is being managed, Click here to get connected with one of our portfolio managers. *Accounts over $250,000 please. ** Serious inquires only, please.
PICTURED: The S&P 500 Index rebounded from intra-day lows to close with a small loss.
|
|
|
 |
Gold & Silver Index Rises To 200 Day Moving Average
Kenneth J. Gruneisen - Passed the CAN SLIM® Master's Exam
Financial shares lagged and created a drag on the major indices on Thursday as the Bank Index ($BKX -0.97%) and Broker/Dealer Index ($XBD -0.35%) fell. The tech sector also traded with a slightly negative bias as the Internet Index ($IIX -0.59%), Networking Index ($NWX -0.58%), and Semiconductor Index ($SOX -0.26%) ended with small losses. While the Integrated Oil Index ($XOI -0.69%) suffered a modest loss, the Oil Services Index ($OSX +0.08%) barely edged higher. The Healthcare Index ($HMO +0.02%) and Biotechnology Index ($BTK -0.03%) finished essentially flat, yet the Retail Index ($RLX +0.37%) posted a small gain.
Charts courtesy www.stockcharts.com
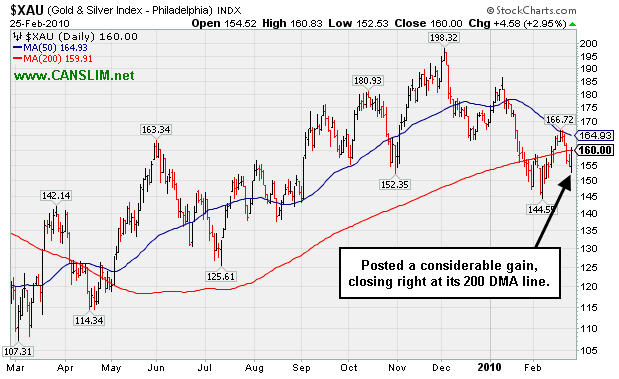
PICTURED: The Gold & Silver Index ($XAU +2.95%) posted a considerable gain and closed right at its 200-day moving average (DMA) line. Not long ago its 50 DMA acted as a resistance level, and now that short-term average appears to be falling toward its longer-term average line. Following the bullish crossover in April 2009 the XAU went on to produce great gains. A subsequent bearish crossover could be an ominous sign for fans of gold-related stocks.
| Oil Services |
$OSX |
200.57 |
+0.17 |
+0.08% |
+2.90% |
| Healthcare |
$HMO |
1,412.27 |
+0.25 |
+0.02% |
-4.12% |
| Integrated Oil |
$XOI |
1,017.94 |
-7.11 |
-0.69% |
-4.71% |
| Semiconductor |
$SOX |
338.39 |
-0.88 |
-0.26% |
-5.98% |
| Networking |
$NWX |
234.98 |
-1.38 |
-0.58% |
+1.70% |
| Internet |
$IIX |
227.33 |
-1.34 |
-0.59% |
-2.79% |
| Broker/Dealer |
$XBD |
113.24 |
-0.40 |
-0.35% |
-1.57% |
| Retail |
$RLX |
421.35 |
+1.55 |
+0.37% |
+2.49% |
| Gold & Silver |
$XAU |
160.00 |
+4.58 |
+2.95% |
-4.90% |
| Bank |
$BKX |
47.03 |
-0.46 |
-0.97% |
+10.11% |
| Biotech |
$BTK |
1,034.10 |
-0.36 |
-0.03% |
+9.76% |
|
|
|
 |
High-Ranked Computer Software - Security Firm Perched Near Highs
Kenneth J. Gruneisen - Passed the CAN SLIM® Master's Exam
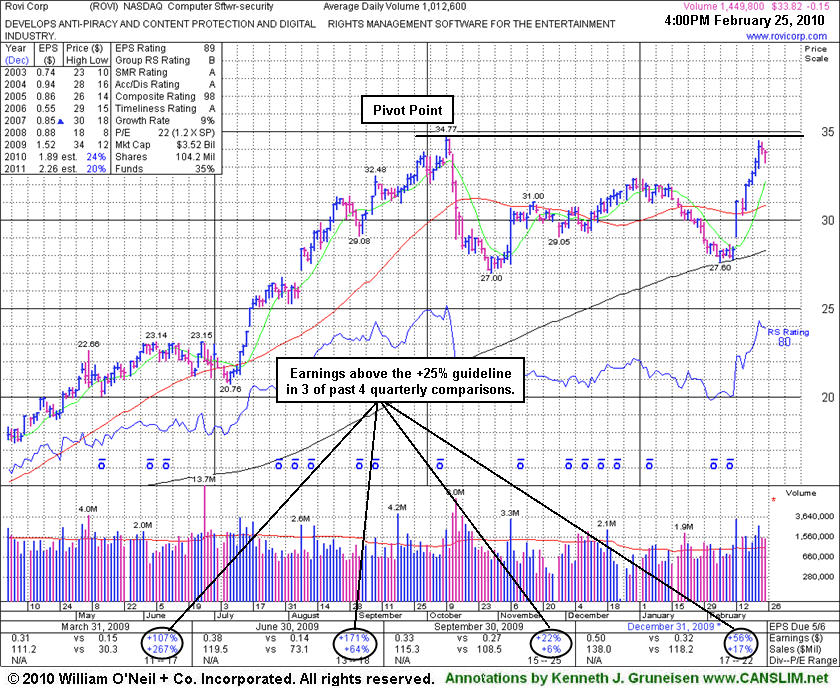
Rovi Corp (ROVI -$0.15 or -0.44% to $33.82) is consolidating after gains earlier this week helped it challenge its 52-week high. Today it was featured in yellow with pivot point based upon its 10/09/09 high noted in the mid-day report (read here). Recent gains helped it rally to new 2010 highs, however its subsequent ability to rally to a new 52-week high with at least +50% above average volume behind the gain could signal the beginning of a more substantial advance. Earnings per share increases in 3 of the past 4 quarterly comparisons versus the year ago period showed better than +25% growth.
Meanwhile, as the major averages (M criteria) have yet to produce a follow-through-day to confirm the latest rally attempt, it could spend more time consolidating on the right side of its near 4-month base. Disciplined investors would be patient and not force action without the critical reassurances of heavy institutional buying demand in the market and for this specific firm's shares.
|
|
|
Color Codes Explained :
Y - Better candidates highlighted by our
staff of experts.
G - Previously featured
in past reports as yellow but may no longer be buyable under the
guidelines.
***Last / Change / Volume quote data in this table corresponds with the timestamp on the note***
Symbol/Exchange
Company Name
Industry Group |
Last |
Chg. |
Vol
% DAV |
Date Featured |
Price Featured |
Latest Pivot Point
Featured |
Status |
| Latest Max Buy Price |
ARST
-
|
$26.97
|
+0.00
|
139,787
35% DAV
404,600
|
2/24/2010
(Date
Featured) |
$25.94
(Price
Featured) |
PP = $27.95 |
Y |
| MB = $29.35 |
Most Recent Note - 2/25/2010 4:38:18 PM
Y - Held its ground today. Color code was changed to yellow with new pivot point noted based on the 1/14/10 high while working on an 8-week "double bottom" type base. Above its 50 DMA line, the next important support level to watch now is defined by its recent low ($22.58) and its 200 DMA line. ARST was first featured in yellow at $19.91 in the 9/01/09 mid-day report with an annotated graph (read here).
>>> The latest Featured Stock Update with an annotated graph appeared on 2/17/2010. click here.
|
|
C
A
S
I |
News |
Chart |
SEC
View all notes Alert
me of new notes
Company
Profile
|
ARUN
- NASDAQ
Aruba Networks Inc
COMPUTER HARDWARE - Networking & Communication Dev
|
$11.71
|
-0.04
|
1,235,446
96% DAV
1,286,300
|
2/19/2010
(Date
Featured) |
$12.71
(Price
Featured) |
PP = $11.94 |
Y |
| MB = $12.54 |
Most Recent Note - 2/25/2010 4:43:03 PM
Y - Consolidating just under its pivot point. Its 2/19/10 gap up gain on heavy volume was featured in the mid-day report (read here) as it rose from a flat base-on-base pattern above its 50-day moving average line. Quarterly earnings increases (excluding items - click here to read about "Q2 Loss" in the Business Journal) have been strong and sales revenues in the latest quarter ended Jan 31, 2010 showed impressive acceleration.
>>> The latest Featured Stock Update with an annotated graph appeared on 2/22/2010. click here.
|
|
C
A
S
I |
News |
Chart |
SEC
View all notes Alert
me of new notes
Company
Profile
|
BIDU
- NASDAQ
Baidu Inc Ads
INTERNET - Internet Information Providers
|
$508.87
|
+3.40
|
974,505
50% DAV
1,935,000
|
1/13/2010
(Date
Featured) |
$431.25
(Price
Featured) |
PP = $426.75 |
G |
| MB = $448.09 |
Most Recent Note - 2/25/2010 4:45:45 PM
G - Gapped down and then positively reversed for a small gain today on light volume for a new high close. In the past week it has been quietly wedging to new all-time highs, getting extended above its mid-January high. Steadily rising since gapping up on 2/10/10 for a considerable gain with volume more than 3 times average.
>>> The latest Featured Stock Update with an annotated graph appeared on 2/11/2010. click here.
|
|
C
A
S
I |
News |
Chart |
SEC
View all notes Alert
me of new notes
Company
Profile
|
BRLI
- NASDAQ
Bio Reference Labs Inc
HEALTH SERVICES - Medical Laboratories & Researc
|
$40.45
|
-0.34
|
48,130
53% DAV
91,200
|
2/12/2010
(Date
Featured) |
$39.02
(Price
Featured) |
PP = $40.97 |
Y |
| MB = $43.02 |
Most Recent Note - 2/25/2010 5:04:17 PM
Y - Consolidating just below its pivot point. Its Up/Down Volume Ratio of 2.5 is a bullish indicator while consolidating for nearly 7-weeks above support at its 50 DMA line. This high-ranked Medical-Dental - Services firm was featured in yellow in the 2/12/10 mid-day report (read here). Earnings growth and sales revenues growth has accelerated, better than the +25% minimum guideline in recent quarters. Fundamentals are favorable with respect to the C and A criteria.
>>> The latest Featured Stock Update with an annotated graph appeared on 2/12/2010. click here.
|
|
C
A
S
I |
News |
Chart |
SEC
View all notes Alert
me of new notes
Company
Profile
|
CACC
- NASDAQ
Credit Acceptance Corp
FINANCIAL SERVICES - Credit Services
|
$40.54
|
-0.78
|
30,513
48% DAV
64,000
|
9/29/2009
(Date
Featured) |
$33.48
(Price
Featured) |
PP = $37.10 |
G |
| MB = $38.96 |
Most Recent Note - 2/25/2010 5:05:29 PM
G - Still holding its ground well above prior chart highs in the $37 area. This Financial firm's outlook is questionable until it trades back above its 50 DMA line.
>>> The latest Featured Stock Update with an annotated graph appeared on 2/9/2010. click here.
|
|
C
A
S
I |
News |
Chart |
SEC
View all notes Alert
me of new notes
Company
Profile
|
CRM
- NYSE
Salesforce.com Inc
INTERNET - Internet Software & Services
|
$68.01
|
-1.43
|
4,985,563
254% DAV
1,964,200
|
12/18/2009
(Date
Featured) |
$67.32
(Price
Featured) |
PP = $67.82 |
G |
| MB = $71.21 |
Most Recent Note - 2/25/2010 5:08:13 PM
G - Gapped down today following its latest earnings news, yet closed in the upper half of its intra-day range near its 50 DMA line. Recent chart low ($60.30 on 2/05/10) is an important support level to watch.
>>> The latest Featured Stock Update with an annotated graph appeared on 2/10/2010. click here.
|
|
C
A
S
I |
News |
Chart |
SEC
View all notes Alert
me of new notes
Company
Profile
|
EZPW
- NASDAQ
Ezcorp Inc Cl A
SPECIALTY RETAIL - Specialty Retail, Other
|
$19.97
|
+0.11
|
437,489
99% DAV
443,100
|
2/19/2010
(Date
Featured) |
$19.03
(Price
Featured) |
PP = $18.80 |
G |
| MB = $19.74 |
Most Recent Note - 2/25/2010 5:09:04 PM
G - Gain today with average volume closing further above its "max buy" level. Color code was changed to green. Gain on 2/22/10 with twice average volume triggered a technical buy signal. Featured in yellow in the 2/19/10 mid-day report (read here).
>>> The latest Featured Stock Update with an annotated graph appeared on 2/19/2010. click here.
|
|
C
A
S
I |
News |
Chart |
SEC
View all notes Alert
me of new notes
Company
Profile
|
GMCR
- NASDAQ
Green Mtn Coffee Roastrs
FOOD & BEVERAGE - Processed & Packaged Goods
|
$83.90
|
-0.56
|
1,033,156
72% DAV
1,430,500
|
12/28/2009
(Date
Featured) |
$77.49
(Price
Featured) |
PP = $76.50 |
G |
| MB = $80.33 |
Most Recent Note - 2/25/2010 5:13:10 PM
G - This high-ranked leader continues consolidating in a tight trading range above its 50 DMA line within close striking range of its 52-week high. Important initial support level to watch is recent lows in the $78 area.
>>> The latest Featured Stock Update with an annotated graph appeared on 2/23/2010. click here.
|
|
C
A
S
I |
News |
Chart |
SEC
View all notes Alert
me of new notes
Company
Profile
|
ISRG
- NASDAQ
Intuitive Surgical Inc
HEALTH SERVICES - Medical Appliances & Equipment
|
$343.81
|
-0.40
|
373,576
74% DAV
506,500
|
1/22/2010
(Date
Featured) |
$340.40
(Price
Featured) |
PP = $314.00 |
G |
| MB = $329.70 |
Most Recent Note - 2/25/2010 5:15:04 PM
G - Closed near the session high after a gap down today, still perched near its 52-week high. Its 50 DMA line and recent chart lows in the $315 area define important technical support. ISRG was featured again most recently in the 1/22/10 mid-day report (read here).
>>> The latest Featured Stock Update with an annotated graph appeared on 2/24/2010. click here.
|
|
C
A
S
I |
News |
Chart |
SEC
View all notes Alert
me of new notes
Company
Profile
|
PCLN
- NASDAQ
Priceline.com Inc
INTERNET - Internet Software & Services
|
$399.55
|
-4.72
|
584,812
N/A
|
11/1/2002
(Date
Featured) |
$399.55
(Price
Featured) |
PP = $428.20 |
Y |
| MB = $449.61 |
Most Recent Note - 1/2/2011
Y - Returns to Featured Stocks list with its appearance in the January 2011 CANSLIM.net News including detailed analysis and annotated daily and weekly graphs.
>>> The latest Featured Stock Update with an annotated graph appeared on 2/18/2010. click here.
|
|
C
A
S
I |
News |
Chart |
SEC
View all notes Alert
me of new notes
Company
Profile
|
PEGA
- NASDAQ
Pegasystems Inc
COMPUTER SOFTWARE & SERVICES - Business Software & Services
|
$36.79
|
+0.21
|
134,966
65% DAV
208,900
|
1/4/2010
(Date
Featured) |
$34.00
(Price
Featured) |
PP = $36.19 |
G |
| MB = $38.00 |
Most Recent Note - 2/25/2010 5:24:42 PM
G - Holding its ground, closing about -4% off its 52-week high today. Positive reversal on 2/23/10 after a brief 50 DMA line violation intra-day, it found prompt support near prior chart lows in the $32 area.
>>> The latest Featured Stock Update with an annotated graph appeared on 2/8/2010. click here.
|
|
C
A
S
I |
News |
Chart |
SEC
View all notes Alert
me of new notes
Company
Profile
|
ROVI
- NASDAQ
Rovi Corp
COMPUTER SOFTWARE & SERVICES - Security Software & Services
|
$33.82
|
-0.15
|
1,459,978
144% DAV
1,012,600
|
2/25/2010
(Date
Featured) |
$33.54
(Price
Featured) |
PP = $34.87 |
Y |
| MB = $36.61 |
Most Recent Note - 2/25/2010 5:27:19 PM
Y - Consolidating after gains earlier this week helped it challenge its 52-week high. Today it was featured in yellow with pivot point based upon its 10/09/09 high noted in the mid-day report (read here). Earnings per share increases in 3 of the past 4 quarterly comparisons versus the year ago period were +25% or greater.
>>> The latest Featured Stock Update with an annotated graph appeared on 2/25/2010. click here.
|
|
C
A
S
I |
News |
Chart |
SEC
View all notes Alert
me of new notes
Company
Profile
|
SIRO
- NASDAQ
Sirona Dental Systems
HEALTH SERVICES - Medical Instruments & Supplies
|
$35.85
|
+0.19
|
310,837
53% DAV
583,700
|
2/16/2010
(Date
Featured) |
$36.43
(Price
Featured) |
PP = $36.15 |
Y |
| MB = $37.96 |
Most Recent Note - 2/25/2010 5:54:28 PM
Y - Still quietly consolidating near its 52-week high. Holding its ground above prior chart highs and well above its 50 DMA line. It was featured in yellow in the 2/16/10 mid-day report (read here) as it broke out from a 10-week flat base.
>>> The latest Featured Stock Update with an annotated graph appeared on 2/16/2010. click here.
|
|
C
A
S
I |
News |
Chart |
SEC
View all notes Alert
me of new notes
Company
Profile
|
|
|
|
THESE ARE NOT BUY RECOMMENDATIONS!
Comments contained in the body of this report are technical
opinions only. The material herein has been obtained
from sources believed to be reliable and accurate, however,
its accuracy and completeness cannot be guaranteed.
This site is not an investment advisor, hence it does
not endorse or recommend any securities or other investments.
Any recommendation contained in this report may not
be suitable for all investors and it is not to be deemed
an offer or solicitation on our part with respect to
the purchase or sale of any securities. All trademarks,
service marks and trade names appearing in this report
are the property of their respective owners, and are
likewise used for identification purposes only.
This report is a service available
only to active Paid Premium Members.
You may opt-out of receiving report notifications
at any time. Questions or comments may be submitted
by writing to Premium Membership Services 665 S.E. 10 Street, Suite 201 Deerfield Beach, FL 33441-5634 or by calling 1-800-965-8307
or 954-785-1121.
|
|
|


