You are not logged in.
This means you
CAN ONLY VIEW reports that were published prior to Wednesday, April 9, 2025.
You
MUST UPGRADE YOUR MEMBERSHIP if you want to see any current reports.
AFTER MARKET UPDATE - FRIDAY, FEBRUARY 26TH, 2010
Previous After Market Report Next After Market Report >>>
|
|
|
|
DOW |
+4.23 |
10,325.26 |
+0.04% |
|
Volume |
1,246,712,700 |
+9% |
|
Volume |
2,360,737,950 |
+1% |
|
NASDAQ |
+4.04 |
2,238.26 |
+0.18% |
|
Advancers |
1,800 |
58% |
|
Advancers |
1,256 |
45% |
|
S&P 500 |
+1.55 |
1,104.49 |
+0.14% |
|
Decliners |
1,223 |
39% |
|
Decliners |
1,445 |
51% |
|
Russell 2000 |
-1.90 |
628.56 |
-0.30% |
|
52 Wk Highs |
186 |
|
|
52 Wk Highs |
92 |
|
|
S&P 600 |
-0.95 |
334.70 |
-0.28% |
|
52 Wk Lows |
4 |
|
|
52 Wk Lows |
7 |
|
|
 |
Latest Rally Attempt Still Lacks Confirmation After Day 15
Adam Sarhan, Contributing Writer,
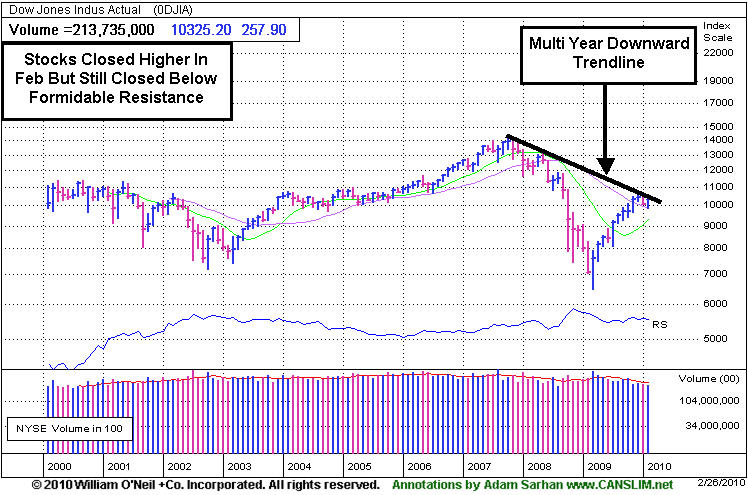
The major averages closed with negligible gains on Friday which marked the 15th day of the current rally attempt. Volume, a critical gauge of institutional demand, was reported higher than Thursday's levels on the Nasdaq exchange and on the NYSE. Advancers led decliners by a 3-to-2 ratio on the NYSE but decliners narrowly led advancers by 7-to-6 rato on the Nasdaq exchange. New 52-week highs outnumbered new lows on both exchanges and new lows were in the single digits. There were 16 high-ranked companies from the CANSLIM.net Leaders List that made a new 52-week high and appeared on the CANSLIM.net BreakOuts Page, up from the 10 issues that appeared on the prior session.
Stocks closed slightly lower on Monday after the Mortgage Bankers Association said that the percentage of loans that were in foreclosure or behind at least one payment surged to +15.02% which is the highest since the MBA's records began in 1972. Many analysts believe that foreclosures will likely stay high for the rest of the year as the economy and the jobs market continue to recover from the worst recession since WWII. Stocks got smacked on Tuesday after consumer confidence unexpectedly plunged and an IFO German business index missed estimates. The Conference Board’s index of US consumer confidence slid to 46 which was the weakest reading in 10 months and below the lowest forecast in a Bloomberg survey. It is important to note that consumer spending currently makes up approximately +75% of the US economy and the disappointing reading on consumer confidence bodes poorly for the economic recovery.
On Wednesday, stocks recovered most of what they lost on Tuesday after Fed Chairman Ben Bernanke spent the day testifying on Capital Hill. Bernanke told Congress that the Fed will eventually need to tighten monetary policy however we are still in the “nascent” stages of the economic rebound which still requires low interest rates for an extended period. This helped allay concerns that the Fed will begin raising rates more aggressively after last week's surprise discount rate hike. The Fed has left its federal funds rate, the rate banks charge each other for overnight loans, at a record low near zero for more than 14 months as the economy continues to recover.
Stocks fell sharply on Thursday but a late day rally helped the major averages close near their intra day highs. In the US, stocks opened sharply lower after two disconcerting economic reports missed estimates. At 8:30AM EST, Labor Department said initial jobless claims rose by +22,000 to +496,000 in the week ended Feb. 20 which was the level in three months. In a separate report, the Commerce Department said US durable goods excluding transportation equipment slid by -0.6% in January. This was the largest decline since August and missed the Street's estimate for a +1% increase. On Friday, investors digested four important economic reports which did little to move the market: a stronger than expected reading on Q4 GDP and Chicago PMI, a neutral reading on consumer confidence and a weaker than expected reading on existing home sales.
Barring some unforeseen event, the average company in the S&P 500 is on track to snap a record nine quarter earnings slump as earnings season slows down. It is important to note that even though over +70% of S&P 500 companies have topped the Street's Q4 estimates, 2010 earnings forecasts have fallen from the beginning of the season. Analysts believe that earnings will grow by +26.3% in 2010 which is down from the +30.6% projected in early January. In addition, the S&P 500 is trading below where it closed when earnings season began in early January.
Looking at the market, Friday marked Day 15 of a new rally attempt which means that as long as the February 5th lows are not breached the window remains open for a new follow-through day (FTD) to emerge. A new follow-through day will confirm the current rally attempt and will be produced when one of the major averages rallies at least +1.7% on higher volume than the prior session as a new batch of leaders break out of fresh bases. However, if the February 5, 2010 lows are breached then the day count will be reset and a steeper correction may unfold. So far, the market’s reaction has been tepid at best to the latest round of economic and earnings data which remains a concern. Remember that the market remains in a correction until a new new follow-through day emerges. Until then, patience is paramount.
Professional Money Management Services - A Winning System - Inquire today!
Our skilled team of portfolio managers knows how to follow the rules of this fact-based investment system. We do not follow opinion or the "conviction list" of some large Wall Street institution which would have us fully invested even during horrific bear markets. Instead, we remain fluid and only buy the best stocks when they are triggering proper technical buy signals. If you are not completely satisfied with the way your portfolio is being managed, Click here to get connected with one of our portfolio managers. *Accounts over $250,000 please. ** Serious inquires only, please.
PICTURED: The Dow Jones Industrial Average closed higher in February but failed to close above its multi-year downward trendline.
|
|
|
 |
Financial Indexes Still Giving Mixed Readings
Kenneth J. Gruneisen - Passed the CAN SLIM® Master's Exam
Modest gains from the influential financial group helped on Friday as the Bank Index ($BKX +0.89%) and Broker/Dealer Index ($XBD +0.81%) were among the sessions best group gainers. Generally defensive groups also posted small gains as the Gold & Silver Index ($XAU +0.87%), Healthcare Index ($HMO +0.40%), Integrated Oil Index ($XOI +0.31%), and Oil Services Index ($OSX +0.33%) finished with unanimous but small gains. The Biotechnology Index ($BTK +0.64%) and Internet Index ($IIX +0.30%) led the tech sector with very modest gains, meanwhile the Networking Index ($NWX +0.09%), Semiconductor Index ($SOX +0.14%), and the Retail Index ($RLX +0.05%) edged slightly higher.
Charts courtesy www.stockcharts.com
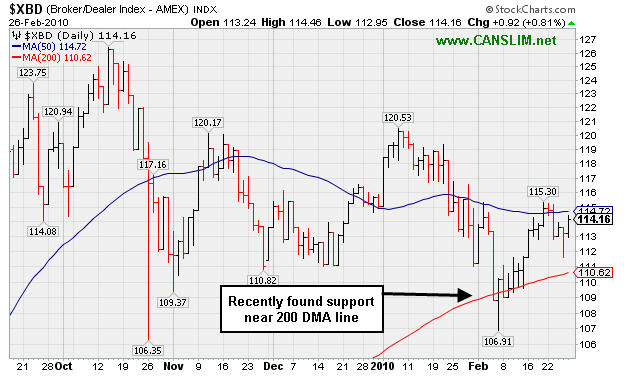
PICTURED: The Broker/Dealer Index ($XBD +0.81%) recently found support near its 200-day moving average (DMA) line, but it is trading below its 50 DMA line. It is not in as healthy shape as the Bank Index, which currently is above its shorter-term average. To help the outlook for the broader market, it would be an encouraging sign for the Broker/Dealer Index to rally above its 50 DMA and recent chart highs. If the Bank Index slumps and starts acting more like the weaker financial index, the current rally effort would be more likely to falter.
| Oil Services |
$OSX |
201.23 |
+0.66 |
+0.33% |
+3.24% |
| Healthcare |
$HMO |
1,417.91 |
+5.64 |
+0.40% |
-3.74% |
| Integrated Oil |
$XOI |
1,021.07 |
+3.13 |
+0.31% |
-4.41% |
| Semiconductor |
$SOX |
338.86 |
+0.47 |
+0.14% |
-5.85% |
| Networking |
$NWX |
235.18 |
+0.20 |
+0.09% |
+1.78% |
| Internet |
$IIX |
228.02 |
+0.69 |
+0.30% |
-2.50% |
| Broker/Dealer |
$XBD |
114.16 |
+0.92 |
+0.81% |
-0.77% |
| Retail |
$RLX |
421.58 |
+0.23 |
+0.05% |
+2.54% |
| Gold & Silver |
$XAU |
161.39 |
+1.39 |
+0.87% |
-4.08% |
| Bank |
$BKX |
47.45 |
+0.42 |
+0.89% |
+11.10% |
| Biotech |
$BTK |
1,040.76 |
+6.66 |
+0.64% |
+10.47% |
|
|
|
 |
Consolidation Continues For Computer Software Firm
Kenneth J. Gruneisen - Passed the CAN SLIM® Master's Exam
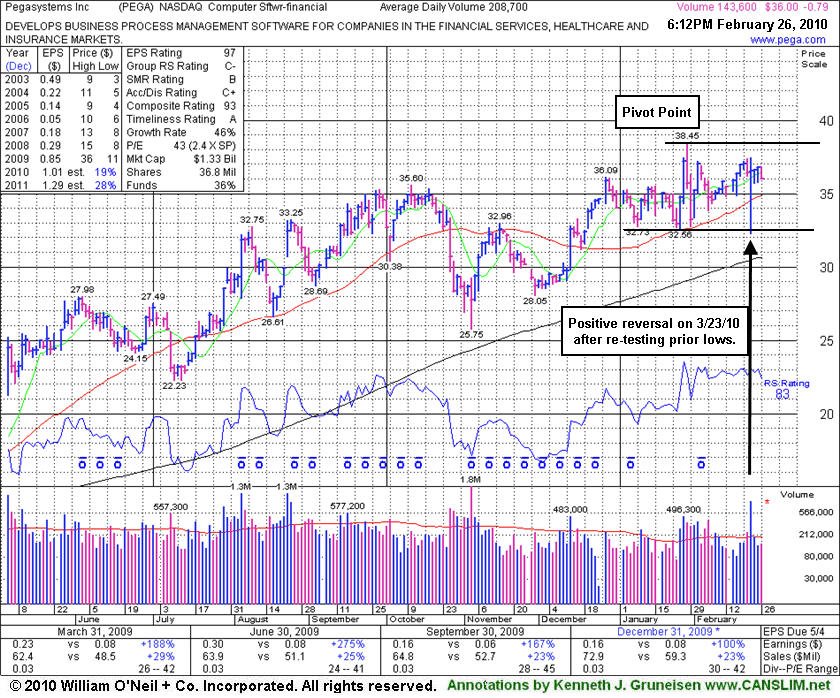
Pegasystems Inc. (PEGA -0.79 or -2.15% to $36.00) has shown mostly healthy action since its last appearance in this FSU section on 2/08/10 under the headline "Latest Breakout Promptly Failed, Yet 50 DMA Acted As Support". Now consolidating above its 50-day moving average (DMA) line for about 5-weeks since reaching its all-time high on 1/28/10, its color code was changed to yellow today with a new pivot point cited. Disciplined investors would note that it still needs a convincing gain above its pivot point to trigger a new technical buy signal. It positively reversed on 2/23/10 after a brief 50 DMA line violation, finding prompt support near prior chart lows in the $32 area. Market conditions (M criteria) are currently an overriding concern prompting great caution, since a follow-through day is currently needed from at least one of the major averages to confirm the latest rally.
PEGA was featured in the January 2010 issue of CANSLIM.net News (read here). This high-ranked Computer Software - Financial firm develops, markets, licenses, and supports software to automate various business processes primarily the United States, the United Kingdom, and Europe. It has attracted an increasing number of institutional investors, as the number of top-rated funds owning its shares rose from 43 in Sep '08 to 89 in Dec '09, which is a solid reassurance concerning the investment system's I criteria. PEGA has shown good sales revenues increases and its earnings increases were well above the +25% guideline in the 5 last quarterly comparisons versus the year ago period. The previously noted downturn in annual earnings (the A criteria) from 2003 to 2006 has been followed by a solid turn around and big earnings increases in '07, '08 and '09. The stock has built a new base but caution and patience are suggested until and the broader market (M criteria) proves itself.
|
|
|
Color Codes Explained :
Y - Better candidates highlighted by our
staff of experts.
G - Previously featured
in past reports as yellow but may no longer be buyable under the
guidelines.
***Last / Change / Volume quote data in this table corresponds with the timestamp on the note***
Symbol/Exchange
Company Name
Industry Group |
Last |
Chg. |
Vol
% DAV |
Date Featured |
Price Featured |
Latest Pivot Point
Featured |
Status |
| Latest Max Buy Price |
ARST
-
|
$26.80
|
-0.17
|
131,280
33% DAV
399,400
|
2/24/2010
(Date
Featured) |
$25.94
(Price
Featured) |
PP = $27.95 |
Y |
| MB = $29.35 |
Most Recent Note - 2/26/2010 5:14:51 PM
Y - Consolidating above its 50 DMA line, this week its color code was changed to yellow with new pivot point noted based on the 1/14/10 high while working on an 8-week "double bottom" type base. The next important support level to watch now is defined by its recent low ($22.58) and its 200 DMA line.
>>> The latest Featured Stock Update with an annotated graph appeared on 2/17/2010. click here.
|
|
C
A
S
I |
News |
Chart |
SEC
View all notes Alert
me of new notes
Company
Profile
|
ARUN
- NASDAQ
Aruba Networks Inc
COMPUTER HARDWARE - Networking & Communication Dev
|
$11.73
|
+0.02
|
1,944,087
150% DAV
1,297,700
|
2/19/2010
(Date
Featured) |
$12.71
(Price
Featured) |
PP = $11.94 |
Y |
| MB = $12.54 |
Most Recent Note - 2/26/2010 5:31:42 PM
Y - Gain with above average volume today, continuing its consolidation and closing just under its pivot point. Its 2/19/10 gap up gain on heavy volume was featured in the mid-day report (read here) as it rose from a flat base-on-base pattern above its 50-day moving average line.
>>> The latest Featured Stock Update with an annotated graph appeared on 2/22/2010. click here.
|
|
C
A
S
I |
News |
Chart |
SEC
View all notes Alert
me of new notes
Company
Profile
|
BIDU
- NASDAQ
Baidu Inc Ads
INTERNET - Internet Information Providers
|
$518.68
|
+9.81
|
1,096,301
56% DAV
1,940,700
|
1/13/2010
(Date
Featured) |
$431.25
(Price
Featured) |
PP = $426.75 |
G |
| MB = $448.09 |
Most Recent Note - 2/26/2010 5:34:18 PM
G - Gain today on light volume for a new high. For the past 2 weeks it has been quietly wedging to new all-time highs, getting extended above its mid-January high. Steadily rising since gapping up on 2/10/10 for a considerable gain with volume more than 3 times average.
>>> The latest Featured Stock Update with an annotated graph appeared on 2/11/2010. click here.
|
|
C
A
S
I |
News |
Chart |
SEC
View all notes Alert
me of new notes
Company
Profile
|
BRLI
- NASDAQ
Bio Reference Labs Inc
HEALTH SERVICES - Medical Laboratories & Researc
|
$39.61
|
-0.84
|
53,288
58% DAV
91,500
|
2/12/2010
(Date
Featured) |
$39.02
(Price
Featured) |
PP = $40.97 |
Y |
| MB = $43.02 |
Most Recent Note - 2/26/2010 5:37:01 PM
Y - Closed the week with 2 consecutive light volume losses, consolidating just below its pivot point. Its Up/Down Volume Ratio of 2.4 is a bullish indicator while consolidating for 8-weeks above support at its 50 DMA line. This high-ranked Medical-Dental - Services firm was featured in yellow in the 2/12/10 mid-day report (read here).
>>> The latest Featured Stock Update with an annotated graph appeared on 2/12/2010. click here.
|
|
C
A
S
I |
News |
Chart |
SEC
View all notes Alert
me of new notes
Company
Profile
|
CACC
- NASDAQ
Credit Acceptance Corp
FINANCIAL SERVICES - Credit Services
|
$40.17
|
-0.37
|
26,954
42% DAV
63,800
|
9/29/2009
(Date
Featured) |
$33.48
(Price
Featured) |
PP = $37.10 |
G |
| MB = $38.96 |
Most Recent Note - 2/26/2010 5:38:02 PM
G - Holding its ground stubbornly in the past couple of weeks, consolidating well above prior chart highs in the $37 area. This Financial firm's outlook is questionable until it trades back above its 50 DMA line.
>>> The latest Featured Stock Update with an annotated graph appeared on 2/9/2010. click here.
|
|
C
A
S
I |
News |
Chart |
SEC
View all notes Alert
me of new notes
Company
Profile
|
CRM
- NYSE
Salesforce.com Inc
INTERNET - Internet Software & Services
|
$67.95
|
-0.06
|
2,519,029
124% DAV
2,029,000
|
12/18/2009
(Date
Featured) |
$67.32
(Price
Featured) |
PP = $67.82 |
G |
| MB = $71.21 |
Most Recent Note - 2/26/2010 5:42:16 PM
G - Finished close to its intra-day high and near its 50 DMA line, holding its ground near that important short-term average after a small gap down loss on high volume on 2/25/10 following its latest earnings news. Recent chart low ($60.30 on 2/05/10) is an important support level to watch.
>>> The latest Featured Stock Update with an annotated graph appeared on 2/10/2010. click here.
|
|
C
A
S
I |
News |
Chart |
SEC
View all notes Alert
me of new notes
Company
Profile
|
EZPW
- NASDAQ
Ezcorp Inc Cl A
SPECIALTY RETAIL - Specialty Retail, Other
|
$19.73
|
-0.24
|
471,041
106% DAV
445,200
|
2/19/2010
(Date
Featured) |
$19.03
(Price
Featured) |
PP = $18.80 |
G |
| MB = $19.74 |
Most Recent Note - 2/26/2010 5:47:11 PM
G - Finished a solid up week perched near its "max buy" level, a bit extended from its prior base. Gain on 2/22/10 with twice average volume triggered a technical buy signal. Featured in yellow in the 2/19/10 mid-day report (read here).
>>> The latest Featured Stock Update with an annotated graph appeared on 2/19/2010. click here.
|
|
C
A
S
I |
News |
Chart |
SEC
View all notes Alert
me of new notes
Company
Profile
|
GMCR
- NASDAQ
Green Mtn Coffee Roastrs
FOOD & BEVERAGE - Processed & Packaged Goods
|
$84.39
|
+0.49
|
680,481
48% DAV
1,414,500
|
2/26/2010
(Date
Featured) |
$84.39
(Price
Featured) |
PP = $88.75 |
Y |
| MB = $93.19 |
Most Recent Note - 2/26/2010 5:50:41 PM
Y - This high-ranked leader continues consolidating in a tight trading range above its 50 DMA line within close striking range of its 52-week high. Color code is changed to yellow with new pivot point cited. Important initial support level to watch is recent lows in the $78 area.
>>> The latest Featured Stock Update with an annotated graph appeared on 2/23/2010. click here.
|
|
C
A
S
I |
News |
Chart |
SEC
View all notes Alert
me of new notes
Company
Profile
|
ISRG
- NASDAQ
Intuitive Surgical Inc
HEALTH SERVICES - Medical Appliances & Equipment
|
$347.14
|
+3.33
|
346,746
68% DAV
508,100
|
1/22/2010
(Date
Featured) |
$340.40
(Price
Featured) |
PP = $314.00 |
G |
| MB = $329.70 |
Most Recent Note - 2/26/2010 5:52:45 PM
G - Gain today on light volume for a new high close, perched near its 52-week and all-time highs. Its 50 DMA line and recent chart lows in the $315 area define important technical support. ISRG was featured again most recently in the 1/22/10 mid-day report (read here).
>>> The latest Featured Stock Update with an annotated graph appeared on 2/24/2010. click here.
|
|
C
A
S
I |
News |
Chart |
SEC
View all notes Alert
me of new notes
Company
Profile
|
PCLN
- NASDAQ
Priceline.com Inc
INTERNET - Internet Software & Services
|
$399.55
|
-4.72
|
584,812
N/A
|
11/1/2002
(Date
Featured) |
$399.55
(Price
Featured) |
PP = $428.20 |
Y |
| MB = $449.61 |
Most Recent Note - 1/2/2011
Y - Returns to Featured Stocks list with its appearance in the January 2011 CANSLIM.net News including detailed analysis and annotated daily and weekly graphs.
>>> The latest Featured Stock Update with an annotated graph appeared on 2/18/2010. click here.
|
|
C
A
S
I |
News |
Chart |
SEC
View all notes Alert
me of new notes
Company
Profile
|
PEGA
- NASDAQ
Pegasystems Inc
COMPUTER SOFTWARE & SERVICES - Business Software & Services
|
$36.00
|
-0.79
|
161,223
77% DAV
208,700
|
2/26/2010
(Date
Featured) |
$36.00
(Price
Featured) |
PP = $38.55 |
Y |
| MB = $40.48 |
Most Recent Note - 2/26/2010 6:06:10 PM
Y - Consolidating above its 50 DMA line, its color code is changed to yellow with new pivot point cited. Positively reversed on 2/23/10 after a brief 50 DMA line violation, it found prompt support near prior chart lows in the $32 area.
>>> The latest Featured Stock Update with an annotated graph appeared on 2/26/2010. click here.
|
|
C
A
S
I |
News |
Chart |
SEC
View all notes Alert
me of new notes
Company
Profile
|
ROVI
- NASDAQ
Rovi Corp
COMPUTER SOFTWARE & SERVICES - Security Software & Services
|
$33.50
|
-0.32
|
1,117,670
110% DAV
1,015,200
|
2/25/2010
(Date
Featured) |
$33.54
(Price
Featured) |
PP = $34.87 |
Y |
| MB = $36.61 |
Most Recent Note - 2/26/2010 6:08:47 PM
Y - Edging lower for 3 consecutive sessions, consolidating near its 52-week high. Featured on 2/25/10 in yellow in the mid-day report (read here). Earnings per share increases in 3 of the past 4 quarterly comparisons versus the year ago period were +25% or greater.
>>> The latest Featured Stock Update with an annotated graph appeared on 2/25/2010. click here.
|
|
C
A
S
I |
News |
Chart |
SEC
View all notes Alert
me of new notes
Company
Profile
|
SIRO
- NASDAQ
Sirona Dental Systems
HEALTH SERVICES - Medical Instruments & Supplies
|
$35.89
|
+0.04
|
418,137
77% DAV
540,200
|
2/16/2010
(Date
Featured) |
$36.43
(Price
Featured) |
PP = $36.15 |
Y |
| MB = $37.96 |
Most Recent Note - 2/26/2010 6:10:10 PM
Y - Today it posted a 3rd consecutive small gain on light volume, quietly consolidating near its 52-week high. Holding its ground above prior chart highs and well above its 50 DMA line. It was featured in yellow in the 2/16/10 mid-day report (read here) as it broke out from a 10-week flat base.
>>> The latest Featured Stock Update with an annotated graph appeared on 2/16/2010. click here.
|
|
C
A
S
I |
News |
Chart |
SEC
View all notes Alert
me of new notes
Company
Profile
|
|
|
|
THESE ARE NOT BUY RECOMMENDATIONS!
Comments contained in the body of this report are technical
opinions only. The material herein has been obtained
from sources believed to be reliable and accurate, however,
its accuracy and completeness cannot be guaranteed.
This site is not an investment advisor, hence it does
not endorse or recommend any securities or other investments.
Any recommendation contained in this report may not
be suitable for all investors and it is not to be deemed
an offer or solicitation on our part with respect to
the purchase or sale of any securities. All trademarks,
service marks and trade names appearing in this report
are the property of their respective owners, and are
likewise used for identification purposes only.
This report is a service available
only to active Paid Premium Members.
You may opt-out of receiving report notifications
at any time. Questions or comments may be submitted
by writing to Premium Membership Services 665 S.E. 10 Street, Suite 201 Deerfield Beach, FL 33441-5634 or by calling 1-800-965-8307
or 954-785-1121.
|
|
|


