***Last / Change / Volume data in this table is the closing quote data***
Symbol/Exchange
Company Name
Industry Group |
PRICE |
CHANGE
(%Change) |
Day High |
Volume
(% DAV)
(% 50 day avg vol) |
52 Wk Hi
% From Hi |
Featured
Date |
Price
Featured |
Pivot Featured |
|
Max Buy |
BIDU
-
NASDAQ
Baidu Inc Ads
INTERNET - Internet Information Providers
|
$120.28
|
-6.52
-5.14% |
$123.74
|
9,439,974
127.47% of 50 DAV
50 DAV is 7,405,700
|
$131.63
-8.62%
|
2/1/2011
|
$117.74
|
PP = $112.08
|
|
MB = $117.68
|
 Most Recent Note - 2/22/2011 2:21:18 PM
G - Gapped down today amid widespread market weakness, pulling back from all-time highs with higher volume behind its damaging loss. Prior highs in the $112-115 area define initial chart support to watch above its 50 DMA line.
>>> The latest Featured Stock Update with an annotated graph appeared on 2/2/2011. Click here.
View all notes |
Alert me of new notes |
CANSLIM.net Company Profile |
SEC |
Zacks Reports |
StockTalk |
News |
Chart |
Request a new note
C
A N
S L
I M


|
CMG
-
NYSE
Chipotle Mexican Grill
LEISURE - Restaurants
|
$251.90
|
-8.25
-3.17% |
$259.55
|
893,148
86.71% of 50 DAV
50 DAV is 1,030,000
|
$275.00
-8.40%
|
2/11/2011
|
$271.15
|
PP = $262.87
|
|
MB = $276.01
|
Most Recent Note - 2/22/2011 5:42:39 PM
Y - Down today on light volume following signs of distributional pressure last week, and it slumped further below its pivot point, raising concerns. Recently reported strong earnings and technically rallied "straight up from the bottom" from an 11-week cup shaped base without a handle.
>>> The latest Featured Stock Update with an annotated graph appeared on 2/11/2011. Click here.
View all notes |
Alert me of new notes |
CANSLIM.net Company Profile |
SEC |
Zacks Reports |
StockTalk |
News |
Chart |
Request a new note
C
A N
S L
I M
|
CRUS
-
NASDAQ
Cirrus Logic Inc
ELECTRONICS - Semiconductor - Specialized
|
$23.34
|
-1.24
-5.04% |
$24.12
|
3,953,408
122.38% of 50 DAV
50 DAV is 3,230,400
|
$25.48
-8.40%
|
1/28/2011
|
$20.69
|
PP = $19.17
|
|
MB = $20.13
|
Most Recent Note - 2/22/2011 2:25:14 PM
G - Gapped down today amid widespread market weakness. Recently noted - "Extended from its latest sound base pattern. Patience may allow for secondary buy points to develop. Prior highs define chart support levels to watch on pullbacks."
>>> The latest Featured Stock Update with an annotated graph appeared on 1/28/2011. Click here.
View all notes |
Alert me of new notes |
CANSLIM.net Company Profile |
SEC |
Zacks Reports |
StockTalk |
News |
Chart |
Request a new note
C
A N
S L
I M
|
CTSH
-
NASDAQ
Cognizant Tech Sol Cl A
COMPUTER SOFTWARE and SERVICES - Business Software and Services
|
$75.55
|
-2.18
-2.80% |
$77.04
|
2,683,265
122.03% of 50 DAV
50 DAV is 2,198,900
|
$77.74
-2.82%
|
2/7/2011
|
$75.09
|
PP = $76.46
|
|
MB = $80.28
|
Most Recent Note - 2/22/2011 5:46:05 PM
Y - Gapped down today and its loss with 22% above average volume erased a recent streak of small gains for new 52-week highs and led to a close back below its pivot point. Found support at its 50 DMA line recently, and it faces no resistance due to overhead supply.
>>> The latest Featured Stock Update with an annotated graph appeared on 2/8/2011. Click here.
View all notes |
Alert me of new notes |
CANSLIM.net Company Profile |
SEC |
Zacks Reports |
StockTalk |
News |
Chart |
Request a new note
C
A N
S L
I M
|
DECK
-
NASDAQ
Deckers Outdoor Corp
CONSUMER NON-DURABLES - Textile - Apparel Footwear
|
$89.00
|
-1.03
-1.14% |
$92.69
|
2,249,111
146.50% of 50 DAV
50 DAV is 1,535,200
|
$92.67
-3.96%
|
2/3/2011
|
$79.61
|
PP = $82.67
|
|
MB = $86.80
|
Most Recent Note - 2/18/2011 4:51:46 PM
Y - Held its ground at an all-time high today. Technically, it managed a powerful positive reversal on 2/17/11 and clinched a late buy signal based on the previously noted "double bottom" base pattern. The recent consolidation was too short to be considered a proper "handle" on a cup-with-handle pattern, however one may also consider it to be rising from a 9-week flat base (no new pivot point is being cited). The stock is free of all resistance due to overhead supply.
>>> The latest Featured Stock Update with an annotated graph appeared on 1/26/2011. Click here.
View all notes |
Alert me of new notes |
CANSLIM.net Company Profile |
SEC |
Zacks Reports |
StockTalk |
News |
Chart |
Request a new note
C
A N
S L
I M
|
Symbol/Exchange
Company Name
Industry Group |
PRICE |
CHANGE
(%Change) |
Day High |
Volume
(% DAV)
(% 50 day avg vol) |
52 Wk Hi
% From Hi |
Featured
Date |
Price
Featured |
Pivot Featured |
|
Max Buy |
EZCH
-
NASDAQ
Ezchip Semiconductor Ltd
ELECTRONICS - Semiconductor - Specialized
|
$28.77
|
-1.24
-4.13% |
$29.49
|
568,246
151.86% of 50 DAV
50 DAV is 374,200
|
$33.48
-14.07%
|
12/2/2010
|
$27.53
|
PP = $26.00
|
|
MB = $27.30
|
Most Recent Note - 2/22/2011 2:45:04 PM
G - Gapped down today for a loss on higher volume, raising concerns while diving under its 50 DMA line amid widespread market weakness. A prompt rebound above its short-term average would help its outlook, meanwhile it faces overhead supply now up through the $33 area which may hinder its ability to rally.
>>> The latest Featured Stock Update with an annotated graph appeared on 1/21/2011. Click here.
View all notes |
Alert me of new notes |
CANSLIM.net Company Profile |
SEC |
Zacks Reports |
StockTalk |
News |
Chart |
Request a new note
C
A N
S L
I M
|
EZPW
-
NASDAQ
Ezcorp Inc Cl A
SPECIALTY RETAIL - Specialty Retail, Other
|
$27.85
|
-0.09
-0.32% |
$28.11
|
359,263
93.17% of 50 DAV
50 DAV is 385,600
|
$29.94
-6.98%
|
2/18/2011
|
$27.94
|
PP = $30.04
|
|
MB = $31.54
|
Most Recent Note - 2/18/2011 5:01:15 PM
Y - Staying near its 50 DMA line and showing resilience in recent weeks. Color code is changed to yellow with new pivot point cited based on its 1/17/11 high plus ten cents after a short flat base. Subsequent gains with heavy volume with a rally above its pivot point may trigger a new (or add-on) technical buy signal. Recent low ($25.56 on 1/25/11) defines an important support level now.
>>> The latest Featured Stock Update with an annotated graph appeared on 2/3/2011. Click here.
View all notes |
Alert me of new notes |
CANSLIM.net Company Profile |
SEC |
Zacks Reports |
StockTalk |
News |
Chart |
Request a new note
C
A N
S L
I M
|
FOSL
-
NASDAQ
Fossil Inc
CONSUMER DURABLES - Recreational Goods, Other
|
$77.57
|
-1.32
-1.67% |
$79.25
|
975,754
127.27% of 50 DAV
50 DAV is 766,700
|
$83.68
-7.30%
|
2/1/2011
|
$73.30
|
PP = $74.44
|
|
MB = $78.16
|
Most Recent Note - 2/18/2011 5:03:40 PM
G - This week it held its ground following a gap down on 2/15/11 after 8 consecutive gains into new high territory. Reported earnings +42% on +33% sales revenues. Prior resistance in the $74 area defines initial chart support above its 50 DMA line.
>>> The latest Featured Stock Update with an annotated graph appeared on 1/12/2011. Click here.
View all notes |
Alert me of new notes |
CANSLIM.net Company Profile |
SEC |
Zacks Reports |
StockTalk |
News |
Chart |
Request a new note
C
A N
S L
I M
|
GSIT
-
NASDAQ
G S I Technology Inc
ELECTRONICS - Semiconductor - Broad Line
|
$9.27
|
-0.51
-5.21% |
$9.69
|
369,241
152.52% of 50 DAV
50 DAV is 242,100
|
$10.20
-9.12%
|
2/18/2011
|
$10.08
|
PP = $10.25
|
|
MB = $10.76
|
Most Recent Note - 2/22/2011 2:34:01 PM
G - Gapped down today amid widespread market weakness. Color code is changed to green after erasing the prior session's gain raises concerns. It closed the 2/18/11 session in the middle of its intra-day range with a gain backed by more than 4 times average volume, and disciplined investors should note that it did not trigger a proper technical buy signal. Reported earnings +186% on +51% sales revenues for the quarter ended December 31, 2010 versus the year ago period. Volume and volatility often increase near earnings news. Pivot point cited was based on its 1/18/11 high plus 10 cents. A convincing volume-driven close above its pivot point may trigger a technical buy signal. See the latest FSU analysis for details and an annotated graph. Prior mid-day reports noted - "Leadership (L criteria) in the Semiconductor group is also reassuring. Caution is called for, as the investment system guidelines discourage buying low-priced stocks."
>>> The latest Featured Stock Update with an annotated graph appeared on 2/18/2011. Click here.
View all notes |
Alert me of new notes |
CANSLIM.net Company Profile |
SEC |
Zacks Reports |
StockTalk |
News |
Chart |
Request a new note
C
A N
S L
I M
|
HMSY
-
NASDAQ
H M S Holdings Corp
COMPUTER SOFTWARE and SERVICES - Healthcare Information Service
|
$76.61
|
+2.69
3.64% |
$77.43
|
350,813
230.65% of 50 DAV
50 DAV is 152,100
|
$74.28
3.14%
|
11/19/2010
|
$61.89
|
PP = $63.01
|
|
MB = $66.16
|
Most Recent Note - 2/22/2011 12:28:56 PM
G - Hit yet another new 52-week high today with its 15th consecutive gain with ever-increasing volume since it found support at its 50 DMA line. Relative Strength rank has improved to 81. It is extended from any sound base pattern.
>>> The latest Featured Stock Update with an annotated graph appeared on 2/16/2011. Click here.
View all notes |
Alert me of new notes |
CANSLIM.net Company Profile |
SEC |
Zacks Reports |
StockTalk |
News |
Chart |
Request a new note
C
A N
S L
I M
|
Symbol/Exchange
Company Name
Industry Group |
PRICE |
CHANGE
(%Change) |
Day High |
Volume
(% DAV)
(% 50 day avg vol) |
52 Wk Hi
% From Hi |
Featured
Date |
Price
Featured |
Pivot Featured |
|
Max Buy |
JOBS
-
NASDAQ
Fifty One Job Inc Ads
DIVERSIFIED SERVICES - Staffing and; Outsourcing Service
|
$56.95
|
-3.00
-5.00% |
$59.71
|
167,637
127.19% of 50 DAV
50 DAV is 131,800
|
$61.99
-8.13%
|
2/7/2011
|
$59.23
|
PP = $61.38
|
|
MB = $64.45
|
Most Recent Note - 2/22/2011 2:36:41 PM
Y - Gapped down today amid widespread market weakness. Now -7.6% off its all-time high reached on the prior session. Recent gains lacked the volume conviction to produce a powerful breakout. Its 50 DMA line and recent low ($52.58 on 1/28/11) define important support where violations would raise concerns and trigger technical sell signals. After a long ascending base pattern, subsequent volume-driven gains above its pivot point may trigger a new (or add-on) technical buy signal.
>>> The latest Featured Stock Update with an annotated graph appeared on 2/7/2011. Click here.
View all notes |
Alert me of new notes |
CANSLIM.net Company Profile |
SEC |
Zacks Reports |
StockTalk |
News |
Chart |
Request a new note
C
A N
S L
I M
|
LULU
-
NASDAQ
Lululemon Athletica
MANUFACTURING - Textile Manufacturing
|
$79.12
|
-3.00
-3.65% |
$81.39
|
1,992,146
86.97% of 50 DAV
50 DAV is 2,290,600
|
$85.28
-7.22%
|
1/26/2011
|
$68.11
|
PP = $74.70
|
|
MB = $78.44
|
Most Recent Note - 2/22/2011 2:38:02 PM
G - Pulling back from its 52-week high, it is slightly extended from its latest sound base. Prior highs near $74 define chart support to watch now along with its 50 DMA line.
>>> The latest Featured Stock Update with an annotated graph appeared on 1/14/2011. Click here.
View all notes |
Alert me of new notes |
CANSLIM.net Company Profile |
SEC |
Zacks Reports |
StockTalk |
News |
Chart |
Request a new note
C
A N
S L
I M
|
MWIV
-
NASDAQ
M W I Veterinary Supply
HEALTH SERVICES - Medical Instruments and; Supplies
|
$67.24
|
-1.13
-1.65% |
$69.05
|
97,470
143.97% of 50 DAV
50 DAV is 67,700
|
$72.27
-6.96%
|
11/4/2010
|
$61.79
|
PP = $59.60
|
|
MB = $62.58
|
Most Recent Note - 2/18/2011 5:13:09 PM
G - Held its ground today after an analyst downgrade and gap down on the prior session from its all-time high. It has not built a sound new base pattern. Prior highs in the $67 area define initial chart support to watch. Sales revenues acceleration (bigger percentage increases sequentially, +34%, +41%, +45% and +55% in the Mar, Jun, Sep, and Dec '10 quarterly comparisons versus the year earlier) is a very reassuring sign.
>>> The latest Featured Stock Update with an annotated graph appeared on 2/2/2011. Click here.
View all notes |
Alert me of new notes |
CANSLIM.net Company Profile |
SEC |
Zacks Reports |
StockTalk |
News |
Chart |
Request a new note
C
A N
S L
I M
|
NFLX
-
NASDAQ
Netflix Inc
SPECIALTY RETAIL - Music and Video Stores
|
$221.60
|
-13.91
-5.91% |
$229.41
|
7,910,891
145.97% of 50 DAV
50 DAV is 5,419,400
|
$247.55
-10.48%
|
1/10/2011
|
$187.88
|
PP = $209.34
|
|
MB = $219.81
|
Most Recent Note - 2/22/2011 10:44:50 AM
G - Gapped down today, on track for a 5th consecutive loss. Currently -8.5% off its all-time high, extended from any sound base pattern. Prior high ($209) defines support to watch above its 50 DMA line.
>>> The latest Featured Stock Update with an annotated graph appeared on 1/10/2011. Click here.
View all notes |
Alert me of new notes |
CANSLIM.net Company Profile |
SEC |
Zacks Reports |
StockTalk |
News |
Chart |
Request a new note
C
A N
S L
I M
|
NTAP
-
NASDAQ
Netapp Inc
COMPUTER HARDWARE - Data Storage Devices
|
$51.84
|
-1.21
-2.28% |
$52.36
|
10,784,419
215.37% of 50 DAV
50 DAV is 5,007,300
|
$61.02
-15.04%
|
1/6/2011
|
$57.49
|
PP = $58.06
|
|
MB = $60.96
|
Most Recent Note - 2/22/2011 10:49:51 AM
G - Gapped down today, and it is currently -15% off its 52-week high. Damaging losses last week violated the prior chart low ($53.14) and its 50 DMA line triggering technical sell signals. An earlier low (on 11/1710) and its 200 DMA line define the next chart support levels to watch.
>>> The latest Featured Stock Update with an annotated graph appeared on 2/4/2011. Click here.
View all notes |
Alert me of new notes |
CANSLIM.net Company Profile |
SEC |
Zacks Reports |
StockTalk |
News |
Chart |
Request a new note
C
A N
S L
I M
|
Symbol/Exchange
Company Name
Industry Group |
PRICE |
CHANGE
(%Change) |
Day High |
Volume
(% DAV)
(% 50 day avg vol) |
52 Wk Hi
% From Hi |
Featured
Date |
Price
Featured |
Pivot Featured |
|
Max Buy |
OPEN
-
NASDAQ
Opentable Inc
INTERNET - Internet Software and Services
|
$86.20
|
-3.84
-4.26% |
$90.33
|
1,378,224
146.85% of 50 DAV
50 DAV is 938,500
|
$95.97
-10.18%
|
1/5/2011
|
$74.05
|
PP = $76.79
|
|
MB = $80.63
|
Most Recent Note - 2/22/2011 5:30:08 PM
G - Down today with another damaging loss on higher volume amid widespread market weakness. Recently noted as extended from a sound base pattern, meanwhile prior highs define support above its 50 DMA line. See the latest FSU summary for more details and an annotated graph.
>>> The latest Featured Stock Update with an annotated graph appeared on 2/15/2011. Click here.
View all notes |
Alert me of new notes |
CANSLIM.net Company Profile |
SEC |
Zacks Reports |
StockTalk |
News |
Chart |
Request a new note
C
A N
S L
I M
|
ORCL
-
NASDAQ
Oracle Corp
COMPUTER SOFTWARE and SERVICES - Application Software
|
$32.53
|
-1.15
-3.41% |
$33.66
|
24,880,544
95.77% of 50 DAV
50 DAV is 25,978,900
|
$33.71
-3.50%
|
1/20/2011
|
$32.31
|
PP = $32.37
|
|
MB = $33.99
|
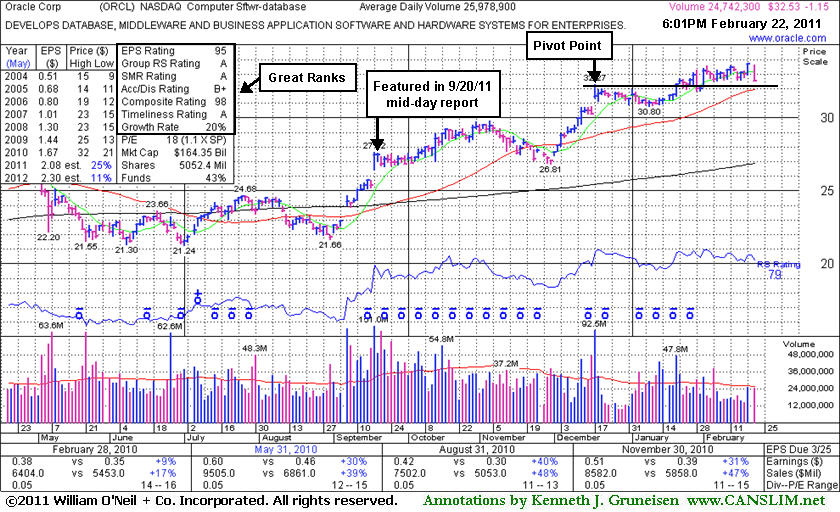
Most Recent Note - 2/22/2011 5:33:57 PM
Y - Considerable loss today on near average volume. It closed near the session low just -3.5% off last week's new 52-week high. Recently volume had been cooling while hovering below its "max buy" level. Near-term support to watch is its 50 DMA line.
>>> The latest Featured Stock Update with an annotated graph appeared on 2/22/2011. Click here.
View all notes |
Alert me of new notes |
CANSLIM.net Company Profile |
SEC |
Zacks Reports |
StockTalk |
News |
Chart |
Request a new note
C
A N
S L
I M
|
PAY
-
NYSE
Verifone Systems Inc
COMPUTER HARDWARE - Transaction Automation Systems
|
$45.04
|
-1.82
-3.88% |
$46.29
|
1,638,731
110.67% of 50 DAV
50 DAV is 1,480,800
|
$49.91
-9.76%
|
1/27/2011
|
$41.77
|
PP = $44.97
|
|
MB = $47.22
|
Most Recent Note - 2/22/2011 5:39:36 PM
Y - Down again today with above average (but lighter than the prior session) volume, pulling back from its 52-week high. Slumped to a close back below its "max buy" level last week and its color code was changed to yellow. It has erased most of its gains since it triggered a new (or add-on) technical buy signal on 2/14/11.
>>> The latest Featured Stock Update with an annotated graph appeared on 1/27/2011. Click here.
View all notes |
Alert me of new notes |
CANSLIM.net Company Profile |
SEC |
Zacks Reports |
StockTalk |
News |
Chart |
Request a new note
C
A N
S L
I M
|
PCLN
-
NASDAQ
Priceline.Com Inc
INTERNET - Internet Software and Services
|
$433.78
|
-15.15
-3.37% |
$444.91
|
1,333,263
143.13% of 50 DAV
50 DAV is 931,500
|
$464.47
-6.61%
|
1/3/2011
|
$399.55
|
PP = $428.20
|
|
MB = $449.61
|
Most Recent Note - 2/22/2011 1:22:02 PM
Y - Gapped down today amid widespread market weakness. Slumping near its 50 DMA line which defines important support to watch. Color code was changed to yellow after consolidating back below its "max buy" level as it closed out last week.
>>> The latest Featured Stock Update with an annotated graph appeared on 2/14/2011. Click here.
View all notes |
Alert me of new notes |
CANSLIM.net Company Profile |
SEC |
Zacks Reports |
StockTalk |
News |
Chart |
Request a new note
C
A N
S L
I M
|
RAX
-
NYSE
Rackspace Hosting Inc
INTERNET - Internet Software and; Services
|
$36.87
|
-1.58
-4.11% |
$38.34
|
1,741,075
93.18% of 50 DAV
50 DAV is 1,868,600
|
$40.62
-9.23%
|
1/10/2011
|
$22.84
|
PP = $32.76
|
|
MB = $34.40
|
Most Recent Note - 2/22/2011 2:40:36 PM
G - Pulling back -8.4% off its all-time high, down today amid widespread market weakness. Recent highs near $35 define support to watch above its 50 DMA line. Recently noted - "Extended from any sound base."
>>> The latest Featured Stock Update with an annotated graph appeared on 2/9/2011. Click here.
View all notes |
Alert me of new notes |
CANSLIM.net Company Profile |
SEC |
Zacks Reports |
StockTalk |
News |
Chart |
Request a new note
C
A N
S L
I M
|
Symbol/Exchange
Company Name
Industry Group |
PRICE |
CHANGE
(%Change) |
Day High |
Volume
(% DAV)
(% 50 day avg vol) |
52 Wk Hi
% From Hi |
Featured
Date |
Price
Featured |
Pivot Featured |
|
Max Buy |
TIBX
-
NASDAQ
Tibco Software Inc
COMPUTER SOFTWARE and SERVICES - Business Software and Services
|
$24.18
|
-1.38
-5.40% |
$25.16
|
3,248,514
120.10% of 50 DAV
50 DAV is 2,704,900
|
$25.94
-6.78%
|
2/1/2011
|
$24.35
|
PP = $22.18
|
|
MB = $23.29
|
Most Recent Note - 2/22/2011 2:23:39 PM
G - Gapped down today amid widespread market weakness, pulling back on higher volume after recently wedging up to new 52-week highs with gains on lighter volume. Extended from its latest sound base, its prior highs in the $22 area define support.
>>> The latest Featured Stock Update with an annotated graph appeared on 2/10/2011. Click here.
View all notes |
Alert me of new notes |
CANSLIM.net Company Profile |
SEC |
Zacks Reports |
StockTalk |
News |
Chart |
Request a new note
C
A N
S L
I M
|
UA
-
NYSE
Under Armour Inc Cl A
CONSUMER NON-DURABLES - Textile - Apparel Clothing
|
$66.15
|
-1.69
-2.49% |
$68.53
|
527,956
66.96% of 50 DAV
50 DAV is 788,500
|
$70.43
-6.08%
|
1/27/2011
|
$58.31
|
PP = $56.99
|
|
MB = $59.84
|
Most Recent Note - 2/18/2011 5:44:06 PM
G - Quietly hovering near its 52-week high, holding its ground following a recent spurt of gains with above average volume. Prior resistance in the $60 area defines initial support to watch above its 50 DMA line.
>>> The latest Featured Stock Update with an annotated graph appeared on 2/1/2011. Click here.
View all notes |
Alert me of new notes |
CANSLIM.net Company Profile |
SEC |
Zacks Reports |
StockTalk |
News |
Chart |
Request a new note
C
A N
S L
I M
|
ULTA
-
NASDAQ
Ulta Salon Cosm & Frag
SPECIALTY RETAIL - Specialty Retail, Other
|
$42.55
|
-0.91
-2.09% |
$43.99
|
684,703
127.72% of 50 DAV
50 DAV is 536,100
|
$44.06
-3.43%
|
1/6/2011
|
$36.12
|
PP = $37.34
|
|
MB = $39.21
|
Most Recent Note - 2/18/2011 5:45:22 PM
G - Inched higher for new all-time highs with small gains on average or light volume in recent weeks. It is extended from a sound base pattern, and prior highs in the $37-38 area define chart support to watch above its 50 DMA line.
>>> The latest Featured Stock Update with an annotated graph appeared on 2/17/2011. Click here.
View all notes |
Alert me of new notes |
CANSLIM.net Company Profile |
SEC |
Zacks Reports |
StockTalk |
News |
Chart |
Request a new note
C
A N
S L
I M
|